概率同統計學詞彙表
統計學同概率入面嘅術語同概念嘅詞彙表 From Wikipedia, the free encyclopedia
Remove ads
概率論[e 1]係數學一個子領域,專門研究概率(又叫機會率)相關嘅問題:概率係一啲描述隨機過程嘅結果嘅數值,例如掟一個冇出千嘅銀仔,出公嘅概率係 50%,所以對於思考不確定性嚟講不可或缺[1]。
統計學[e 2]就係專門研究點樣喺各個科學領域當中搜集、分析同呈現數據,而實證嘅科學方法本質上就帶有不確定-理論上,淨係抽個樣本嚟睇嘅過程就必然會有「手上個樣本有幾大機會真係代表到個總體嘅實況」嘅問題,所以統計學嘅理論思考梗會用到概率論[2][3]。
除此之外,噉亦即係話概率論同統計學本質上就係一啲可以攞嚟「喺有不確定性嘅情況下,按過去經驗預測未來」嘅工具,所以呢個表入面嗰啲詞彙同概念响研究「點樣教人工智能學習」嘅機械學習領域上都相當有用[3]。
基本概率論

内文:概率論
機會率,粵文入面又有叫概率或者或然率:大致上可以理解做「一件事件有幾可能會成真」,1 代表件事件實會發生,0 代表件事件絕對唔會發生;喺實際應用上,啲人一般會用以下噉嘅數學符號表示唔同事件嘅機會率[4]:
... 呀噉。機會率係統計學同機械學習等領域上實要諗到嘅一個課題:呢啲領域都涉及研究者由一個總體[e 5]入面攞一個樣本[e 6]出嚟,並且嘗試靠分析手上嘅樣本嚟增進自己對個總體嘅認識,但呢種做法本質上就有不確定性-難以保證個樣本實係代表到個總體;例如研究者想研究狼嘅體重,因為人力物力嘅限制,佢冇可能研究嗮古往今來所有嘅狼,所以佢就去搵 100 隻狼返嚟做研究,佢量度到呢個樣本嘅狼平均體重係 40 公斤,就最嚴格嘅邏輯基準嚟講,呢個數可能真係代表到全世界嘅狼,但又有可能全世界嘅狼嘅平均體重查實係 60 公斤,個研究者之所以搵到 40 公斤呢個數只係佢咁啱唔好彩抽到個代表唔到個總體嘅樣本-隨機係統計學(以至科學方法)分析上走唔甩嘅一部份[4]。
- 概率論:一套數學理論;專門研究機會率同相關概念,會以形式化(用各種數學符號)嘅方法將呢啲概念表達出嚟[4]。
- 概率公理:現代概率論當中嘅三條公理[e 7][5]:
- 實驗[e 8]:概率論上講嘅「實驗」同一般科學上講嘅實驗係兩個唔同嘅概念;喺概率論上,一場實驗係指一段程序,而段程序有以下嘅特性[4]:
- 隨機變數[e 13]:指一個數值會隨住某啲隨機嘅現象而改變嘅變數。
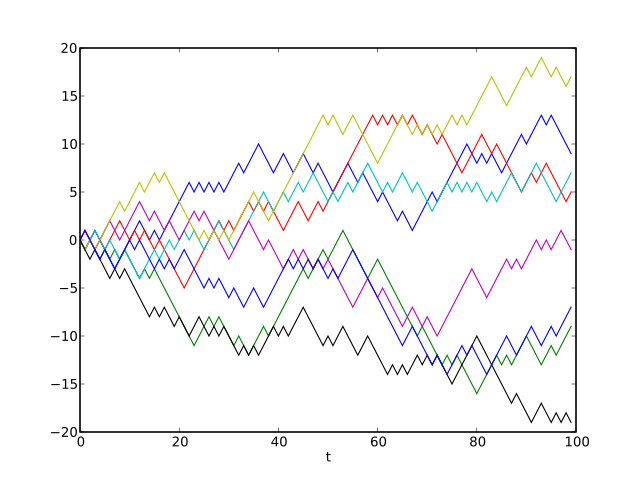
- 隨機過程[e 14]:簡單講就係有隨機喺入面嘅過程;嚴格啲噉講,隨機過程係指一嚿以若干個隨機變數嚟定義嘅數學物體[7]。可以睇吓馬可夫鏈。
- 期望值([e 17] ):指數據嘅每一個可能值各自噉同個可能值出現嘅機率乘埋,再將柞數加埋得出嘅總和,單位會同數據嘅相同[10];舉個具體例子,想像家陣個數據有 個可能數值,而 係指個數據嘅第 個可能數值,噉 條式係:
- ;有關呢啲數學符號嘅意思,可以睇吓加總。
- 例如想像家陣掟銀仔,假設銀仔冇出千(出公同出字嘅機率一樣),出公會得到 10 分,出字 0 分,噉掟一次銀仔嘅分數嘅期望值會係

- 隨機變數匯合[e 19]:指隨機變數可以有嘅極限[e 20];如果話某一個隨機變數 有一個極限,即係指(例如)隨住某個數值 變得愈嚟愈大, 嘅數值會慢慢愈嚟愈近(匯合)某個數值(設呢個數值做 , 係個函數嘅極限)[12]-
- 例子可以睇吓大數定律講嘅嘢。
- 溫氏圖[e 21]:一種成日俾人攞嚟表達概率嘅圖表;圖入面會有若干個波波,每個波波代表一件事件,而兩個波波之間嘅相交空間代表嗰兩個波波代表嗰兩件事件嘅交集 [13]。
隨機事件
内文:事件 (概率論)
概率論上所講嘅事件[e 22]係指一個由若干個可能結果組成嘅集,掕住「呢件事件發生嘅機率」。
- 基本事件[e 23]:淨係包含其中一個可能結果嘅事件。
- 對立事件[e 24]:「 嘅對立事件」( 或者 )係指「 冇發生」呢件事件。
- 。
- 互補事件[e 25]:如果話「 同 係互補事件」,即係話呢兩件事件當中必然有最少一件會發生-
- 。
- 互斥事件[e 26]:如果話「 同 係互斥事件」,即係話兩件事冇可能同時發生-
- ,
- [14]。
- 非互斥事件[e 27]:如果 同 係非互斥事件,即係話兩件事有可能同時發生-
- ,
- [14]。
- 條件機會率[e 28]:指如果一件事件發生咗,另一件事件會發生嘅機會率;「 發生咗, 嘅條件機會率」係
- ;
- 呢個數值可以用以下呢條式計[15]:
- 。
- 如果 同 係互斥事件,
- 。
- 獨立[e 29]:如果話「 同 呢兩件事件互相獨立」嘅話,意思即係兩件事唔會影響對方發生嘅機會率,
- ,所以
- 。
- 呢條式表示,就算 發生咗, 發生嘅機會率依然係 ,反之亦然[16]。
- 條件獨立[e 30]:指一件事件唔會影響第件事件嘅條件概率,即係話如果[17]
- ,
- 噉 同 就算係「喺 之下條件獨立」[e 31],。
- 概率連鎖法則[e 32]:有兩件隨機事件 同 :
- ;
- 而如果要考慮嘅事件()有多過兩件:。
- 貝葉斯定理[e 33]:指以下嘅定理:
- 。
概率分佈
内文:概率分佈
睇埋:概率分佈一覽
概率分佈[e 34]係指一個表明某個變數每個可能數值出現嘅機會率嘅函數,
當中 就係個概率分佈;呢個函數可以畫做一個表,X 軸代表個目標變數嘅數值,Y 軸代表嗰個目標變數嘅每個數值出現嘅機率;是但搵個變數 , 喺總體當中有一個概率分佈,表示 每個可能數值 出現嘅機率,呢個分佈喺實際上係不可知嘅,研究者淨係有得攞樣本,量度樣本當中嘅概率分佈(喺個樣本入面, 嘅每個可能數值出現嘅機率大約係幾多),靠噉嚟估計個總體嘅分佈[18]。
喺廿一世紀統計學上,比較常用嘅概率分佈相關概念有以下呢啲:


- 累計函數[e 42]:描述一個概率分佈之下 嘅累計值會點隨 變化嘅函數 ; 表示「由個樣本嗰度隨機抽一個個體,個個體嘅 (叫呢個值做 )細過或者等如 」嘅機會率,
- 無論連續定離散嘅概率分佈都可以有相應嘅累計函數[21]。
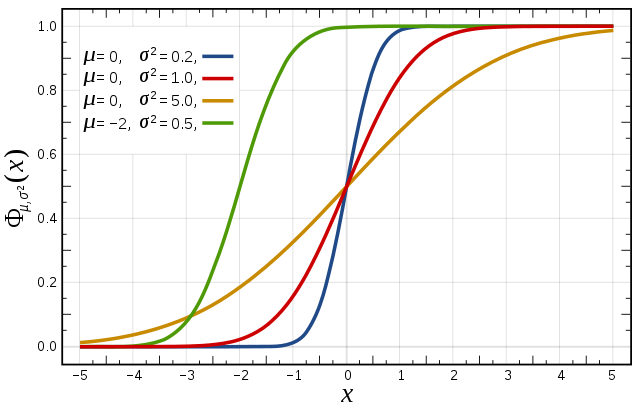
- 對稱度[e 43]:一個概率分佈可以有嘅一個屬性,攞個概率分佈當中嘅一個 值,個分佈喺 左邊嗰部份同個分佈喺 右邊嗰部份形狀上愈相似,個概率分佈以 為中心嘅對稱度就愈高;喺實際應用上,量度一個概率分佈嘅對稱度嗰陣會用嘅 值通常會係個分佈嘅平均值[22]。
- 動差[e 45]:泛指描述一個函數(例如概率分佈)嘅形狀嘅指標數值[23]。

- 抽樣分佈[e 48]:攞一個基於隨機抽樣嘅統計量,個統計量嘅概率分佈就係佢個抽樣分佈[25]。
- 聯合概率分佈[e 50]:一個聯合概率分佈同時描述緊多過一個變數嘅分佈;一個兩變數聯合概率分佈會有打橫嘅 X 軸 Y 軸以及打戙嘅 Z 軸,總共三條軸,X 軸 Y 軸分別描述嗰兩個變數 同 嘅數值,而 X 軸同 Y 軸成嘅平面當中每一點嘅高度(Z 值)反映咗「 係呢個數值而且同時 係呢個數值」嘅機會率。當變數有多過兩個嗰陣同一道理[26]。

- 獨立同分佈[e 51]:係概率論同統計學上嘅一個概念;如果話一柞隨機變數(或者事件)係「獨立同分佈」嘅話,意思係佢哋嘅概率分佈完全一樣(每次抽嗰陣個結果嘅概率分佈一樣),而且彼此之間獨立(抽一次嘅結果唔會受打前抽到嘅數值影響)[27]。
- 中央極限定理[e 52]:概率論同統計學上最重要嘅定理之一;根據 CLT,想像有個變數 ,只要三條條件成立:
Remove ads
收集數據

内文:收集數據
睇埋:數據集
收集數據[e 53]係做統計分析前必要嘅一個工序:用科學方法做研究係要由對現實嘅觀察當中歸納出一啲能夠描述現實嘅普遍法則;而要對現實作出有系統化嘅觀察,就一定要攞數據-即係用某啲符號(喺統計學上通常係數目字)記低現實世界嘅狀態[28]。
- 總體[e 54]:指所有屬研究對象嘅個體;一份研究會嘗試搵出有關某啲研究對象嘅知識,會作出一啲描述呢啲對象嘅假說[29];
- 樣本[e 55]:由總體抽出嚟、俾研究者攞嚟做量度嘅 個個體(因為人力物力嘅限制,一份研究冇可能睇得嗮古往今來嘅所有研究對象)[29];
- 抽樣[e 57]:由總體抽出樣本嘅過程[31]。
- 代表性[e 58]:指個樣本有幾代表到想研究嗰個總體,數學啲講係指個樣本喺研究緊嘅變數上嘅概率分佈有幾接近總體;例如家陣想研究嘅總體係「人類」,但個研究者貪方便淨係由大學生嗰度抽樣,搞到成個樣本得 19 至 26 歲嘅人類,代表唔到呢個年齡層以外嘅人類-樣本代表性不足[29]。
- 隨機抽樣[e 59]:由總體嗰度隨機噉抽 個個體做樣本[31]。
- 系統抽樣[e 60]:將總體入面嘅個案,按每個個案佢喺某個變數 上嘅數值排序(由細到大定由大到細都得),然後再每 個個體就將嗰個個體抽出嚟做樣本一部份;系統抽樣能夠有效噉避免「抽出嚟個樣本喺變數 上唔夠代表性」呢個問題[32]。
- 返去平均[e 61]:想像家陣量度某個隨機變數若干次,如果其中一次度到個極端(極高或者極低)嘅數值,[註 3]噉下一次量度嗰陣大機率會度到個比較近平均嘅數值。有唔少統計學工作者指,返去平均嘅現象喺唔少人對「點解手上個數值出咗變化」作出錯誤嘅判斷(睇埋歸返謬論)[33]。
- 統計量[e 62]:指由數據嗰度做計算得出、用嚟做進一步分析嘅數值,例子有平均值。
- 缺失數據[e 65]:指因為數據搜集嘅過程當中,因為受訪者對問題嘅遺漏、拒絕回答、又或者係啲調查員犯嘅疏忽等原因,而造成數據當中有啲位冇相應嘅數值。基本上做親統計分析個數據集都梗會有啲缺失數據,而係做統計分析嘅過程當中,一件缺失咗嘅數據通常會用「99」或者類似嘅冇可能數值代表[35]。
- 研究設計:
- 自變數[e 69]同應變數[e 70]:兩個相關嘅概念;IV 指自己變緊(自變)嘅變數,而 DV 指隨住 IV 變而變嗰一個變數,IV 可以大致想像成「影響或者預測 DV 數值嗰個變數」。
- 控制變數[e 71]:如果話一個變數係一個控制變數,噉意思即係話研究者想睇個應變數獨立於呢個控制變數嘅效果。
- 操作化[e 72]:指「定義要點樣量度一啲唔能夠直接量度得到嘅變數」嘅過程;例如係心理學研究成日都要應付一啲人腦入面嘅變數,呢啲變數好多時都難以直接量度,而個研究者要做嘅嘢包括定義好個變數,講明用某個直接量度得到嘅變數 代表想量度嗰一個變數(),以及佢點解認為 代表到 ,上述嘅過程就係所謂嘅操作化[37]。
- 時間序列[e 73]:係指一列若干個數據數值,而呢列數值當中每一個都掕住一個數值,表示嗰一個數據數值「喺時間上係第幾個發生嘅數值」。

- 倖存偏見[e 74]:指啲人搜集數據嗰陣,傾向淨係得到通過咗某啲甄選程序嘅個體,過唔到甄選程序嘅個體進入唔到數據集,因而引起數據偏向。例如喺二戰嗰時,有美軍嘅分析師試過研究戰機嘅裝甲,佢哋分析返空軍基地嘅戰機喺乜嘢部位俾敵人子彈打過(搜集數據),諗住俾敵人子彈打得多嘅部位就要加厚裝甲;結果發現,返到基地嘅戰機當中冇一架係駕駛艙俾敵人子彈打過嘅;噉唔係表示駕駛艙唔使加厚裝甲,而係因為駕駛艙俾敵人打中嘅戰機根本唔會返到基地-駕駛艙俾敵人打中嘅戰機過唔到「生還」呢個甄選程序,令最後得到嘅數據望落好似反映「冇戰機嘅駕駛艙畀敵人打中過」噉[38]。
觀察研究

内文:觀察研究
觀察研究[e 75]係指由樣本嗰度攞啲描述自變數同應變數嘅數據,並且作出推論,而途中唔會特登嘗試作出任何嘅操作嚟影響啲變數嘅數值。呢類研究喺社會科學上成日用,因為社會科學研究嘅係人-好少可有得好似自然科學噉,能夠吓吓都攞自己啲研究對象入去實驗室裏面任意噉搞[39]。
- 橫切面研究[e 76]:指研究者對個樣本喺 1 個時間點進行咗觀察。
- 縱向研究[e 77]:指研究者對個樣本喺多過 1 個時間點進行咗觀察,而且會分析其中一啲變數隨時間嘅變化。
- 隊列研究[e 78]:縱向研究嘅一種,指按某啲特性(性別同年紀等)搵一柞受試者返嚟觀察,然後喺打後一段時間(好多時斷年計)係噉觀察佢哋嘅變化;呢種做法喺醫學上成日俾人用嚟研究(例如)一隻病對患者有乜嘢長遠影響[40]。
- 社會統計調查[e 79]:社科上常用嘅一種收集數據方法,通過搵一柞社會大眾返嚟做受試者,對佢哋作出系統化嘅提問,並且分析有關研究嘅數據,用嚟描述或者解釋社會現象[41]。
- 自我報告研究[e 81]:指靠人類受試者向研究者報告自己嘅行為嚟做嘅研究,通常係心理學同社科領域先會做嘅。例如一個社會學研究者想研究一個人每個禮拜花幾多時間上網會點影響佢嘅社交生活,佢要量度每個受試者「每個禮拜花幾多時間上網」,就靠問受試者估計自己平均每個禮拜花幾多時間上網。自我報告研究嘅效度受到唔少學者爭議[43]。
- 民意調查[e 82]:指由專業人士搞,通過網絡、電話或者書面等嘅媒介嚟對一般大眾做調查,想知一般大眾對某啲政治、經濟同社會議題嘅意見同態度[44]。
- 檔案研究[e 83]:指用檔案數據嚟做嘅研究;例如經濟學同第啲商學領域上嘅研究噉,就好興攞政府數據庫嗰度嘅數據嚟估計經濟指標數值,並且以呢啲經濟指標嚟做研究嘅自變數或者應變數[45][46]。
實驗
内文:實驗
實驗[e 84]泛指一啲做嚟目的係要驗證某啲假說嘅步驟。喺研究者做實驗嗰陣,佢要喺一個有返咁上下受控([e 85] 指個研究者能夠量度同控制啲變數)嘅環境下做一啲操作[e 86]。一個操作涉及個研究者特登控制某啲變數(自變數)嘅數值,再睇吓個操作會引致應變數有乜嘢變化,用意在於研究自變數同應變數嘅變化之間係咪有因果嘅關係[47]-如果一份觀察性質嘅研究,發現 同 呢兩個變數之間有正相關,呢個發現有最少三個可能嘅解釋:
- 令 上升,
- 令 上升,或者
- 同 會受同一個因素 影響而上升,
但如果做咗場實驗,操控 嘅數值(實驗操作[e 87])然後發現噉做令 數值上升,就更加確立「 令 上升」呢個可能性[註 4][48][49]。
- 實驗設計[e 88]:指設計一場實驗嘅過程;喺做實驗之前,研究者一般會寫計劃書向自己所屬嘅院校提議場實驗,會喺計劃書入面詳述場實驗嘅設計[50]。
- 實驗組同對照組:
- 隨機化實驗[e 91]:指隨機噉將受試者分做實驗組同對照組;假想家陣有個研究者想做實驗,佢搵咗柞受試者返嚟,跟手就要有方法決定邊個入實驗組邊個入對照組,而一般認為,最理想係完全隨機噉分。有關應用上要點樣做到呢樣嘢,可以睇吓隨機數產生(RNG)等嘅技術[52]。
- 析因實驗[e 92]:指有多過一個自變數受操控嘅實驗;例如家陣有個研究者想知 同 呢兩個實驗操作分別會造成乜嘢效果同埋彼此之間有冇調節效應(睇下面),於是就將受試者分做 4 組- 同 都冇、有 冇 、冇 有 、同 同 都有,成一個 2 x 2 嘅析因實驗[53]。
- 自然實驗[e 93]:指場實驗嘅操作係由研究者以外嘅力量所施加嘅,例如係一場經濟實驗,研究自然災難造成嘅經濟影響-場災難唔係由研究者施加嘅,但研究者可以透過比較受咗場災難嘅經濟體同冇受嗰場災難嘅經濟體(假設兩個經濟體除咗災難之外大致上相同)對比,嚟推斷場災難造成咗乜嘢影響。呢種實驗喺社會科學嗰度零舍常見[54]。
- 准實驗[e 94]:指冇完全隨機噉將受試者分做實驗組同對照組嘅實驗[54]。
- 臨床研究[e 95]:指喺醫學同相關領域上試吓新嘅藥或者治療法嘅效用;呢種研究通常都會採取比較實驗組(食咗隻新藥或者用咗新嘅治療法)同對照組(食咗安慰劑)嘅實驗方法嚟做[55]。
量度
内文:量度
睇埋:刪失
- 量度層次[e 98]:喺統計學入面對變數量度方法嘅一種分類法。喺做科學研究嗰陣時,科學家想做嘅嘢係要搵出變數同變數之間嘅關係,而要做呢樣嘢,佢哋好多時係首先要量度啲變數嘅數值,並且跟手做統計分析睇吓啲變數之間有乜嘢關係。量度層次嘅分類法係基於嗰個量度方法提供到幾多資訊嚟到劃分嘅,呢個分類法將量度方法分做四個級別[56][57]:
- 連續變數[e 103]同離散變數[e 104]:一個連續變數嘅可能數值有無限咁多個,而離散變數得若干個可能數值;例:真相得兩個可能數值(真同假),但溫度嘅可能數值嘅數量原則上有無限咁多個,攝氏 100 度、攝氏 100.01 度、攝氏 100.0001 度... 等等[58]。
- 離散化[e 105]:指「將一個連續嘅變數或者函數變做離散」嘅過程;喺實際應用上,噉做嘅一個可能目的係因為手上嘅數據唔夠多,但要搜集大量數據又因為人力物力嘅限制而行唔通,所以分析之前將一個連續嘅變數變做離散(睇下面中位數分割),令分析變簡單啲[59]。
- 中位數分割[e 106]:將一個連續變數變做一個離散變數嘅一種方法;攞一個連續變數 ,搵出 嘅中位數 , 數值 嘅個案冚唪唥設做「組 1」,而 數值 嘅個案冚唪唥設做「組 2」-得出「屬組 1 定組 2」呢個離散變數,可以將一個原本係連續嘅變數做一啲離散變數先可以做嘅推論統計分析(例如係 ANOVA)。到咗 2020 年,中位數分割呢種做法廣受評擊,好多人都唔會接受呢種做法[59]。
- 共同方法變異[e 107]:指因為量度方法(而唔係想量度嗰個變數)而起嘅變異數-想量度嘅變數會有一個(研究者想靠量度估計嘅)概率分佈,但實際量度到嘅數值嘅分佈可能同呢個真實分佈唔同,而呢個差異係因為量度架生嘅特性而起嘅;要檢驗一柞數據有冇共同方法變異嘅問題,最原始嘅做法係用哈曼測試[e 108]-即係用探索型因素分析(EFA;睇下面)嘗試由柞數據嗰度抽取一個因素出嚟,而如果呢個想像中嘅因素能夠解釋幾多嘅變異數[註 5][60]。
- 時間解像度[e 109]:指一個量度方法能夠睇到幾細時間差之間嘅變化。例如有兩個量度方法 A 同 B,A 能夠話到俾觀察者知一個變數喺 1 毫秒之間嘅變化,而 B 淨係講到俾觀察者知個變數喺 10 秒之間嘅變化,噉 A 嘅時間解像度比較高。
- 空間解像度[e 110]:指一個量度方法能夠睇到幾細空間差之間嘅變化。例如有兩個量度方法 A 同 B,A 能夠話到俾觀察者知一個變數喺 1 厘米之間嘅變化,而 B 淨係講到俾觀察者知個變數喺 1 米之間嘅變化,噉 A 嘅空間解像度比較高。
- 天花板效應[e 111]同地板效應[e 112]:指想量度嗰啲數值高得滯(天花板效應)或者低得滯(地板效應),搞到件量度架生唔再俾到有用嘅資訊[61]。
- 舉個簡化嘅例子,想像家陣攞支日常嘅溫度計去量度太陽(塊表面超過 5,000 °C 咁熱)同天狼星(塊表面估計超過 9,000 °C 咁熱)嘅表面溫度,攞支日常溫度計去度太陽表面嘅話,條溫度計應該會變成氣體(假如條溫度計係用一般玻璃造-普通嘅玻璃沸點好多時得嗰 2,200 °C 左右),而攞支日常溫度計去度天狼星表面,條溫度計都係變氣體-噉即係話,雖然天狼星明顯熱過太陽,但條溫度計對太陽定對天狼星都係俾一樣嘅反應(變氣體)-做唔到分辨兩者(俾唔到有用嘅資訊)。
- 呢種情況喺社科入面都見得到:想像家陣有 A 君同 B 君兩個人,兩個都喺智商測驗度攞滿分;但噉唔表示兩個一樣咁聰明-可能 A 君明顯聰明啲,但佢同 B 君嘅智能都係遠超份智商測驗度到嘅值;於是份智商測驗就唔再俾到有用嘅資訊-發生咗天花板效應[62]。
- 地板效應係天花板效應嘅相對,指想量度嗰啲嘢嘅值低得滯,搞到件量度架生俾唔到有用資訊(想像條溫度計最低淨係度到 -20 °C 嘅氣溫,條計就應該唔會有能力分辨一嚿 -100 °C 嘅物體同一嚿 -120 °C 嘅物體)。
信度同效度
信度[e 113]係常用嚟評估一個量度方法有幾好嘅指標,指對一個現象用嗰個方法進行重複觀察之後,係咪可以得到相同嘅數值;正路嚟講,如果一個量度方法係可信嘅,噉無論何時何地何人用嗰個方法量度同一樣嘢,都理應會得到相同嘅數值[63][64]。
- 評分者間信度[e 114]:用嚟評估一個量度有幾受做量度嘅人影響;例如有一個俾教育家用嚟評估細路學習進度嘅方法,但做完研究發現,五位教育家分別噉用同一個方法評估同一班細路,五個得到完全唔同嘅數值,噉呢個量度方法嘅評分者間信度就低。
- 評分者內信度[e 116]:用嚟評估一個量度有幾受做量度嘅人影響;例如有一個俾教育家用嚟評估細路學習進度嘅方法,但做完研究發現,由同一位研究員用同一個方法度同一個細路,假設段研究時間短(個細路嘅行為理應唔會有明顯變化),次次出嘅結果都唔同,噉呢個量度方法嘅評分者內信度就低。
- 重測試信度[e 117]:用嚟評估一個量度方法有幾受時間影響;例如有一個俾心理學家用嚟量度智商嘅測驗,做研究,搵班受試者返嚟做個測驗,得到一柞分數 ,然後過咗一個月之後,搵返班受試者返嚟又做過,得到另一柞分數 ;一般認為智商冇乜可能會喺一個月之內改變嘅,如果 同 差異好大,就表示呢個測驗嘅重測試信度低。
- 內部一致度[e 118]:指一個有多條題目嘅量度方法有幾「係量度緊同一樣嘢」;例如有一個智商測驗,有 50 條題目,理論上,呢啲題目冚唪唥都係量度緊智商,所以彼此之間理應喺得分上有返咁上下正相關,但研究發現,嗰 50 條題目當中有 5 條零舍係同其餘嗰啲題目有負相關,噉心理學家就好可能會要求攞走嗰 5 條題目(佢哋似乎唔係量度緊智商,所以唔應該擺喺一個智商測驗入面),變成一個 45 條題目嘅測驗。
效度[e 119]係另一個常用嚟評估一個量度方法有幾好嘅指標,指個方法有幾量度到佢理應要量度嗰樣嘢;一個有效嘅量度方法真係量度緊研究者想佢量度嗰個變數;例如如果一個方法信度高、但效度低,就表示個量度方法能夠準確噉量度某個變數,但佢所量度嗰個變數並唔係研究者想佢量度嗰個[63][64]。
- 建構效度[e 120]:指一個概念嘅量度有幾合乎理論上嘅定義;例如理論上,智商測驗係量度智能嘅,而智能理論一般認為,智能包含一個個體解難嘅能力,所以一個智商測驗理應會考驗受試者嘅解難能力;建構效度嘅評估一般都係比較理論化嘅[66]。
- 效標效度[e 121]:通常用嚟評估心理測驗嘅效度嘅一個指標,指個測驗嘅分數同俾人認為代表要量度嗰個變數有幾強相關;例如一個設計嚟量度一個人有幾外向嘅心理測驗,研究者搵咗班受試者返實驗室做個測驗,知道每位受試者嘅分數,然後喺實驗室入面觀察每位受試者有幾常主動同人講嘢或者互動(呢啲行為反映外向程度),再做一個相關嘅分析,睇吓測驗分數係咪真係同受試者做外向行為嘅次數有正相關。
- 分歧效度[e 122]:指一個量度方法有幾「唔量度到理應唔啦更嘅變數」;例如一個智商測驗理應係量度緊智商,而唔係身高,如果一個一個智商測驗入面其中一條題目同個人嘅身高有正相關而且同身高嘅相關強過同其餘題目嘅相關,噉就似乎表示呢條題目量度身高多過量度智商,分歧效度低。
- 內容效度[e 123]:指一個量度方法有幾能夠涵蓋嗮佢要量度嗰樣嘢嘅各個方面;例如智能一般包括邏輯同語言等多種嘅認知能力,所以一個理想嘅智商測驗理應要量度嗮以上嘅各種認知能力。
- 聚合效度[e 124]:指一個量度方法有冇同一啲理論上同佢有相關嘅嘢有預期中嘅相關;例如智能理論上會同時影響一個人嘅邏輯能力同語言能力,所以邏輯能力同語言能力理論上應該會有返咁上下正相關[67]。
- 表面效度[e 125]:指一個量度方法就噉望落有幾合乎佢理應要量度嘅嘢,通常話「一個量度方法有表面效度」喺正式科研上唔會俾人接受[68]。
Remove ads
描述統計學
内文:描述統計學
描述統計學[e 126]係指一啲量化噉描述一柞資訊嘅統計數值,包括咗[69]:
集中趨勢
内文:集中趨勢
集中趨勢[e 127]係指表示一個概率分佈「最中間嗰個數喺邊」嘅統計數值[69]。
- 平均數[e 128]:平均數()最常係指算術平均值[e 129],即係將啲個案嘅數值()冚唪唥加埋一齊,再除以個案數量():
- 中位數[e 132]:將啲個案嘅數值()由細到大或者由大到細排好序,再攞最中間嗰個數,嗰個數就中位數;如果個案數量係雙數,令到有兩個數喺中間,就攞嗰兩個數嘅平均。

離散程度

内文:離散程度
離散程度[e 134]係指描述一個概率分佈「有幾散」嘅統計數值[70]。
- 變異數([e 135] ):以下嘅數值:
- ,
- 當中 係個案數量, 係第 個個案喺個變數上嘅值,而 係個樣本嘅平均值- 反映咗啲個案平均距離平均值幾遠。
- 標準差([e 136] ):變異數嘅開方。
- 百分位數[e 137]:家吓將樣本入面嗰 個數值由細至大排好,噉第 個案嘅百分位數()就係指有幾多百分比嘅個案喺個變數數值上細過或者等如嗰個個案,即係
- 全距(range):指樣本入面最大嘅 數值減最細嘅 數值。
- 變異系數([e 139] ):指用平均值除標準差得出嘅數。
- 離散指數[e 140]:一個概率分佈嘅離散指數 係指以下嘅數值:
- ;
- 離散指數可以用嚟作為離散程度嘅一種標準化指標[71]。
- 協方差矩陣[e 141]:一種數據表達方法,用一個矩陣表達每對變數之間嘅協方差,例如下面嗰個矩陣就顯示 同 之間嘅協方差係 ,而對角線當中嘅係每個變數嘅變異數,例如下面嗰個矩陣就顯示 嘅變異數係 。
統計圖

内文:統計圖
拉雜描述統計
- 標準分數[e 147]:攞個個案喺一個變數上嘅數值 ,個個案喺嗰個變數上嘅標準分數()係
- 當中 係拃個案喺個變數上嘅平均值,而 係佢哋個標準差[73]。
- 結合數據[e 148]:指由將幾個個體嘅數據以某啲方式結合成嘅數據;例:有個經濟學家想研究一間公司嘅營業額同員工嘅工作表現有乜關係,佢一個可能嘅做法係,每間公司都搵若干個員工(個體),量度每個員工嘅工作表現(個體嘅數據;假設員工表現有方法量化),然後每間公司計個平均員工工作表現(以平均值嘅方式結合),再用統計分析睇吓每間公司嘅呢個數值同營業額之間有乜關係[74]。
- 抽樣誤差[e 149]:指因為抽樣造成嘅誤差-例如由一個有 10,00 個個體嘅總體嗰度是但抽 100 個個體出嚟,用呢 100 個個體嘅平均身高()估計個總體嘅平均身高(),因為抽樣過程嘅隨機性, 同 之間梗會有些少差異[75]。
- 誤差傳播[e 150],又有叫不確定嘅傳播[e 151]:指一柞變數嘅不確定性(隨機嘅誤差)影響到基於柞變數嘅函數嘅不確定性;想像一架太空船嘅燃料缸,太空船要監察住自己仲淨低幾多燃料,而廿世紀嘅太空船做法係知道燃料缸滿嗰陣容量係幾多,然後喺每次架船噴燃料嗰時估計問出咗幾多燃料,靠噉嚟計淨低幾多燃料,但噉做有問題-每一次嘅估計都會有個最大可能誤差 ,喺噴咗 次燃料之後,得到嘅估計結果嘅誤差最大可以係成 咁多,即係話誤差會隨住做估計嘅次數「傳播」變到愈嚟愈大[76]。
- 數數據[e 152]:指數某件事發生咗幾多次嘅一種數據,數值只可以係正整數。
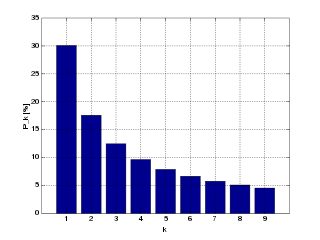
- 班佛定律[e 153],又有叫第一個位定律[e 154]:指一個喺現實世界數據當中觀察到嘅現象;如果話一柞有單一變數 嘅數據跟從班佛定律(假設啲數值以十進制寫),意思係話喺嗰柞數據入面,會有大約 30% 嘅個案喺 上嘅數值會係以 1 開頭,而數值嘅開頭數字愈大嘅個案數量就會愈細,得大約 5& 嘅個案喺 上嘅數值會係以 9 開頭(下圖)。實證嘅研究表明,呢種現象喺地址、股票價格同人口數字等多種嘅自然(唔係由人用電腦隨機產生)統計數字當中都可以見得到[77]。
Remove ads
推論統計學
内文:推論統計學
推論統計學[e 155]技術化噉講係指做數據分析,推論數據背後反映嘅概率分佈嘅過程。呢啲分析通常係由數據嘅個案嘅值嗰度計一啲指標出嚟,用呢啲指標評估(例如)某兩個變數之間係咪真係有關,或者個自變數係咪真係能夠對個應變數產生影響,甚至估計一個數學模型出嚟描述所研究嘅現象。廿一世紀嘅統計學上有好多種推論統計分析法,每種能夠處理嘅數據類型都唔同。數據科學等領域嘅專家一定要對呢啲唔同嘅分析法有所認識,知乜嘢時候應該用邊種分析法[78]。
假說檢定
内文:假說檢定
睇埋:訊號探測理論
假說檢定[e 156]係指喺推論統計學當中驗證一個假說係咪真嘅過程。一個做假說檢定嘅研究者所做嘅工序如下:
- 睇過有關佢所研究嗰樣嘢嘅文獻,
- 建基於已有嘅知識,作出一啲有關嗰樣嘢嘅新假說-「我睇過打前嘅研究,我認為有咗已知嘅嘢,我可以作出以下嘅判斷,而『驗證呢個判斷係咪正確』能夠帶嚟新知識」,
- 諗出一個驗證呢假說嘅程序,
- 用呢個程序攞數據,
- 對數據作出分析,
- 用分析結果判斷個假說係咪真確[79]。
- 假說[e 157]:喺科學上係指一個仲未搵到證據支撐,但研究者有理由認為係真確嘅論述。
- 虛無假說([e 158] 符號:)同備擇假說([e 159] 符號:):虛無假說係做一份研究嗰陣嘅預設立場,指「兩個量度嘅變數之間冇關係」呢句嘢,,而備擇假說係做一份研究嗰陣嘗試驗證嘅立場,指「兩個量度嘅變數之間有關係」呢句嘢,。
- 單側同雙側檢定[e 160]:單側檢定指個備擇假說講明咗 處於 邊一面,即係 或者 ,而雙側檢定指個備擇假說冇講明 處於 邊一面,即係單純嘅 [81]。
- 喺做假說檢定嗰陣,一般會將可能會出現嘅錯誤分兩種[82]:
- 統計顯著性[e 163]:係做假說檢定嗰陣得到嘅一個數值;統計顯著性嘅數學符號係 ,表示「如果虛無假說係真,呢個結果出現嘅機會率」,
- 統計功效[e 165]:一個假說檢定過程會有嘅一個屬性;指「如果 係真確,個測試過程會成功拒絕到 」嘅機會率[83]。
- 成功拒絕 係真
- 點定區間估計:
- 點估計[e 166]:指用樣本嘅數據嚟計出一個數值,作為一個「估計嘅數值」;例如做統計嘅人家陣嘗試靠住樣本嘅變數 數據嚟估計出總體個 嘅平均值最大機會會係幾多,如果畫做圖嘅畫,個估計值會係條軸上面嘅一點[84]。
- 預測區間[e 167]:指按統計模型作出嘅一個有關「跟住落嚟呢個觀察值嘅數值會喺幾多同幾多之間」嘅預測,會掕個機率數值表示嗰個預測有幾大機會成真[84]。
- 區間估計[e 168]:指用樣本嘅數據嚟計出一個數值間距,作為一個「估計個數值喺邊點同邊點之間」;例如做統計嘅人家陣嘗試靠住樣本嘅變數 數據嚟估計出總體個 嘅平均值喺幾多同幾多之間,如果畫做圖嘅畫,個估計值會係條軸上面嘅一個間距[84]。
- 因果[e 170]:兩個變數之間可能有嘅一種關係;如果話 係因而 係果,意思即係話 引致 -「因果」一詞嘅具體定義喺廿一世紀初嘅哲學同邏輯學上查實仲係一條好有爭議性嘅問題[85]。以廿一世紀初嘅基準嚟講,如果要檢定一啲帶有因果性質嘅假說(例如「食煙會引致患肺癌嘅機率提高」係一條醫學有可能會研究嘅因果假說),通常份研究要滿足以下呢啲條件[86][87]:
- 份研究涉及實驗操作:研究者要操控 (因),睇吓 (果)係咪會跟住改變;如果會,先至確立到因果關係。
- 份研究要顯示 嘅變化响時間上發生喺 嘅操作之後,先至會確立到因果關係。
- 一般認為,齋靠統計相關係確立唔到因果關係嘅(睇相關唔蘊含因果)。
- 格蘭傑因果關係[e 171]:靠兩個變數嘅時間序列嚟評估嗰兩個變數之間「有冇因果關係」嘅一種假說檢定方式;最簡單噉講,喺格蘭傑因果關係之下,攞一個因變數 嘅時間序列同一個果變數 嘅時間序列,並且揀一個時間間隔 ,如果喺每個時間點 嘅 數值傾向能夠預測 咁耐之後嘅 數值嘅話,噉 就可以算係 嘅「因」。呢種分析方法源自經濟學(經濟學成日都會應付一個個經濟指標數值嘅時間序列),而且喺現代嘅各社會科學當中相當常用,不過「到底呢個測試能唔能夠真係表明因果」係一條幾受爭議嘅課題[88]。

統計相關
内文:統計相關
相關[e 174]呢個詞喺統計學上嘅定義如下:如果話 同 呢兩個變數成正相關,即係話 數值高嗰陣 數值都傾向高,而 數值低嗰陣 數值都傾向低;如果話 同 呢兩個變數成負相關,即係話 數值高嗰陣 數值傾向低,而 數值低嗰陣 數值就會傾向高;而如果話 同 呢兩個變數冇明顯相關[e 175],即係話 嘅數值唔會點預測得到 嘅數值[91]。

- 相關唔蘊含因果[e 178]:統計學上嘅一條重要原則,指緊就算兩個變數之間有相關,都唔表示兩個變數之間有因果關係;假想而家有兩個變數 同 之間有勁嘅相關(皮亞遜積差相關係數數值大),噉可以表示三個可能性-
- 引致 ;
- 引致 ;
- 同 有同一個原因。
- 有唔少統計學嘅學生都以為兩個變數之間有相關表示咗兩者有因果關係,但呢個係一個錯誤嘅諗法,所以統計學界就有咗句噉嘅說話用嚟提醒學生要小心[94]。
- 局部相關[e 179]:指喺第個或者第啲變數嘅影響冇咗嘅情況下,兩個變數之間嘅相關;想像有兩個變數 同 ,有 個混淆變數(睇下面), 同 之間「喺 嘅影響受控制冇咗嗰陣」嘅局部相關 會係 同 之間嘅相關,當中 係指做線性迴歸分析用 預測 嗰陣嘅誤差, 同一道理[95]。
- 組內相關[e 180]:用嚟衡量每一組有幾「內部一致」嘅基準;想像有個數據,有若干個個案,而呢柞個案可以分做若干組,如果柞數據反映組內相關高,就表示同一組嘅個案嘅數值傾向彼此之間接近;要計組內相關可以有幾條唔同嘅式用[96][97]。
- 等級相關[e 181]:指要同佢哋計相關值嗰兩個變數係「等級」,即係每個個案喺嗰兩個變數上有「第一高」、「第二高」同「第三高」等嘅數值[98]。
- 自相關[e 186]:一個隨機過程嘅自相關係指嗰個過程喺唔同時間點嘅數值之間嘅皮亞遜積差相關係數;設 做一個有隨機嘅過程, 設做是但一個時間點,而家將 呢個過程行若干次, 代表個過程喺時間點 俾出嘅數值,噉呢個過程時間點 同時間點 之間嘅自相關 定義上係 同 之間嘅皮亞遜積差相關係數;自相關喺訊號處理上常用,可以用嚟量度一段訊號有幾接近完全隨機[101]。
- 交叉相關[e 187]:睇喺每個時間點兩段時間序列 同 之間嘅統計相關,即係話交叉相關會反映 (時間點 嘅 值)同 (時間點 嘅 值)之間嘅相關,又或者係揀個延遲值 ,睇吓交叉相關反映 同 之間嘅相關[102]。
- 正交[e 188]:喺統計學上,如果話兩個 IV「正交」,意思即係話呢兩個 IV 之間冇統計相關[103]。睇埋多重共線性。
比較平均值
内文:比較平均值
泛指「將手上嘅個案分做若干組,再比較唔同組之間喺個變數上嘅平均值」嘅推論統計學分析方法,多數都會假設每組喺個變數上呈常態分佈。
- 學生 t 測試[e 189],簡稱 t 測試:成日用嘅統計分析方法之一,用嚟分析兩個組(通常係實驗組同對照組)之間喺某個指定變數嘅數值上係咪有顯著嘅差異[104]。t 測試涉及以下嘅方程式,比較兩組喺個變數上嘅平均值:
- 當中 係成個樣本嘅大細, 同 就係兩個組分別喺個變數上嘅平均值, 係兩個組嘅標準差(t 測試假設咗兩個組嘅標準差相等),最後計到一個 值出嚟。如果 值好大,噉就表示咗「兩個組之間嘅差異」大過「組嘅內部差異」好多,噉亦都表示咗「個實驗嘅操作造成嘅差異」大過「隨機性嘅個體差異」- 值愈大愈係表示兩個組之間嘅差異係因為組嘅存在而造成嘅。計到個 值之後,仲有啲方法可以跟手計埋個顯著性嘅值出嚟。
- 獨立樣本 t 測試[e 190]:指做 t 測試比較嗰兩個組係獨立同分佈嘅,例如做個心理學實驗,用隨機抽樣方法隨機噉抽咗 個受試者返嚟,再用隨機方法將佢哋分落實驗組同對照組(即係每位受試者有 50% 機率入實驗組、50% 機率入對照組)[105]。
- 配對樣本 t 測試[e 191]:指做 t 測試嗰兩個組唔係獨立同分佈嘅,研究者做咗某啲嘢,令一組數值當中每一個都喺另外嗰組當中有個對應,例如做個心理學實驗,研究者想知個實驗操作會引致變數 有乜變化,於是就喺實驗前量度 一次,跟住對受試者做實驗操作,然後喺實驗後又量度 一次(睇返重複量數設計)。喺呢個情況下,每位受試者都有個

- 變異數分析[e 192]:一系列用嚟分析唔同組嘅平均值嘅方法;假想家陣個研究者想比較三組喺變數 嘅平均值上嘅差異,如果三組之間有顯著嘅差異,噉組之間嘅 嘅變異數應該會大過組內部嘅好多。最簡單嘅單因子變異數分析[e 193]分析一個應變數喺三個或者以上嘅組之間嘅差異(組就係自變數),考慮以下嘅數值[106]:
- 原則上, 數值愈大,研究者就愈有理由相信組之間有顯著嘅差異。
- 重複量數變異數分析[e 194]:即係唔同組係同一班受試者喺唔同時間點嘅數值嗰陣用嘅 ANOVA;想像一個用重複量數設計嘅實驗,喺 個時間點分別噉量度班受試者喺變數 上嘅值,如果 ,研究者可以用配對樣本 t 測試(睇上面),而如果 ,噉研究者就要用 rANOVA-比較 組()數值之間喺 上嘅平均值嘅差異,而呢 組唔係各有一班受試者,而係同一班受試者喺唔同時間點嘅 值[107]。
- 雙因子變異數分析[e 195]:指有兩個自變數嘅 ANOVA,可以用嚟睇嗰兩個自變數之間嘅調節效應(睇下面)[108]。
- 多變量變異數分析[e 196]:ANOVA 嘅一個變種,用嚟分析多過一個應變數;簡單講嘅話,MANOVA 做嘅嘢就係比較唔同組嘅平均值向量-喺一般嘅 ANOVA 當中,每組得一個數值(個應變數嘅平均值),而 MANOVA 要考慮多過一個應變數,所以做法就變成每組有一個向量 ,即係 個應變數(假設每個應變數都最少去到等距層次)[109]。
- 協方差分析[e 197]:係一種結合 ANOVA 同迴歸分析嘅一般線性模型;評估一個應變數嘅平均值係咪受一個離散嘅自變數(例如組)影響(一般 ANOVA 做得到嘅嘢)之餘,仲會控制住若干個連續變數(簡單講就係睇到個應變數獨立於呢啲控制變數嘅效果)。大致上噉講,ANCOVA 做嘅就係假設柞控制變數同應變數成線性關係,做迴歸分析用柞控制變數預測應變數,然後再用迴歸分析得到嘅誤差(柞控制變數預測唔到嘅變化)嚟做應變數行 ANOVA [110]。
- 等分散性[e 198]:比較平均值方法成日會作嘅假設;如果話一柞隨機變數(例如係「各組喺變數 上嘅數值」)具有等分散性,表示佢哋冚唪唥都具有相同嘅有限變異數。比較平均值方法通常會假設各組喺變數 上嘅數值嘅變異數一樣[111]。
- 異分散性[e 199]:等分散性嘅相反,指嗰柞隨機變數當中有最少一個喺變異數上同其他嗰啲唔同[111]。
- Z 測試[e 200]:都係比較樣本之間嘅平均值有咩差異,不過唔似得 t 測試噉條式會考慮埋樣本大細:
- 當中 值愈大就愈表示樣本之間嘅差異愈明顯。
- F 測試[e 201]:泛指要測試嗰個變數喺虛無假說下係跟 F-分佈[e 202]嘅。
拉雜推論概念
- 非參數統計學[e 203]:泛指「唔對背後嘅概率分佈(統計參數)作出任何假設」嘅統計分析方法;例如 t 測試同 ANOVA 都假設咗啲變數背後係跟常態分佈嘅,所以呢啲統計分析法就係有參數統計學;非參數統計學嘅例子包括麥倫瑪測試呀噉[112]。
- 卡方檢定([e 204] χ2):一種成日俾人用嚟分析離散變數之間嘅關係嘅做法;喺最簡單嘅情況下,卡方檢定要做嘅嘢係計以下嘅數值:
- ,當中
- 麥倫瑪測試[e 206]:一個 IV 一個 DV,兩個變數都淨係得兩個可能數值,麥倫瑪測試會計個 χ2 值出嚟反映「IV 係咪對 DV 有具體影響」;例:想像家陣研究一隻藥對病人「有冇骨痛」嘅影響,IV 係有冇食嗰隻藥,而 DV 係有冇骨痛,麥倫瑪測試會話到俾研究者聽,IV 係咪對 DV 有顯著嘅影響[114]。
- MWU 測試[e 207]:一種非參數統計分析方法,用嚟比較兩個獨立嘅組嘅平均值係咪相等,可以用嚟唔跟常態分佈嘅數據上(唔似得 t-測試噉指定啲組要跟常態分佈);想像家陣設兩組,佢哋嘅個案數量分別係 同 咁多,而又想像將每個個案喺個變數上嘅數值由細到大排咗次序(計好 rank),噉計以下嘅 同
- ,當中 係指組 1 嘅 rank 總值;
- ,當中 係指組 2 嘅 rank 總值;
- 同 之間嘅差距會反映兩組之間係咪有啲系統性嘅差異(例如係咪「組 1 啲值硬係傾向低啲」噉)[115]。
- 效應值[e 208]:指一個量度兩個變數之間嘅關係「有幾勁」嘅數值;要得到效應值有好多方法,簡單例子有變數之間嘅相關值同埋迴歸分析當中嘅迴歸系數[116]。
- 效率[e 209]:一個假說檢定步驟或者一套實驗設計可以有嘅一個特性;一套統計方法嘅「效率」係指套方法有幾能夠用最少量嘅個案嚟達到最高嘅表現(表現通常係以「做預測嘅能力」嚟衡量)[117]。
- 頻率學派推論[e 210]:一種舊時嘅統計學詮釋方法;根據呢種理解,推論統計嘅作用在於測試「一件事有冇發生」;一個頻率學派嘅研究者做嘅嘢係將個實驗重複若干次,再睇吓喺呢 次實驗當中,有幾多次得出撐個假說嘅結果。呢種做法俾人詬病,話用佢得到嘅結果會受實驗嘅重複次數影響[118]。
- 貝葉斯推論[e 211]:一種喺廿世紀取代咗頻率學派推斷嘅統計學詮釋方法;根據呢種理解,一個研究者喺做實驗之前會有一個原先預期[e 212]嘅模型,對每件事件都有個先驗概率[e 213],然後佢會做實驗攞數據,再按呢啲數據更改自己手上嘅模型,打後再做實驗,按攞到嘅知識更改自己心目中每件事件嘅後驗概率[e 214],跟住不斷更新個模型。即係用返貝葉斯定理[e 215]嘅思考方法想像[119]:
- ,當中
- 指(研究者相信)手上模型係真確嘅機會率;
- 指「如果手上模型係真確,會得出呢個實驗結果()」嘅機會率;
- 指「有咗個實驗結果,手上模型係真確」嘅機會率(事後信念[e 216])。
- 呢個過程可以想像成「心目中嘅概率分佈嘅不斷變化」-想像一個觀察者,佢完全唔知「撳 A 呢個掣會發生乜事」(喺佢心目中,所有可能性嘅機會率都一樣,成一個均勻分佈),喺撳咗一次,觀察到撳咗個掣會有盞燈閃之後,佢就會改變佢心目中嗰個概率分佈,知道「會有盞燈閃」嘅機會率大過「天會跌落嚟」嘅,即係對「撳 A 呢個掣會發生乜事」嘅認識多咗[119]。
- 估計理論[e 217]:統計學當中嘅一個子領域,研究喺建立統計模型嗰陣點樣估計模型嘅參數數值。可以睇返普通最小二乘法[e 218][120]。
- 特徵值[e 221]同特徵向量[e 222]:假想有一個非零向量 ,處於一個向量空間 當中, 作出一個線性嘅改變 (例如係同一個矩陣相乘),而 呢個改變等同將 乘以一個標量 ,即係話:
- ;
- 噉 就係一個同 呢個特徵向量相關嘅特徵值;喺應用上,特徵值可以用嚟反映一個逐步噉變化嘅系統[124]。

- 可解釋變異[e 223]:指一個數據庫入面嘅個案間差異(以離散程度計算)有幾多可以由手上嗰個統計模型解釋;可解釋變異可以用多個指標衡量[125]。
- 中介變數[e 224]:如果有三個變數,、 同 ,當中 能夠影響 ,而 跟住會影響 ,噉 就係 同 之間嘅中介變數;要用迴歸分析分析中介效應最簡單嘅有三個步驟[126][127]:
- 用迴歸分析睇吓 係咪能夠預測 ;即係睇吓 當中嘅 係咪顯著。
- 用迴歸分析睇吓 係咪能夠預測 ;即係睇吓 當中嘅 係咪顯著。
- 用迴歸分析睇吓 同 係咪能夠預測 ;即係睇吓 當中嘅 係咪顯著,以及 嘅絕對值係咪細過 。如果 數值係 0,但 係顯著,呢個模型就係一個完全中介[e 225]嘅模型,而如果 絕對值細過 但依然顯著,噉呢個模型就係一個局部中介[e 226]嘅模型。
- 一個諗中介嘅統計模型可以涉及多過一個層次嘅變數(可以睇返等級線性模型),即係話當中有啲變數係量度緊某啲個體(例:員工),而高層次嗰啲個體(例:公司)係由低層次嗰啲個體組成嘅。不過一般嚟講,高層嗰啲變數會係預測低層變數數值嘅自變數[128]。

- 調節變數[e 227]:指一個「調節」另外兩個變數之間嘅關係嘅變數(調節效應[e 228]),用迴歸分析諗嘅話:
- 混淆變數[e 230]:指一個同時會對自變數同應變數產生影響嘅變數,搞到研究者唔能夠肯定(如果搵到)自變數同應變數之間嘅關係係咪因為兩者真係有關,定係因為個混淆變數嘅影響;想像家陣研究者做一份研究,想知道 同 呢兩個變數之間嘅關係,佢做統計分析之後,發現 同 之間有顯著嘅正相關,不過評鑑佢份研究嘅學者就指出,有一個變數 , 係之前嘅研究發現咗係會對 同 有正影響嘅,而呢份研究冇量度到 ,所以個結果就未必係因為 同 之間真係有關; 喺呢個情況下就係一個混淆變數[131]。
- 壓制變數[e 231]:想像家陣做迴歸分析,用幾個自變數 嚟預測應變數 嘅值;假想而家 同 有一定嘅統計相關( 係預測變數),同時 同 冇顯著嘅相關( 係壓制變數),不過 就同 等嘅自變數有相關-喺現實,好似 噉嘅預測用變數多數都有「同應變數相關嘅部份」又有「同應變數冇相關嘅部份」,所以當研究者嘗試用呢啲變數建立迴歸模型嗰陣,呢啲變數唔淨只會解釋 嘅變異,同時又會解釋第啲自變數當中同應變數無關嘅變異;喺呢種情況下,壓制變數會解釋咗預測變數當中嗰啲同應變數無關嘅部份,形成「壓制預測變數入面嗰啲同應變數無關嘅部份」噉嘅效果[132]。
- 自由度([e 232] ):簡單講就係「手上有得完全隨機變化嘅資訊量」超越「為咗建立統計模型而必要嘅資訊量」(要估計嘅參數數量)幾多;例如家陣做抽樣,抽咗 個個案返嚟,然後由樣本度建立一個描述個樣嘅常態分佈;一個常態分佈可以靠兩個數值描述嗮-平均值()同標準差()-所以喺呢個情況下,自由度係 (用 咁多份互相獨立嘅資訊,估計 2 個參數)[133]。
- 敏感度分析[e 234]:有陣時喺得到統計模型之後會做嘅一樣嘢;用統計分析製作模型嘅過程當中往往假設咗好多嘢,但呢啲假設未必完全受人接納(例如好多時分析者都假設個變數係跟常態分佈);做敏感度分析意思就係睇吓如果嗰啲假設唔成立(變數唔係跟常態分佈),個模型仲成唔成立,如果就算冇咗嗰個假設都仲係搵到同一樣嘅結果嘅話,個分析者就更加有信心覺得個模型係掂嘅[134]。
- 廣義化[e 235]同狹義化[e 236]:
- 蒙地卡羅方法[e 237]:一柞用帶有隨機嘅做法嚟應付決定性系統嘅演算法:如果話一個系統係「決定性」嘅,意思,係指個系統冇隨機性質喺裏面,但就算一個系統係決定性質,個系統依然有可能會係複雜到難以用決定性質嘅方法解決,所以喺實際應用上,要搵出有關呢啲系統嘅問題嘅答案,可以靠一啲有隨機性質嘅演算法[136]。
- 因式分解[e 238]:指將一個數或者數學物體(向量或者張量等都得)以若干個因素嘅形式表達出嚟,而呢啲因素通常係比較簡單嘅數學物體;例:將「15」呢個數做因式分解可以得出「」,而將多項式「」做因式分解可以得出「」[137]。
- 頑健統計[e 239]:泛指一種統計技術(尤其係推論統計學方面嘅技術)無論啲數據嘅原初概率分佈係點嘅樣都好,種技術都會有良好嘅表現[138]。
- 分析層次[e 240]:指分析嘅對象規模有幾「大」;例如喺行為科學同社會科學上,「分析一個個體喺唔同時間點之間嘅差異」同「分析一柞個體之間嘅差異」就好唔同;想像一份認知心理學研究一班人揸車,比較個體之間嘅差異嗰陣發覺「一個人愈要俾心機揸車,就愈大機會撞車」,不過噉可能係因為新仔零舍要用多啲注意力先可以揸到車,而新仔因為技術冇咁好撞車嘅機會亦自然高啲;如果比較嘅係一個個體喺唔同時間點之間嘅差異,應該會發覺「一個人愈俾心機揸車,就愈細機會撞車」-唔同分析層次俾到嘅結果完全唔同[139]。
- 元分析[e 241]:一種「分析嗮已知嘅研究」嘅分析;科學好睇重嘅一樣嘢係一個結果有冇再現性,即係「唔同人做同一樣嘅研究係咪都會得出相同嘅結果?」呢條問題。元分析嘅做法大致上如下[140]:
Remove ads
統計模型
内文:統計模型
睇埋:最佳化
統計模型[e 242]係數學模型嘅一種。一個統計模型會帶有若干個假設,模擬一個產生數據(觀察到嘅嘢)嘅過程;一個研究者會收數據,並且用數據估計一個統計模型嘅參數數值,即係用數據估計世界嘅運作法則[141]。
- 統計參數[e 243]:參數係指一個能夠定義一個系統嘅數值;統計參數係指個統計模型裏面用嚟描述個總體嘅特性嘅數值,例如係某個變數喺個總體嗰度嘅平均值或者標準差呀噉。
- 單變量分析[e 244]:指個分析模型得一個變數[142]。
- 多變量分析[e 245]:指個分析模型有多過一個變數[142]。
- 多變量統計[e 246]:指個分析模型有多過一個應變數。
- 統計模型標明[e 247]:指「講明個統計模型要包含邊啲變數喺入面,仲有係啲變數要成點樣嘅函數」嘅過程[143]。
- 適合度[e 248]:一個統計模型有幾能夠準確噉描述手上嘅數據,一般係愈高愈好[144]。
- 多組分析[e 250]:泛指「將受試者分做幾組,每組都由佢哋數據嗰度估個統計模型出嚟,並且比較唔同組喺個模型上有乜差異」;例如研究者認為變數 同變數 喺實驗組當中會成正比,而喺對照組當中會冇相關,於是就將數據分做兩份,每份對應其中一組受試者嘅數據,然後同兩組分別建立一個結構上相同嘅迴歸模型(),睇吓呢兩組嘅 係咪有預期中嘅差異(即係喺實驗組當中係統計上顯著嘅正數,喺對照組當中統計上唔顯著);如果有,就能夠支持嗰位研究者嘅假說[146]。睇埋調節變數。
- 約束[e 251]:指喺建立一個統計模型嗰陣,指定個模型一定要滿足某啲條件;例如喺做兩組嘅多組分析嗰陣,指定一個約束,要 同 呢兩個變數之間嗰段統計關係喺兩組之間一樣,而如果施加呢個約束會搞到個模型嘅適合度明顯變差,噉個研究者就有理由話兩組之間有差異(睇埋調節效應)[147]。
- 混合物模型[e 252]:簡單講就係指將個模型設做「群體入面有若干個子群體,每個子群體之間都有顯著嘅差異」,而且唔使拃數據事先指定每個個案屬邊個子群體[148]。睇埋聚類分析嘅概念。
- 統計模型選擇[e 253]:泛指「由多個『可能描述到啲數據嘅統計模型』嗰度揀一個」嘅過程;通常係會靠「邊個模型嗰啲適合度指標最靚」嚟做基準揀。
迴歸模型

内文:迴歸模型
迴歸模型[e 254]係常用嘅一種統計模型。一般迴歸模型有若干個自變數同一個應變數,兩者多數會係連續變數,然後個演算法就嘗試畫一條能夠表達自變數同應變數之間嘅關係嘅線[149]。
- 線性迴歸模型[e 256]:最簡單嗰種迴歸模型;喺一個線性迴歸模型當中,個應變數係柞自變數嘅線性組合[149]。
- 多重迴歸模型[e 259]:指多過一個自變數嘅迴歸模型。
- 例:,當中 係第 1 個自變數, 係第 2 個自變數, 係誤差。
- 多變量適應性迴歸模型[e 260]:指以下嘅迴歸模型:
- 決定系數([e 262] ):反映一個應變數嘅變異數有幾多可以由啲自變數預測;最廣義上嘅定義如下:
- 多重共線性[e 263]:多重迴歸模型當中間中會出現嘅問題,指其中一個自變數嘅數值可以由其他自變數嘅線性噉預測,,而且準確度有返咁上下高;喺有多重共線性嘅情況下,個多重迴歸模型嘅系數(嗰柞 )嘅估計數值可能會隨模型或者數據嘅細少變化而有不穩定嘅變化;多重共線性仲可能會令人懷疑個迴歸模型嘅預測能力-原則上,如果將一個多重迴歸模型嘅 改變而第啲 數值不變,係會睇到 嘅數值會點隨住 變化嘅,但如果有多重共線性,就表示 數值變會令第啲 跟住變,「設其他 不變, 改變」呢樣嘢就會唔可行;因為噉,統計學界對於「要點樣處理多重共線性」有進行認真嘅探討[152]。
- 一般線性[e 265]模型:一種同時寫低幾個線性迴歸模型嘅做法,可以表達成[154]:
- 邏輯[e 266]迴歸:個應變數係一個二元(得兩個可能數值)變數,例如係「輸定贏」噉;啲自變數就可以係連續可以係離散;邏輯迴歸可以用嚟按一柞個案當中每個喺柞自變數上嘅數值,預測佢哋係兩類當中嘅邊一類,例如係電子遊戲研究當中可以用嚟靠一個玩家嘅數據嚟估計佢輸定贏[155]。,,用方程式嚟表達嘅話:
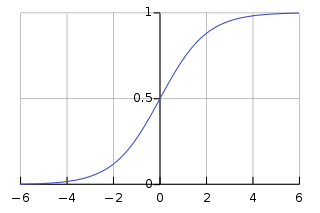
- Sigmoid 函數:以下呢個函數:
- 自迴歸模型[e 267]:用嚟處理時間序列嘅一種迴歸模型;攞一個會隨住時間變化嘅變數 ,設 做時間點 嘅 值,一個自迴歸模型會用個變數嘅過去數值做自變數,預測個變數而家嘅數值。
- 泊淞[e 268]迴歸分析:會用喺數數據上嘅一種迴歸分析,最基本嗰個模型係噉嘅樣:
- ,
- 普通最小二乘法[e 269]:其中一種最常用嚟估計線性迴歸模型參數嘅數值嘅演算法;呢一類演算法會用啲步驟逐漸改變個迴歸模型啲參數,目標係要令殘差平方和[e 270]有咁細得咁細(有關將某啲數值最大最小化嘅嘢,可以睇最佳化)。當中 RSS 係指將所有誤差值嘅平方加埋得出嘅數[149]:
- 逐步[e 271]迴歸:一種可以用嚟估計線性迴歸模型參數嘅數值嘅演算法;指
- 線性關係:如果話兩個變數 同 成線性關係,即係話如果將兩個嘅數值畫做圖,會得出一條直線,條式會係[158]:
- 固定效應[e 273]模型:指個模型嘅參數係固定或者最少非隨機嘅數值[159]。
- 隨機效應[e 274]模型:指個模型嘅參數係隨機變數[159]。
- 混合[e 275]模型:指個模型嘅參數有啲係固定或者非隨機,有啲係隨機變數[159]。
- 嵌套[e 276]模型:如果話「模型 嵌套咗喺模型 裏面」,意思即係話 啲參數係 嘅子集;研究者可以透過比較唔同模型嘅適合度指標,睇吓「邊個模型能夠最有效噉描述手上攞住嘅數據」[160]。可以睇埋奧坎剃刀嘅概念。
- 等級線性模型[e 277]:一種做多層分析[e 278]嗰時好有用嘅統計分析方法;「多層分析」意思係指樣本入面有 個群組,而每個個體都屬於某一個群組,研究者有理由相信唔同群組彼此之間會有啲系統化嘅差異。
- 例如一份管理學上嘅研究,想分析一間公司(樣本)入面嘅員工(個體),而每個員工都有佢所屬嘅工作團隊(樣本入面嘅群組),研究者有理由相信工作團隊之間嘅差異(例如係團隊領袖嘅領導能力)會影響佢想研究嘅現象,所以佢就做 HLM,用類似以下噉嘅數學方程式將唔同層面嘅變數擺入去同一條式入面[161]:
- 呢條式用文字解釋係噉: 嘅數值係受 同 呢兩個變數嘅數值影響嘅,而如果用呢個變數嘅數值去預測 嘅數值嘅話,誤差平均會係 。而家想像:
- 係「工作團隊 當中員工 嘅工作表現」,
- 係「工作團隊 當中員工 嘅身體健康」,而
- 係「工作團隊 嘅領袖嘅領導能力」-
- 跟手個研究者就去收數據,做統計分析,用數據估計 同 嘅數值。如果數據反映(例如)一個員工嘅身體健康比起佢所屬嘅團隊嘅領袖嘅領導能力更加能夠預測佢嘅工作表現(簡單啲講就係 )嘅話,噉佢就發現咗啲有用嘅嘢(對一個組織嚟講,對提高員工表現嚟講,確保員工健康比起領導能力更重要),可以將佢嘅研究結果喺期刊嗰度公佈。HLM 常見於管理學等社科領域研究,因為呢啲領域成日會遇到「樣本入面有若干個次群體」嘅情況[162]。
- 例如一份管理學上嘅研究,想分析一間公司(樣本)入面嘅員工(個體),而每個員工都有佢所屬嘅工作團隊(樣本入面嘅群組),研究者有理由相信工作團隊之間嘅差異(例如係團隊領袖嘅領導能力)會影響佢想研究嘅現象,所以佢就做 HLM,用類似以下噉嘅數學方程式將唔同層面嘅變數擺入去同一條式入面[161]:
因素分析

内文:因素分析
因素分析[e 280]係一系列用嚟將大量變數轉化成少量因素[e 281]嘅統計方法。因素分析有好多種做,不過做法一般都係由若干個直接觀察到嘅變數嗰度推想一個能夠解釋呢啲變數嘅變化嘅因素出嚟,而最後得出呢個因素能夠一定程度上反映嗰柞變數嘅變化。舉個例說明:
- 想像家陣手上個數據集有若干個可觀察[e 282]嘅隨機變數 ,而呢柞變數嘅平均值係 。
- 想像有 個數值冇得直接觀察嘅隱藏變數[e 283],,呢柞 係所謂嘅因素[註 8];
- 喺做因素分析前, 嘅數值係未知,而因素分析嘅目的就係要搵出以下呢啲式當中嘅參數:
假想 嘅數值好大(即係 數量多),研究者覺得吓吓都要用嗮柞 做運算好撈絞;而又假想 ,如果研究者搵到上述柞式嘅參數數值,佢就能夠用柞 嘅數值總結成個數據集,做到「用數量少啲嘅變數嚟做分析」嘅效果[163]。
- 潛在變數模型[e 284]:描述到啲可觀察變數(或者外顯變數)戥佢哋背後啲潛在變數之間嘅連繫。
- 因素結構[e 285]:指一個因素嘅「結構」,包含「個因素由邊啲睇到嘅變數反映」以及「每個變數嘅因素負荷量[e 286]係幾多」等嘅資訊。
- 因素負荷量[e 287]:喺每個量度咗嘅變數同個隱藏因素之間有嘅一個數,值喺 0 到 1 之間,係嗰個變數同個隱藏因素之間嘅統計相關;如果一個變數嘅因素負荷量大,就表示佢同個隱藏因素有強嘅統計相關,而如果一個變數嘅因素負荷量細,噉就表示佢同個隱藏因素之間嘅統計相關弱,通常研究者就會覺得噉表示個變數根本反映唔到個隱藏因素,會考慮將嗰個變數由個模型嗰度攞走。
- 因素分析可以分做兩大類[164]:
- 主成份分析[e 290]:因素分析嘅一種;想像有柞個案,佢哋每個喺兩個變數上都有其數值(附圖),跟住可以畫兩條線(附圖嗰兩個箭咀),兩條線分別都可以用一條包含 同 嘅算式表達,當中由圖當中可以清楚睇到,長箭咀嗰條線成功噉捕捉更多嘅變異數-亦即係話長箭咀嗰條線所代表嗰個「成份」比較能夠用嚟分辨啲個案,所以比較「重要」。喺最簡單嗰種情況下,一個做主成份分析嘅演算法大致上係噉[165]:

- 卡隆巴系數([e 291],):心理測量學上成日用嚟衡量一個心理測驗嘅信度(睇上面)嘅數值。想像家陣有個心理測驗,有 咁多條題目,而呢 條題目冚唪唥都係量度緊一個因素(例如 10 條題目量度邏輯能力),研究者搵人做個測驗攞到數據之後,個測驗嘅卡隆巴系數()條式如下[166][167]:
- 如果卡隆巴系數數值大(接近 1)嘅話,就表示呢柞題目嘅變異數主要源自佢哋之間嘅協方差,簡單講就係表示「呢柞題目之間嘅變異數主要係由佢哋之間嘅相關引起嘅」而唔係源於佢哋各自獨立嘅變異-所以如果一柞題目嘅卡隆巴系數數值大,研究者就更有理由相信呢柞題目係量度緊同一個隱藏因素[166]。
- 張量分解[e 293]:將一柞以張量形式表達嘅數據「分解」做比較簡單嘅張量以及呢啲簡單張量之間嘅運算,例[168]:
結構方程
内文:結構方程模型
結構方程式模型[e 294]:包含一系列用嚟搵出一柞變數之間嘅關係嘅數學模型同演算法;一個結構方程式模型會包含若干個變數,途中好多時會用因素分析減少變數嘅數量先,然後再用獨立嘅迴歸分析估計啲變數之間嘅關係[169]。
- 量度模型[e 295]:一個結構方程式模型當中定義啲因素(睇因素分析)嗰部份。
- 結構模型[e 296]:一個結構方程式模型當中講明因素之間嘅關係嗰部份。
- 量度不變特性[e 297]:做多組分析嘅結構方程式模型嗰陣會用到嘅概念;如果話一個量度(例如係智商測試等嘅心理測驗)具有量度不變特性,即係話喺分析緊嗰幾組之間個量度所度緊嘅概念並冇差異;舉個例說明,想像家陣有個心理學家,喺幾個唔同國家嗰度用一個心理測驗做咗份研究,但佢擔心唔同文化嘅人會對個心理測驗嘅問題有唔同理解,於是就做一個多組分析,每組係一個國家嘅受試者,再同每組都做一個因素分析(睇返因素分析),睇吓唔同組喺因素結構上係咪一樣[170]。

- 通徑分析[e 298]:指一個描述若干個變數之間嘅有方向相關嘅模型;一個通徑分析會有若干個變數,並且指明每對變數之間有點樣嘅關係,例:由 去 嘅單向箭咀表示 可以作為一個預測 嘅自變數(睇埋迴歸分析)[171]。
- 修改指數[e 299]:有好多用嚟做結構方程式模型嘅軟件喺建立完個模型之後會俾出一啲修改指數數值;喺最基本上,修改指數反映「邊條箭咀應該攞走」同「邊兩個變數之間應該要加箭咀」等嘅資訊,即係例如個程式喺建立個模型嗰陣,順手計埋「如果呢兩個變數之間嘅箭咀攞走,適合度指標會點樣變」同埋「如果呢兩個變數之間加個箭咀,適合度指標會點樣變」等嘅嘢,所以分析者如果需要執個模型,就可以靠睇啲修改指數嚟做決定[172]。
- 交叉滯後模型[e 300]:指個結構方程式模型包含兩個變數( 同 ),兩個變數都喺若干個時間點各有數值- 同 ,當中 係指時間點 嘅 數值,而 同一道理;個交叉滯後模型會嘗試用 同 嚟預測(即係有箭咀指住)未來時間點嘅 同 數值( 有箭咀指住 同 、 有箭咀指住 同 ... 如此類推);喺廿一世紀初,有唔少人覺得交叉滯後模型可以攞嚟理解兩個變數之間嘅因果關係,但呢種見解唔係個個都同意[173][174]。
拉雜模型
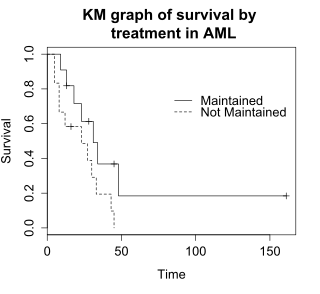

- 生還分析[e 301]:一套用嚟分析「一件事件要等幾耐先會發生」嘅統計分析技術,例如分析一隻動物要幾耐先會死-事件係「死亡」。生還分析包含咗一系列嘅技術,能夠解答以下呢啲問題:
- 聚類分析[e 303]:令一個組(聚類)入面嘅物件彼此之間相似,但同個組以外嘅物件唔相似;最基本上,聚類分析可以用附圖嗰種方法想像-圖入面拃點當中每一粒,都喺 X 軸(一個變數)同 Y 軸度有個位置,但就噉用肉眼睇都睇得出,啲點可以分做三大類(唔同色嘅點),每個聚類都係「個聚類入面啲點,彼此之間距離近,同時又冚唪唥都係同聚類外嘅點距離遠嘅」;聚類分析就可以想像成「同啲點油顏色,表示每點屬邊個聚類」嘅過程[178][179]。
- 馬可夫鏈[e 304]:一種用嚟模擬一連串可能事件嘅隨機數學模型。喺一條馬可夫鏈當中有若干個可能狀態,而每個狀態 都會有一串數字 表示世界由 呢個狀態變成另一個狀態嘅機會率;喺統計學上,一種簡單嘅做法係收數據,用數據估計 嘅數值,產生一個可以用嚟預測世界變化規律嘅模型[180]。
- 獨立成份分析[e 305]:常見於訊號處理,會將一個受多個變數影響嘅訊號 分做彼此之間獨立嘅子部份,即係將 變成 ,當中每個 都係某啲 嘅線性組合;簡單講就係 foreach ,
- ( 反映嗰個 有幾影響到 );
- 當中啲 之間要盡可能彼此獨立[181]。
- 點過程[e 306],又有叫點場[e 307]:指將一個統計模型想像成會喺一個空間當中有隨機性噉產生一啲點,可以攞嚟做好多涉及空間嘅分析,例如係地質學上分析地震噉,一場地震嘅中心可以想像成空間入面嘅一點,而一場地震出現可能會提升周圍嘅空間出現地震點嘅機會(可以睇餘震),而喺建立統計模型嚟分析地震嗰陣,分析者可以將「震央嘅出現」想像成一個會喺代表地面嘅空間嗰度產生一粒點點嘅隨機過程[182]。
- 線性判別分析[e 308]:指「攞住若干個自變數,搵出一個有齊呢啲自變數嘅線性組合,嚟分別出若干個『類別』嘅嘢」。
模型評估
睇埋:複雜度
喺做完推論統計或者機械學習過程之後,就要評估吓最後得出嗰個模型好定唔好。要評一個模型係咪「好」,有以下指標使得[183][184]:
- 準確度[e 309]:最常用嚟評估模型嘅指標;即係喺做完分析或者學習之後,要個模型睇一啲佢之前未見過嘅個案,同埋要佢對嗰啲個案進行預測。譬如一個訓練嚟預測股價嘅機械學習程式噉,要評估佢嘅準確度,最好方法就係要佢預估吓一啲股價、係佢之前未見過嘅時間點嘅。如果個程式做嘅嘢係將個案分做離散嘅類,準確度可以用以下嘅式計[185]:
-
- 係估啱咗幾多個個案;
- 係個案嘅總數。
-
- 靈敏度同特異度[e 315]:包括咗四個數值:
- 訓練曲線[e 320]:指一條以「個機械學習程式表現有幾好」做 Y 軸、「總共讀取咗嘅個案數量」做 X 軸嘅線。訓練曲線喺機械學習研究上可以用嚟比較唔同嘅機械學習演算法嘅功效、用嚟睇吓個模型用乜嘢參數值比較好、或者係個程式有冇過適[e 321]嘅問題等等[189]。
- 模型能耐[e 322]:一個機械學習模型 嘅能耐指佢能夠學解幾複雜嘅問題;要判斷一個模型嘅能耐一個可能方法係,用 個唔同複雜度嘅數學模型, 代表第 個呢啲模型,用每個 分別產生一柞數據,然後 foreach 模型出嘅數據,測試吓 有幾能夠學識對嗰個模型嘅輸出做準確預測-如果 能耐高,噉佢理應會無論 幾複雜都做到準確預測[190]。
- 演算法熵[e 323],又有叫柯氏複雜度[e 324]:理論電腦科學同相關領域上用嚟量度一件物件嘅複雜度嘅一個指標,一件物件嘅演算法熵係指要產生嗰件物件嘅程式嘅最短可能長度[191][192],
- 演算法熵以攞嚟比較唔同物件嘅複雜度。舉兩個簡單嘅例子說明,想像以下呢兩串符號:
abababababababababababababababab(串 1)4c1j5b2p0cv4w1x8rx2y39umgw5q85s7(串 2)
- 赤池資訊量準則[e 325]:基於資訊理論嘅一條統計模型評估準則;根據赤池資訊量準則,評估一個統計模型嗰陣應該要令以下嘅數值有咁細得咁細[193]:
- 貝葉斯資訊量準則[e 327]:另一條用嚟評估統計模型嘅準則;根據呢條準則,評估一個統計模型嗰陣應該要令以下嘅數值有咁細得咁細[194]:
- 當中 係樣本大細。
- 困惑度([e 328] ):反映一個概率分佈「有幾能夠預測個樣本」;一個離散概率分佈 嘅困惑度計法如下-
- ,當中
- 可詮釋度[e 329]:對於統計模型嚟講好重要嘅一種性質,指個模型有幾能夠俾人類理解所描述嘅現象背後嘅運作原理,呢個特性亦都係統計學同機械學習嘅主要分界;舉個例說明,家陣用統計分析整咗一個迴歸模型出嚟,個模型反映兩個變數之間成簡單嘅正比關係,呢個模型由人類嘅角度嚟睇相當易理解;相比之下,一個人工神經網絡就算能夠做到準確預測,個網絡「到底係用乜嘢邏輯做預測」呢點對人類嚟講依然係冇可能理解嘅。即係話,統計學嘅目的係由數據搵出可詮釋嘅模型,等人類能夠了解所研究嘅現象,而機械學習最重視嘅係做準確預測,會願意為咗做預測嗰陣嘅準確度同效率犧牲可詮釋度[197]。
Remove ads
睇埋
文獻
- Ethem Alpaydin (2004). Introduction to Machine Learning, MIT Press, ISBN 978-0-262-01243-0.
- Cohen, J. (1990). Things I have learned (so far). American Psychologist, 45, 1304-1312.
- Pedro Domingos (September 2015), The Master Algorithm, Basic Books, ISBN 978-0-465-06570-7.
- Stephen Jones, 2010. Statistics in Psychology: Explanations without Equations. Palgrave Macmillan. ISBN 9781137282392.
- VanderPlas, J. (2016). Python data science handbook: essential tools for working with data. O'Reilly Media, Inc.
- Ian H. Witten and Eibe Frank (2011). Data Mining: Practical machine learning tools and techniques. Morgan Kaufmann, 664pp., ISBN 978-0-12-374856-0.
Remove ads
註釋
- 簡單講就係冇可能同時發生嘅事件。例如家陣擲三粒骰仔,
「掟到 」同「掟到 」係冇可能同時發生嘅,但
「掟到最少一個 2」同「掟到最少一個 4」係有可能同時發生嘅。 - 不過除此之外仲要有幾個條件:
- 嘅變化時間上出現喺 嘅變化之後;
- 同 嘅共同原因攞走咗,兩個變數之間嘅關係依然喺度;
- 哈曼測試到咗 2020 年經已唔再俾人認為係一種可靠嘅做法。
- 如果 ,,否則
Remove ads
引咗
拎
Wikiwand - on
Seamless Wikipedia browsing. On steroids.
Remove ads




![{\displaystyle {\tilde {\mu }}_{3}=\operatorname {E} \left[\left({\frac {X_{i}-\mu }{\sigma }}\right)^{3}\right]}](http://wikimedia.org/api/rest_v1/media/math/render/svg/c1b8964d53bb4003863a00672157833a4993a259)
![{\displaystyle \operatorname {Kurt} [X]=\operatorname {E} \left[\left({\frac {X-\mu }{\sigma }}\right)^{4}\right]}](http://wikimedia.org/api/rest_v1/media/math/render/svg/b01ee59147056c4f6daad9f896cc1130c9368947)


 , 、 ...


![{\displaystyle G=\left(\prod _{i=1}^{n}a_{i}\right)^{\frac {1}{n}}={\sqrt[{n}]{a_{1}a_{2}\cdots a_{n}}}}](http://wikimedia.org/api/rest_v1/media/math/render/svg/f1d0467b5bb519785ec0b517071b710d921d78d8)


![{\displaystyle \rho _{X,Y}=\operatorname {corr} (X,Y)={\operatorname {cov} (X,Y) \over \sigma _{X}\sigma _{Y}}={\operatorname {E} [(X-\mu _{X})(Y-\mu _{Y})] \over \sigma _{X}\sigma _{Y}}}](http://wikimedia.org/api/rest_v1/media/math/render/svg/93185aed3047ef42fa0f1b6e389a4e89a5654afa)


![{\displaystyle \operatorname {cov} (X,Y)=\operatorname {E} {{\big [}(X-\operatorname {E} [X])(Y-\operatorname {E} [Y]){\big ]}}}](http://wikimedia.org/api/rest_v1/media/math/render/svg/f98a8bf924edb41a8025b5ffaa1b255b4a6f48b9)


![{\displaystyle [x_{1},x_{2},...x_{n}]}](http://wikimedia.org/api/rest_v1/media/math/render/svg/8893193bc76aff95df1dabff9faf706c151ac636)


![{\displaystyle [p_{0},p_{1},p_{2}...]}](http://wikimedia.org/api/rest_v1/media/math/render/svg/0d78ff407db31316cadca75ae18707799f3bca7f)


