ファイル:Milankovitch_Variations.png
ウィキペディア フリーな encyclopedia
高解像度版はありません。
Milankovitch_Variations.png (479 × 363 ピクセル、ファイルサイズ: 32キロバイト、MIME タイプ: image/png)
ウィキメディア・コモンズのファイルページにある説明を、以下に表示します。
|
概要
| 解説Milankovitch Variations.png |
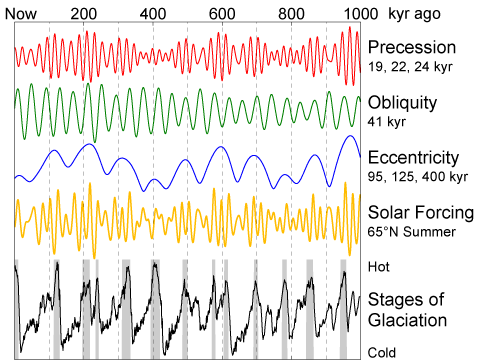
English: This figure shows the variations in Earth's orbit, the resulting changes in solar energy flux at high latitude, and the observed glacial cycles.
According to Milankovitch Theory, the precession of the equinoxes and the apsides, variations in the tilt of the Earth's axis (obliquity) and changes in the eccentricity of the Earth's orbit are responsible for causing the observed 100 kyr cycle in ice ages by varying the amount of sunlight received by the Earth at different times and locations, particularly high northern latitude summer. These changes in the Earth's orbit are the predictable consequence of interactions between the Earth, its moon, and the other planets. The orbital data shown are from Quinn et al. (1991). Principal frequencies for each of the three kinds of variations are labeled. The solar forcing curve (aka "insolation") is derived from July 1st sunlight at 65 °N latitude according to Jonathan Levine's insolation calculator [1]. The glacial data are from Lisiecki and Raymo (2005) and gray bars indicate interglacial periods, defined here as deviations in the 5 kyr average of at least 0.8 standard deviations above the mean. |
| 日付 | 2006年2月11日 (アップロード日) |
| 原典 | 投稿者自身による著作物 |
| 作者 | This image was produced by Robert A. Rohde from publicly available data, and is incorporated into the Global Warming Art project. |
| その他のバージョン | このファイルの派生的著作物: Variacions de Milankovitch.png |
References
- Lisiecki, L. E., and M. E. Raymo (2005), "A Pliocene-Pleistocene stack of 57 globally distributed benthic δ18O records." Paleoceanography 20, PA1003, doi:10.1029/2004PA001071 (alternative full text link: [2]).
- Quinn, T. R., S. Tremaine, and M. Duncan (1991), "A Three Million Year Integration of the Earth's Orbit." The Astronomical Journal 101, pp. 2287-2305, doi:10.1086/115850.

|
このグラフ画像は、ベクターイメージである SVG ファイルとして再作成されるべきです。これにはいくつかの利点があります。詳しくはCommons:Media for cleanupを参照してください。この画像の SVG 形式がすでに利用可能である場合は、アップロードしてください。アップロード後、この画像にあるこのテンプレートを{{Vector version available|新しい画像ファイル名.svg}}テンプレートで置き換えてください。
|
ライセンス
Image from Global Warming Art
This image is an original work created for Global Warming Art. Please refer to the image description page for more information.

|
この文書は、フリーソフトウェア財団発行のGNUフリー文書利用許諾書 (GNU Free Documentation License) 1.2またはそれ以降のバージョンの規約に基づき、複製や再配布、改変が許可されます。不可変更部分、表紙、背表紙はありません。このライセンスの複製は、GNUフリー文書利用許諾書という章に含まれています。http://www.gnu.org/copyleft/fdl.htmlGFDLGNU Free Documentation Licensetruetrue |
| このファイルはクリエイティブ・コモンズ 表示-継承 3.0 非移植ライセンスのもとに利用を許諾されています。 | ||
| ||
| このライセンスのテンプレートは、GFDLのライセンス・アップデートによりこのファイルに追加されたものです。http://creativecommons.org/licenses/by-sa/3.0/CC BY-SA 3.0Creative Commons Attribution-Share Alike 3.0truetrue |
キャプション
このファイルの内容を1行で記述してください
このファイルに描写されている項目
題材
image/png
ファイルの履歴
過去の版のファイルを表示するには、その版の日時をクリックしてください。
| 日付と時刻 | サムネイル | 寸法 | 利用者 | コメント | |
|---|---|---|---|---|---|
| 現在の版 | 2006年2月11日 (土) 11:35 | | 479 × 363(32キロバイト) | David Legrand | == Description == This figure shows the variations in Earth's orbit, the resulting changes in solar energy flux at high latitude, and the observed glacial cycles. According to Milankovitch Theory, the precession of the [[ |
ファイルの使用状況
以下の 2 ページがこのファイルを使用しています:
グローバルなファイル使用状況
以下に挙げる他のウィキがこの画像を使っています:
- af.wikipedia.org での使用状況
- ar.wikipedia.org での使用状況
- be.wikipedia.org での使用状況
- bg.wikipedia.org での使用状況
- ca.wikipedia.org での使用状況
- da.wikipedia.org での使用状況
- de.wikipedia.org での使用状況
- de.wikiversity.org での使用状況
- el.wikipedia.org での使用状況
- en.wikipedia.org での使用状況
- es.wikipedia.org での使用状況
- fa.wikipedia.org での使用状況
- fi.wikipedia.org での使用状況
- fr.wikipedia.org での使用状況
- fy.wikipedia.org での使用状況
- gl.wikipedia.org での使用状況
- hu.wikipedia.org での使用状況
- hy.wikipedia.org での使用状況
- id.wikipedia.org での使用状況
- ko.wikipedia.org での使用状況
- nl.wikipedia.org での使用状況
このファイルのグローバル使用状況を表示する。