Massachusetts's 2nd congressional district
U.S. House district for Massachusetts From Wikipedia, the free encyclopedia
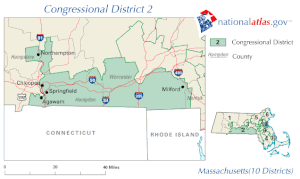
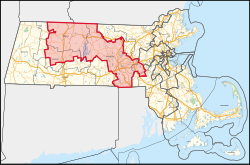
Massachusetts's 2nd congressional district is located in central Massachusetts, encompassing much of Franklin, Hampshire, and Worcester counties, as well as small portions of Middlesex and Norfolk Counties. The largest municipalities in the district include Worcester (which is the second-largest city in New England after Boston), Leominster, Amherst, Shrewsbury, and Northampton.
| Massachusetts's 2nd congressional district | |
|---|---|
Interactive map of district boundaries since January 3, 2023 | |
| Representative | |
| Population (2023) | 798,884 |
| Median household income | $95,495[1] |
| Ethnicity |
|
| Cook PVI | D+13[2] |
Democrat Jim McGovern has represented the district since 2013; he previously represented the 3rd district since 1997.
Cities and towns represented
Summarize
Perspective
As of the 2021 redistricting, the 2nd district includes 68 municipalities:[3]
Franklin County (22)
- Ashfield, Bernardston, Buckland, Colrain, Conway, Deerfield, Erving, Gill, Greenfield, Heath, Leverett, Leyden, Montague, New Salem, Northfield, Orange, Shelburne, Shutesbury, Sunderland, Warwick, Wendell, Whatley
Hampshire County (9)
Middlesex County (3)
Norfolk County (1)
Worcester County (33)
- Athol, Auburn, Barre, Boylston, Douglas, Grafton, Hardwick, Holden, Hubbardston, Leicester, Leominster, Millbury, Northborough, Northbridge, Oakham, Petersham, Paxton, Phillipston, Princeton, Royalston, Rutland, Shrewsbury, Southborough, Sterling, Sutton, Templeton, Upton, Uxbridge, Webster (part; also 1st), West Boylston, Westborough, Westminster (part; also 3rd), Worcester
History of District Boundaries
1795 to 1803
Known as the 2nd Western District.[4]
1803 to 1813
Known as the "Essex North" district.[4]
1813 to 1833

Known as the "Essex South" district.[4] From 1813-1815,[5] the district was shaped in such a way that poet and Federalist Richard Alsop described it as a "Gerry-mander" (a portmanteau of Gerry—the governor at the time—and salamander). Illustrator Elkanah Tisdale subsequently used the term as the basis for a political cartoon, which popularized it and led to "gerrymandering" being used to describe the practice of manipulating electoral district boundaries to gain a political advantage.[6]
1843 to 1853
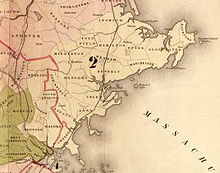
The Act of September 16, 1842, established the district on the North Shore and New Hampshire border, with the following municipalities:[7]
- In Essex County: Beverly, Danvers, Essex, Gloucester, Hamilton, Ipswich, Lynn, Lynnfield, Manchester, Marblehead, Middleton, Rockport, Salem, Saugus, Topsfield, and Wenham
- In Middlesex County: Malden, Medford, Reading, South Reading, and Stoneham
- In Suffolk County: Chelsea
1860s
"Parts of the counties of Bristol, Norfolk, and Plymouth."[8]
1870s–1900s
This section needs expansion. You can help by adding to it. (November 2013) |
1903 to 1913

During this decade, the district contained the following municipalities:[9]
- In Franklin County: Erving, Leverett, Montague, New Salem, Northfield, Orange, Shutesbury, Sunderland, Warwick, and Wendell
- In Hampshire County: Amherst, Belchertown, Easthampton, Enfield, Granby, Hadley, Northampton, Pelham, Prescott, South Hadley, and Ware
- In Hampden County: Brimfield, Chicopee, East Longmeadow, Hampden, Holland, Longmeadow, Ludlow, Monson, Palmer, Springfield, Wales, and Wilbraham
- In Worcester County: Athol, Barre, Brookfield, Dana, Hardwick, New Braintree, North Brookfield, Oakham, Petersham, Phillipston, Royalston, Warren, and West Brookfield.
1913 to 1923
During this decade, the district contained the following municipalities:[10]
- In Franklin County: Bernardston, Deerfield, Erving, Gill, Leverett, Montague, Northfield, Shutesbury, Sunderland, Warwick, Wendell, and Whately
- In Hampshire County: Amherst, Belchertown, Easthampton, Enfield, Granby, Hadley, Hatfield, Northampton, Pelham, South Hadley, Ware, and Williamsburg
- In Hampden County: Agawam, Chicopee, East Longmeadow, Hampden, Longmeadow, Ludlow, Springfield, West Springfield, and Wilbraham
1920s–2002
This section needs expansion. You can help by adding to it. (November 2013) |
2003 to 2013

During this decade, the district contained the following municipalities:
- In Hampden County: Agawam, Brimfield, Chicopee, East Longmeadow, Hampden, Holland, Longmeadow, Ludlow, Monson, Palmer, Springfield, Wales, Wilbraham
- In Hampshire County: Hadley, Northampton, South Hadley
- In Norfolk County: Bellingham
- In Worcester County: Blackstone, Brookfield, Charlton, Douglas, Dudley, East Brookfield, Grafton, Hopedale, Leicester, Mendon, Milford, Millbury, Millville, North Brookfield, Northbridge, Oxford, Southbridge, Spencer, Sturbridge, Sutton, Upton, Uxbridge, Warren, Webster
2013 to 2023
After the 2010 census, the shape of the district changed for the elections of 2012. The updated district covered central Massachusetts, including much of Worcester County, and was largely the successor to the old 3rd District. Most of the old 2nd district, including Springfield, was moved into the updated 1st district.
During this decade, the district contained the following municipalities:[11]
- In Franklin County: Deerfield, Erving, Gill, Greenfield, Leverett, Montague, New Salem, Northfield, Orange, Shutesbury, Sunderland, Wendell, Warwick, and Whately
- In Hampden County: Precinct 1 in Palmer
- In Hampshire County: Amherst, Belchertown, Hadley, Hatfield, Northampton, Pelham, and Ware
- In Norfolk County: Precincts 4 and 5 in Bellingham
- In Worcester County: Athol, Auburn, Barre, Blackstone, Boylston, Douglas, Grafton, Hardwick, Holden, Hubbardston, Leicester, Leominster, Mendon, Millbury, Millville, Northborough, Northbridge, North Brookfield, Oakham, Oxford, Paxton, Petersham, Phillipston, Princeton, Royalston, Rutland, Shrewsbury, Spencer, Sterling, Sutton, Templeton, Upton, Uxbridge, Webster, West Boylston, Westborough, Precinct 1 in Winchendon, and Worcester.
Recent election results from statewide races
| Year | Office | Results[12] |
|---|---|---|
| 2008 | President | Obama 61% - 37% |
| 2012 | President | Obama 61% - 39% |
| 2014 | Senate | Markey 58% - 42% |
| Governor | Baker 50% - 44% | |
| 2016 | President | Clinton 58% - 34% |
| 2018 | Senate | Warren 59% - 37% |
| Governor | Baker 68% - 32% | |
| Attorney General | Healey 68% - 32% | |
| 2020 | President | Biden 64% - 33% |
| Senate | Markey 64% - 34% | |
| 2022 | Governor | Healey 63% - 35% |
| Secretary of the Commonwealth | Galvin 66% - 30% | |
| Attorney General | Campbell 62% - 38% | |
| Treasurer and Receiver-General | Goldberg 75% - 25% | |
| Auditor | DiZoglio 53% - 39% |
List of members representing the district
Recent election results
1988
| Party | Candidate | Votes | % | |
|---|---|---|---|---|
| Democratic | Richard Neal | 156,262 | 80.23 | |
| Republican | Louis R. Godena | 38,446 | 19.74 | |
| Write-in | 52 | 0.01 | ||
| Majority | 117,816 | 60.40 | ||
| Turnout | ||||
| Democratic hold | ||||
1990
| Party | Candidate | Votes | % | ±% | |
|---|---|---|---|---|---|
| Democratic | Richard Neal (Incumbent) | 134,152 | 67.99 | −12.24 | |
| Write-in | 63,169 | 32.01 | +32.00 | ||
| Majority | 70,983 | 35.98 | −24.42 | ||
| Turnout | 197,321 | ||||
| Democratic hold | Swing | ||||
1992
| Party | Candidate | Votes | % | ±% | |
|---|---|---|---|---|---|
| Democratic | Richard Neal (Incumbent) | 131,215 | 53.09 | −14.90 | |
| Republican | Anthony W. Ravosa, Jr. | 76,795 | 31.07 | +31.07 | |
| Independent | Thomas R. Sheehan | 38,963 | 15.76 | +15.76 | |
| Write-in | 190 | 0.07 | −31.94 | ||
| Majority | 54,420 | 22.02 | −13.96 | ||
| Turnout | 247,163 | ||||
| Democratic hold | Swing | ||||
1994
| Party | Candidate | Votes | % | ±% | |
|---|---|---|---|---|---|
| Democratic | Richard Neal (Incumbent) | 117,178 | 58.55 | +5.46 | |
| Republican | John M. Briare | 72,732 | 36.34 | +5.27 | |
| Natural Law | Kate Ross | 10,167 | 5.08 | +5.08 | |
| Write-in | 46 | 0.02 | −0.05 | ||
| Majority | 44,446 | 22.21 | +0.19 | ||
| Turnout | 200,123 | ||||
| Democratic hold | Swing | ||||
1996
| Party | Candidate | Votes | % | ±% | |
|---|---|---|---|---|---|
| Democratic | Richard Neal (Incumbent) | 162,995 | 71.67 | +13.12 | |
| Republican | Mark Steele | 49,885 | 21.94 | −14.40 | |
| Independent | Scott Andrichak | 9,181 | 4.04 | +4.04 | |
| Natural Law | Richard Kaynor | 5,124 | 2.25 | −2.83 | |
| Write-in | 226 | 0.10 | +0.08 | ||
| Majority | 113,110 | 49.74 | +27.53 | ||
| Turnout | 227,411 | ||||
| Democratic hold | Swing | ||||
1998
| Party | Candidate | Votes | % | ±% | |
|---|---|---|---|---|---|
| Democratic | Richard Neal (Incumbent) | 130,550 | 98.95 | +27.28 | |
| Write-in | 1,383 | 1.05 | +0.95 | ||
| Majority | 129,167 | 97.90 | +48.16 | ||
| Turnout | 131,933 | ||||
| Democratic hold | Swing | ||||
2000
| Party | Candidate | Votes | % | ±% | |
|---|---|---|---|---|---|
| Democratic | Richard Neal (Incumbent) | 196,670 | 98.91 | −0.04 | |
| Write-in | 2,176 | 1.09 | +0.04 | ||
| Majority | 194,494 | 97.81 | −0.09 | ||
| Turnout | 253,867 | ||||
| Democratic hold | Swing | ||||
2002
| Party | Candidate | Votes | % | ±% | |
|---|---|---|---|---|---|
| Democratic | Richard Neal (Incumbent) | 153,387 | 99.13 | +0.22 | |
| Write-in | 1,341 | 0.87 | −0.22 | ||
| Majority | 152,046 | 98.26 | +0.45 | ||
| Turnout | 208,498 | ||||
| Democratic hold | Swing | ||||
2004
| Party | Candidate | Votes | % | ±% | |
|---|---|---|---|---|---|
| Democratic | Richard Neal (Incumbent) | 217,682 | 98.96 | −0.17 | |
| Write-in | 2,282 | 1.04 | +0.17 | ||
| Majority | 227,183 | 97.92 | −0.34 | ||
| Turnout | 287,871 | ||||
| Democratic hold | Swing | ||||
2006
| Party | Candidate | Votes | % | ±% | |
|---|---|---|---|---|---|
| Democratic | Richard Neal (Incumbent) | 164,939 | 98.65 | −0.31 | |
| Write-in | 2,254 | 1.35 | +0.31 | ||
| Majority | 162,685 | 97.30 | −0.62 | ||
| Turnout | 214,939 | ||||
| Democratic hold | Swing | ||||
2008
| Party | Candidate | Votes | % | ±% | |
|---|---|---|---|---|---|
| Democratic | Richard Neal (Incumbent) | 234,369 | 98.47 | −0.18 | |
| Write-in | 3,631 | 1.53 | +0.18 | ||
| Majority | 230,738 | 96.95 | −0.35 | ||
| Turnout | 306,820 | ||||
| Democratic hold | Swing | ||||
2010
| Party | Candidate | Votes | % | ±% | |
|---|---|---|---|---|---|
| Democratic | Richard Neal (Incumbent) | 122,751 | 57.33 | −41.14 | |
| Republican | Thomas A. Wesley | 91,209 | 42.60 | +42.60 | |
| Write-in | 164 | 0.08 | −1.45 | ||
| Majority | 31,542 | 14.73 | −82.12 | ||
| Turnout | 220,424 | ||||
| Democratic hold | Swing | ||||
2012
| Party | Candidate | Votes | % | |
|---|---|---|---|---|
| Democratic | Jim McGovern (Incumbent) | 259,257 | 98.5 | |
| Write-in | 4,078 | 1.5 | ||
| Total votes | 263,335 | 100 | ||
| Turnout | ||||
| Democratic hold | ||||
2014
| Party | Candidate | Votes | % | |
|---|---|---|---|---|
| Democratic | Jim McGovern (Incumbent) | 169,640 | 98.20 | |
| Write-in | 3,105 | 1.80 | ||
| Total votes | 172,745 | 100 | ||
| Democratic hold | ||||
2016
| Party | Candidate | Votes | % | |
|---|---|---|---|---|
| Democratic | Jim McGovern (Incumbent) | 275,487 | 98.24 | |
| Write-in | 4,924 | 1.76 | ||
| Total votes | 280,411 | 100 | ||
| Democratic hold | ||||
2018
| Party | Candidate | Votes | % | |
|---|---|---|---|---|
| Democratic | Jim McGovern (incumbent) | 191,332 | 67.2% | |
| Republican | Tracy Lovvorn | 93,391 | 32.8% | |
| Independent | Paul Grady | |||
| Total votes | 293,163 | |||
2020
| Party | Candidate | Votes | % | |
|---|---|---|---|---|
| Democratic | Jim McGovern (incumbent) | 249,854 | 65.3% | |
| Republican | Tracy Lovvorn | 132,220 | 34.6% | |
| Write-in | 378 | 0.1 | ||
| Total votes | 382,452 | |||
References
External links
Wikiwand - on
Seamless Wikipedia browsing. On steroids.


