New York's 18th congressional district
U.S. House district for New York From Wikipedia, the free encyclopedia
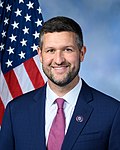
New York's 18th congressional district is a congressional district for the United States House of Representatives in New York’s Hudson Valley that contains some of the northern suburbs and exurbs of New York City. It is currently represented by Democrat Pat Ryan.
| New York's 18th congressional district | |
|---|---|
Interactive map of district boundaries since January 3, 2025 | |
| Representative | |
| Distribution |
|
| Population (2023) | 784,352 |
| Median household income | $93,064[1] |
| Ethnicity |
|
| Cook PVI | D+2[2] |
The 18th district includes all of Orange County, and most of Dutchess and Ulster Counties. The district includes the cities of Newburgh, Beacon, Kingston, and Poughkeepsie.[3]
In the August 23, 2022 Democratic Party primary Ulster County executive Pat Ryan defeated Aisha Mills and Moses Mugulusi.[4] On the same date Ryan also defeated Dutchess County executive Marc Molinaro (Republican) in a special election to fill a vacant seat in the district. The latter contest was seen as a victory in a bellwether district.[5] In the November 8, 2022 general election Ryan defeated New York State Assembly member Republican Colin Schmitt.
Republican Molinaro ran in the New York's 19th congressional district in the November general election and defeated Democrat Josh Riley. Incumbent Sean Patrick Maloney changed his election district to the New York's 17th congressional district, after redistricting maps were announced.
Recent election results from statewide races
| Year | Office | Results[6] |
|---|---|---|
| 2008 | President | Obama 55% - 44% |
| 2012 | President | Obama 56% - 44% |
| 2016 | President | Clinton 48% - 47% |
| Senate | Schumer 61% - 36% | |
| 2018 | Senate | Gillibrand 59% - 41% |
| Governor | Molinaro 48.4% - 48.0% | |
| Attorney General | James 54% - 42% | |
| 2020 | President | Biden 54% - 45% |
| 2022 | Senate | Schumer 52% - 48% |
| Governor | Zeldin 51% - 49% | |
| Attorney General | James 51% - 49% | |
| Comptroller | DiNapoli 53% - 47% | |
| 2024 | President | Harris 52% - 48% |
| Senate | Gillibrand 57% - 43% |
History
Summarize
Perspective
2023–present:
2013–2023: (map)
- All of Orange and Putnam
- Parts of Dutchess and Westchester
2003–2013:
- Parts of Rockland, Westchester
1993–2003:
- Parts of Bronx, Queens, Westchester
1983–1993:
- Parts of Bronx
1913–1983:
- Parts of Manhattan
1853–1873:
The 18th District was created in 1813. For many years, it was the upper Manhattan district. It was the east side Manhattan seat in the 1970s and then a Bronx district in the 1980s, Following the 1992 remap it became a Westchester-based district with narrow corridor through the Bronx and a large portion of central Queens. The 2002 remap gave those Queens areas to the 5th District and the 18th absorbed some Rockland areas due to the deconstruction of the old Orange-Rockland 20th District. In 2012, population lost in New York pushed the district further north, into the mid-Hudson Valley suburbs. From 2002 to 2013, the 18th district included most of Westchester County and part of Rockland County. It included Larchmont, Mamaroneck, New Rochelle, Ossining, the Town of Pelham, Scarsdale, Tarrytown, White Plains as well as most of New City and Yonkers.
The redrawn district is composed of the following percentages of voters of the 2003-2013 congressional districts: 1 percent from the 18th congressional district; 76 percent from the 19th congressional district; 2 percent from the 20th congressional district; and 21 percent from the 22nd congressional district.[7]
From 2012 to 2020, the district was a presidential bellwether, voting for the winner each time.[8]
Counties and municipalities
For the 119th and successive Congresses (based on the districts drawn following the New York Court of Appeals' December 2023 decision in Hoffman v New York State Ind. Redistricting. Commn.), the district contains all or portions of the following counties and municipalities.[9][10]
Dutchess County (27)
- Amenia, Beacon, Beekman (part; also 17th; includes Chelsea Cove), Clinton, Dover, Fishkill (town), Fishkill (village), Hyde Park, LaGrange, Milan, Millbrook, Millerton, North East, Pine Plains, Pleasant Valley, Poughkeepsie (city), Poughkeepsie (town), Red Hook (town), Red Hook (village), Rhinebeck (town), Rhinebeck (village), Stanford, Tivoli, Union Vale, Wappinger, Wappingers Falls, Washington
Orange County (43)
- All 43 municipalities
Ulster County (13)
- Esopus, Gardiner (part; also 19th; shared with Gardiner CDP), Kingston (city), Kingston (town), Lloyd, Marlborough, New Paltz (town), New Paltz (village), Plattekill, Saugerties (town), Saugerties (village), Ulster, Woodstock
List of members representing the district
Recent election results
Summarize
Perspective
Note that in New York State electoral politics there are numerous minor parties at various points on the political spectrum. Certain parties will invariably endorse either the Republican or Democratic candidate for every office, hence the state electoral results contain both the party votes, and the final candidate votes (Listed as "Recap").
1996
| Party | Candidate | Votes | % | ±% | |
|---|---|---|---|---|---|
| Democratic | Nita Lowey (Incumbent) | 118,194 | 63.6% | ||
| Republican | Kerry J. Katsorhis | 59,487 | 32.0% | ||
| Independence | Concetta M. Ferrara | 4,283 | 2.3% | ||
| Right to Life | Florence T. O'Grady | 3,758 | 2.0% | ||
| Majority | 58,707 | 31.6% | |||
| Turnout | 185,722 | 100% | |||
1998
| Party | Candidate | Votes | % | ±% | |
|---|---|---|---|---|---|
| Democratic | Nita Lowey (Incumbent) | 91,623 | 82.8% | +19.2% | |
| Conservative | Daniel McMahon | 12,594 | 11.4% | +11.4% | |
| Independence | Giulio A. Cavallo | 3,251 | 2.9% | +0.6% | |
| Right to Life | Marion M. Conner | 3,234 | 2.9% | +0.9% | |
| Majority | 79,029 | 71.4% | +39.8% | ||
| Turnout | 110,702 | 100% | −40.4% | ||
2000
| Party | Candidate | Votes | % | ±% | |
|---|---|---|---|---|---|
| Democratic | Nita Lowey (Incumbent) | 126,878 | 67.3% | −15.5% | |
| Republican | John G. Vonglis | 58,022 | 30.8% | +30.8% | |
| Right to Life | Florence T. O'Grady | 3,747 | 2.0% | −0.9% | |
| Majority | 68,856 | 36.5% | +34.9% | ||
| Turnout | 188,647 | 100% | +70.4% | ||
2002
| Party | Candidate | Votes | % | ±% | |
|---|---|---|---|---|---|
| Democratic | Nita Lowey (Incumbent) | 98,957 | 92.0% | +24.7% | |
| Right to Life | Michael J. Reynolds | 8,558 | 8.0% | +6.0% | |
| Majority | 90,399 | 84.1% | +47.6% | ||
| Turnout | 107,515 | 100% | −43.0% | ||
2004
| Party | Candidate | Votes | % | ±% | |
|---|---|---|---|---|---|
| Democratic | Nita Lowey (Incumbent) | 170,715 | 69.8% | −22.2% | |
| Republican | Richard A. Hoffman | 73,975 | 30.2% | +30.2% | |
| Majority | 96,740 | 39.5% | −44.6% | ||
| Turnout | 244,690 | 100% | +127.6% | ||
2006
| Party | Candidate | Votes | % | ±% | |
|---|---|---|---|---|---|
| Democratic | Nita Lowey (Incumbent) | 124,256 | 70.7% | +0.9% | |
| Republican | Richard A. Hoffman | 51,450 | 29.3% | −0.9% | |
| Majority | 72,806 | 41.4% | +1.9% | ||
| Turnout | 175,706 | 100% | −28.2% | ||
2008
| Party | Candidate | Votes | % | ±% | |
|---|---|---|---|---|---|
| Democratic | Nita Lowey (Incumbent) | 174,791 | 68.5% | −2.2% | |
| Republican | Jim Russell | 80,498 | 29.3% | −0.9% | |
| Majority | 94,293 | 41.4% | +29.5% | ||
| Turnout | 255,289 | 100% | +45.3% | ||
2010
| Party | Candidate | Votes | % | ±% | |
|---|---|---|---|---|---|
| Democratic | Nita Lowey (Incumbent) | 114,810 | 58.2% | −10.3% | |
| Republican | Jim Russell | 70,015 | 35.5% | +6.2% | |
| Majority | 44,795 | 22.7% | −18.7% | ||
| Turnout | 197,212 | 100% | −23.8% | ||
2012
| Party | Candidate | Votes | % | ±% | ||
|---|---|---|---|---|---|---|
| Democratic | Sean Patrick Maloney | 130,462 | 51.7% | −6.5 | ||
| Republican | Nan Hayworth (Incumbent) | 121,911 | 48.3% | +12.8 | ||
| Majority | 8,551 | 3.5% | −19.2 | |||
| Turnout | 252,373 | 100% | +21.9 | |||
| Democratic gain from Republican | ||||||
2014
| Party | Candidate | Votes | % | ±% | |
|---|---|---|---|---|---|
| Democratic | Sean Patrick Maloney (Incumbent) | 84,415 | 47.6% | −4.1 | |
| Republican | Nan Hayworth | 81,625 | 46.0% | −2.3 | |
| Send Mr. Smith | Scott Smith | 4,924 | 2.3% | +2.3% | |
| Majority | 2,790 | 1.6% | −1.9 | ||
| Turnout | 177,424 | 100% | −29.7 | ||
2016
| Party | Candidate | Votes | % | ±% | |
|---|---|---|---|---|---|
| Democratic | Sean Patrick Maloney (Incumbent) | 162,060 | 55.6% | +8.0 | |
| Republican | Phil Oliva | 129,369 | 44.0% | −1.6 | |
| Majority | 32,691 | 11.6% | +10.0 | ||
| Turnout | 291,429 | 100% | +64.4 | ||
2018
| Party | Candidate | Votes | % | ±% | |
|---|---|---|---|---|---|
| Democratic | Sean Patrick Maloney (Incumbent) | 139,564 | 55.5% | −0.1 | |
| Republican | James O'Donnell | 112,035 | 44.5% | +0.5 | |
| Majority | 27,529 | 11.0% | −0.6 | ||
| Turnout | 251,599 | 100% | −13.8 | ||
2020
| Party | Candidate | Votes | % | |
|---|---|---|---|---|
| Democratic | Sean Patrick Maloney | 170,899 | 51.0 | |
| Working Families | Sean Patrick Maloney | 12,914 | 3.8 | |
| Independence | Sean Patrick Maloney | 3,356 | 1.0 | |
| Total | Sean Patrick Maloney (incumbent) | 187,169 | 55.8 | |
| Republican | Chele Farley | 128,568 | 38.3 | |
| Conservative | Chele Farley | 16,530 | 4.9 | |
| Total | Chele Farley | 145,098 | 43.2 | |
| Libertarian | Scott Smith | 2,686 | 0.8 | |
| SAM | Scott Smith | 476 | 0.2 | |
| Total | Scott Smith | 3,162 | 1.0 | |
| Total votes | 335,429 | 100.0 | ||
| Democratic hold | ||||
2022
| Party | Candidate | Votes | % | |
|---|---|---|---|---|
| Democratic | Pat Ryan | 123,168 | 46.15 | |
| Working Families | Pat Ryan | 12,077 | 4.52 | |
| Total | Pat Ryan (incumbent) | 135,245 | 50.67 | |
| Republican | Colin Schmitt | 116,972 | 43.83 | |
| Conservative | Colin Schmitt | 14,681 | 5.50 | |
| Total | Colin Schmitt | 131,653 | 49.33 | |
| Total votes | 266,398 | 100.0 | ||
| Democratic hold | ||||
2024
| Party | Candidate | Votes | % | |
|---|---|---|---|---|
| Democratic | Pat Ryan | 189,345 | 52.3 | |
| Working Families | Pat Ryan | 17,761 | 4.9 | |
| Total | Pat Ryan (incumbent) | 207,106 | 57.2 | |
| Republican | Alison Esposito | 138,409 | 38.2 | |
| Conservative | Alison Esposito | 16,720 | 4.6 | |
| Total | Alison Esposito | 155,129 | 42.8 | |
| Total votes | 362,235 | 100.0 | ||
| Democratic hold | ||||
See also
Notes
References
External links
Wikiwand - on
Seamless Wikipedia browsing. On steroids.


