Kentucky's 1st congressional district
U.S. House district for Kentucky From Wikipedia, the free encyclopedia

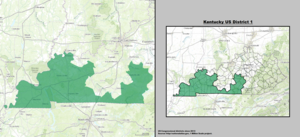
Kentucky's 1st congressional district is a congressional district in the U.S. state of Kentucky. Located in Western Kentucky, and stretching into Central Kentucky, the district takes in Henderson, Hopkinsville, Madisonville, Paducah, Murray, Danville, and Frankfort. The district is represented by Republican James Comer who won a special election to fill the seat of Rep. Ed Whitfield who resigned in September 2016. Comer also won election to the regular term to begin January 3, 2017.
| Kentucky's 1st congressional district | |
|---|---|
Interactive map of district boundaries since January 3, 2023 | |
| Representative | |
| Distribution |
|
| Population (2023) | 750,693[2] |
| Median household income | $54,615[3] |
| Ethnicity |
|
| Cook PVI | R+23[4] |
.svg)


Characteristics
| Voter registration and party enrollment as of March 2025[5] | |||||
|---|---|---|---|---|---|
| Party | Number of voters | Percentage | |||
| Republican | 273,575 | 49.51% | |||
| Democratic | 227,546 | 41.18% | |||
| Other | 29,714 | 5.38% | |||
| Independent | 21,722 | 3.93% | |||
| Total | 552,557 | 100.00% | |||
Until January 1, 2006, Kentucky did not track party affiliation for registered voters who were neither Democratic nor Republican.[6] The Kentucky voter registration card does not explicitly list anything other than Democratic Party, Republican Party, or Other, with the "Other" option having a blank line and no instructions on how to register as something else.[7]
Recent election results from statewide races
| Year | Office | Results[8][9][10] |
|---|---|---|
| 2008 | President | McCain 61% - 37% |
| 2012 | President | Romney 66% - 34% |
| 2016 | President | Trump 70% - 26% |
| Senate | Paul 64% - 36% | |
| 2019 | Governor | Bevin 57% - 41% |
| Attorney General | Cameron 65% - 35% | |
| 2020 | President | Trump 71% - 28% |
| Senate | McConnell 65% - 31% | |
| 2022 | Senate | Paul 71% - 29% |
| 2023 | Governor | Cameron 56% - 44% |
| Attorney General | Coleman 67% - 33% | |
| Auditor of Public Accounts | Ball 69% - 31% | |
| Secretary of State | Adams 69% - 31% | |
| Treasurer | Metcalf 66% - 34% | |
| 2024 | President | Trump 73% - 26% |
Composition
Summarize
Perspective
For the 118th and successive Congresses (based on redistricting following the 2020 census), the district contains all or portions of the following counties and communities:[11]
Adair County (1)
Allen County (1)
Anderson County (0)
- No incorporated or census-recognized communities
Ballard County (7)
- All 7 communities
Boyle County (3)
- All 3 communities
Caldwell County (3)
- All 3 communities
Calloway County (3)
- All 3 communities
Carlisle County (2)
Casey County (1)
Christian County (9)
- All 9 communities
Clinton County (1)
- All 3 communities
Franklin County (1)
Fulton County (3)
- All 3 communities
Graves County (10)
- All 10 communities
Henderson County (6)
- All 6 communities
Hickman County (2)
Hopkins County (10)
- All 10 communities
- All 6 communities
Logan County (4)
- Adairville, Dunmor (part; also 2nd; shared with Muhlenberg County), Lewisburg, Russellville
Lyon County (2)
McCracken County (5)
- All 5 communities
Marion County (4)
- All 4 communities
Marshall County (4)
- All 4 communities
Metcalfe County (2)
Monroe County (3)
- All 3 communities
Russell County (2)
Simpson County (1)
Taylor County (1)
Todd County (5)
- All 5 counties
Trigg County (2)
Union County (5)
- All 5 communities
- All 3 communities
Webster County (8)
- All 8 communities
List of members representing the district

_2.jpg)


.jpg)
.jpg)

.jpg)


.jpg)

.jpg)


Recent election results
2000
| Party | Candidate | Votes | % | |
|---|---|---|---|---|
| Republican | Ed Whitfield* | 132,115 | 58.00 | |
| Democratic | Brian Roy | 95,806 | 42.000 | |
| Total votes | 227,921 | 100.00 | ||
| Republican hold | ||||
2002
| Party | Candidate | Votes | % | |
|---|---|---|---|---|
| Republican | Ed Whitfield* | 117,600 | 65.26 | |
| Democratic | Klint Alexander | 62,617 | 34.74 | |
| Total votes | 180,217 | 100.00 | ||
| Republican hold | ||||
2004
| Party | Candidate | Votes | % | |
|---|---|---|---|---|
| Republican | Ed Whitfield* | 175,972 | 67.37 | |
| Democratic | Billy Cartwright | 85,229 | 32.63 | |
| Total votes | 261,201 | 100.00 | ||
| Republican hold | ||||
2006
| Party | Candidate | Votes | % | |
|---|---|---|---|---|
| Republican | Ed Whitfield* | 123,618 | 59.58 | |
| Democratic | Tom Barlow | 83,865 | 40.42 | |
| Total votes | 207,483 | 100.00 | ||
| Republican hold | ||||
2008
| Party | Candidate | Votes | % | |
|---|---|---|---|---|
| Republican | Ed Whitfield* | 178,107 | 64.35 | |
| Democratic | Heather Ryan | 98,674 | 35.65 | |
| Total votes | 276,781 | 100.00 | ||
| Turnout | ||||
| Republican hold | ||||
2010
| Party | Candidate | Votes | % | |
|---|---|---|---|---|
| Republican | Ed Whitfield* | 153,519 | 71.25 | |
| Democratic | Charles K. Hatchett | 61,690 | 28.75 | |
| Total votes | 215,209 | 100.00 | ||
| Republican hold | ||||
2012
| Party | Candidate | Votes | % | |
|---|---|---|---|---|
| Republican | Ed Whitfield* | 199,956 | 69.63 | |
| Democratic | Charles K. Hatchett | 87,199 | 30.37 | |
| Total votes | 287,155 | 100.00 | ||
| Republican hold | ||||
2014
| Party | Candidate | Votes | % | |
|---|---|---|---|---|
| Republican | Ed Whitfield (incumbent) | 173,022 | 73.1 | |
| Democratic | Charles Kendall Hatchett | 63,596 | 26.9 | |
| Total votes | 236,618 | 100.0 | ||
| Republican hold | ||||
2016
| Party | Candidate | Votes | % | |
|---|---|---|---|---|
| Republican | James Comer | 216,959 | 72.6 | |
| Democratic | Sam Gaskins | 81,710 | 27.3 | |
| Independent | Terry McIntosh (write-in) | 332 | 0.1 | |
| Total votes | 299,001 | 100.0 | ||
| Republican hold | ||||
2018
| Party | Candidate | Votes | % | |
|---|---|---|---|---|
| Republican | James Comer (incumbent) | 172,167 | 68.6 | |
| Democratic | Paul Walker | 78,849 | 31.4 | |
| Total votes | 251,016 | 100.0 | ||
| Republican hold | ||||
2020
| Party | Candidate | Votes | % | |
|---|---|---|---|---|
| Republican | James Comer (incumbent) | 246,329 | 75.0 | |
| Democratic | James Rhodes | 82,141 | 25.0 | |
| Total votes | 328,470 | 100.0 | ||
| Republican hold | ||||
2022
| Party | Candidate | Votes | % | |
|---|---|---|---|---|
| Republican | James Comer (incumbent) | 184,157 | 74.9 | |
| Democratic | Jimmy Ausbrooks | 61,701 | 25.1 | |
| Total votes | 245,858 | 100.0 | ||
| Republican hold | ||||
2024
| Party | Candidate | Votes | % | |
|---|---|---|---|---|
| Republican | James Comer (incumbent) | 252,729 | 74.7 | |
| Democratic | Erin Marshall | 85,524 | 25.3 | |
| Total votes | 338,253 | 100.0 | ||
| Republican hold | ||||
See also
Notes
- Supported the Adams-Clay faction in the 1824 United States presidential election
- Adair, Allen, Ballard, Caldwell, Calloway, Carlisle, Casey, Christian, Clinton, Crittenden, Cumberland, Fulton,
Graves, Henderson, Hickman, Hopkins, Livingston, Logan, Lyon, Marshall, Marion, McCracken, McLean,
Metcalfe, Monroe, Muhlenberg, Ohio, Russell, Simpson, Taylor, Todd, Trigg, Union, Washington (part), and Webster counties
References
Wikiwand - on
Seamless Wikipedia browsing. On steroids.