Demographics of the United States
From Wikipedia, the free encyclopedia

The United States is the third most populous country in the world, and the most populous in the Americas and the Western Hemisphere, with an estimated population of 340,110,988 on July 1, 2024, according to the U.S. Census Bureau.[1] This was an increase of 2.6% over the 2020 federal census of 331,449,281 residents.[2] These figures include the 50 states and the federal capital, Washington, D.C., but exclude the 3.6 million residents of five unincorporated U.S. territories (Puerto Rico, Guam, the U.S. Virgin Islands, American Samoa, and the Northern Mariana Islands) as well as several minor uninhabited island possessions. The Census Bureau showed a population increase of 0.98% for the twelve-month period ending in July 2024,[3] slightly below the world estimated annual growth rate of 1.03%.[21] By several metrics, including racial and ethnic background, religious affiliation, and percentage of rural and urban divide, the state of Illinois is the most representative of the larger demography of the United States.[22]
This article may be too long to read and navigate comfortably. (February 2025) |
| Demographics of the United States | |
|---|---|
Population pyramid of the United States in 2023 | |
| Population | 340,110,988 (2024 estimate)[1] 331,449,281 (2020 census)[2] |
| Density | 86.16/sq mi (33.27/km2) |
| Growth rate | 0.98% (2024)[3] |
| Birth rate | 10.7 births/1,000 population (2023) |
| Death rate | 9.2 deaths/1,000 population (2023) |
| Life expectancy | 78.4 years (2023)[4] |
| • male | 75.8 years (2023)[4] |
| • female | 81.1 years (2023)[4] |
| Infant mortality rate | 5.4 deaths/1,000 live births (2020)[5] |
| Net migration rate | 3 migrant(s)/1,000 population (2024)[6] |
| Age structure | |
| Under 18 years | 21.7% (2023 est.)[7] |
| 18–44 years | 36.0% (2023 est.)[7] |
| 45–64 years | 24.6% (2023 est.)[7] |
| 65 and over | 17.7% (2023 est.)[7] |
| Sex ratio | |
| Total | 0.98 male(s)/female (2023 est.)[7] |
| At birth | 1.045 male(s)/female (2022)[8] |
| Under 15 | 1.05 male(s)/female (2023 est.)[7] |
| 15–64 years | 1.01 male(s)/female (2023 est.)[7] |
| 65 and over | 0.82 male(s)/female (2023 est.)[7] |
| Nationality | |
| Nationality | American |
| Major ethnic |
|
| Minor ethnic |
|
| Language | |
| Official | See: No official language at national level. English is designated official in 32 of 50 states (and in all 5 U.S. territories). Hawaiian is official in Hawaii, 20 Native languages are official in Alaska, and Sioux is official in South Dakota.[16] Samoan is an official language in American Samoa,[17] Chamorro is an official language in Guam,[18] Chamorro and Carolinian are official languages in the Northern Mariana Islands,[19] and Spanish is an official language in Puerto Rico.[20] |
| Spoken |
|
| Source: The World Factbook[6] | |
The "History" and "Education" sections of this article currently lack content. Please consider adding relevant information. |
The United States population almost quadrupled during the 20th century—at a growth rate of about 1.3% a year—from about 76 million in 1900 to 281 million in 2000.[23] It is estimated to have reached the 200 million mark in 1967, and the 300 million mark on October 17, 2006.[23][24] Foreign-born immigration caused the U.S. population to continue its rapid increase, with this population doubling from almost 20 million in 1990 to over 45 million in 2015,[25] representing one-third of the population increase.[26] The U.S. Census Bureau reported in late 2024 that recent immigration to the United States had more than offset the country's lower birth and fertility rates: "Net international migration’s influence on population trends has increased over the last few years. Since 2021, it accounted for the majority of the nation’s growth—a departure from the last two decades, when natural increase was the main factor." This in turn led to a notable increase in the U.S. population in each of the years 2022, 2023, and 2024 (+0.58%, +0.83%, and +0.98%, respectively).[27]
Population growth is fastest among minorities as a whole, and according to a 2020 U.S. Census Bureau analysis, 50% of U.S. children under the age of 18 are now members of ethnic minority groups.[28] As of 2020, white Americans numbered 235,411,507 or 71% of the population, including people who identified as white in combination with another race. People who identified as white alone (including Hispanic whites) numbered 204,277,273 or 61.6% of the population, while non-Latino whites made up 57.8% of the country's population.[29]
Latino Americans accounted for 51.1% of the country's total population growth between 2010 and 2020.[30] The Hispanic or Latino population increased from 50.5 million in 2010 to 62.1 million in 2020, a 23% increase and a numerical increase of more than 11.6 million.[30] Immigrants and their U.S.-born descendants are expected to provide most of the U.S. population gains in the decades ahead.[31]
Asian Americans are the fastest-growing racial group in the United States, with a growth rate of 35%. However, multi-racial Asian Americans make up the fastest-growing subgroup, with a growth rate of 55%, reflecting the increase of mixed-race marriages in the United States.[32][33]
As of 2022[update], births to White American mothers remain around 50% of the U.S. total, a decline of 3% compared to 2021.[34] In the same time period, births to Asian American and Hispanic women increased by 2% and 6%, respectively.[35]

History
This section needs expansion. You can help by adding to it. (February 2025) |
Population
Summarize
Perspective
| Census | Pop. | Note | %± |
|---|---|---|---|
| 1790 | 3,929,326 | — | |
| 1800 | 5,308,483 | 35.1% | |
| 1810 | 7,239,881 | 36.4% | |
| 1820 | 9,638,453 | 33.1% | |
| 1830 | 12,866,020 | 33.5% | |
| 1840 | 17,069,453 | 32.7% | |
| 1850 | 23,191,876 | 35.9% | |
| 1860 | 31,443,321 | 35.6% | |
| 1870 | 38,925,598 | 23.8% | |
| 1880 | 50,189,209 | 28.9% | |
| 1890 | 62,979,766 | 25.5% | |
| 1900 | 76,212,168 | 21.0% | |
| 1910 | 92,228,496 | 21.0% | |
| 1920 | 106,021,537 | 15.0% | |
| 1930 | 122,775,046 | 15.8% | |
| 1940 | 132,164,569 | 7.6% | |
| 1950 | 150,697,361 | 14.0% | |
| 1960 | 179,323,175 | 19.0% | |
| 1970 | 203,392,031 | 13.4% | |
| 1980 | 226,545,805 | 11.4% | |
| 1990 | 248,709,873 | 9.8% | |
| 2000 | 281,421,906 | 13.2% | |
| 2010 | 308,745,538 | 9.7% | |
| 2020 | 331,449,281 | 7.4% | |
| 2024 (est.) | 340,110,988 | [1] | 2.6% |
| U.S. Decennial Census | |||
In 1900, when the U.S. population was 76 million, there were 66.8 million white Americans in the United States, representing 88% of the total population,[36] 8.8 million Black Americans, with about 90% of them still living in Southern states,[37] and slightly more than 500,000 Hispanics.[38]
Under federal law, the Immigration and Nationality Act of 1965,[39] the number of first-generation immigrants living in the United States has increased,[40] from 9.6 million in 1970 to about 38 million in 2007.[41] Around a million people legally immigrated to the United States per year in the 1990s, up from 250,000 per year in the 1950s.[42]
In 1900, non-Hispanic whites comprised almost 97% of the population of the 10 largest U.S. cities.[43] The Census Bureau reported that minorities (including Hispanic whites) made up 50.4% of the children born in the U.S. between July 2010 and July 2011,[44] compared to 37% in 1990.[45]
In 2014, the state with the lowest fertility rate was Rhode Island, with a rate of 1.56, while Utah had the greatest rate with a rate of 2.33.[46] This correlates with the ages of the states' populations: Rhode Island has the ninth-oldest median age in the US – 39.2 – while Utah has the youngest – 29.0.[47]
In 2017, the U.S. birth rate remains well below the replacement level needed – at least 2.1 children per woman so as not to experience population decreases – as white American births fell in all 50 states and the District of Columbia. Among non-Hispanic white women, no states had a fertility rate above the replacement level. Among non-Hispanic Black women, 12 states reached above the replacement level needed. Among Hispanic women, 29 states did.[48] For non-Hispanic white women, the highest total fertility rate was in Utah, at 2.099, and the lowest in the District of Columbia, at 1.012. Among non-Hispanic Black women, the highest total fertility rate was in Maine, at 4.003, and the lowest in Wyoming, at 1.146. For Hispanic women, the highest total fertility rate was in Alabama, at 3.085, and the lowest in Vermont, at 1.200, and Maine, at 1.281.[48][49] As of 2016, due to aging, low birth rates and rising mortality driven partly by drug overdoses, deaths outnumber births among non-Hispanic whites in more than half the states in the country.[50]
Growth rate


-2.00% or less
-0.01% to -1.99%
0% to 0.99%
1% to 2.49%
2.5% to 4.99%
5% to 8.99%
9% to 11.99%
12% or more
- U.S. population growth rates: 0.98% (2024), 0.83% (2023), 0.58% (2022), 0.16% (2021), 0.41% (2020)[3]
Age and sex distribution

Proportion of Americans under the age of 18 in each county of the fifty states, the District of Columbia, and Puerto Rico as of the 2020 United States census

Proportion of Americans under the age of 5 in each county of the fifty states, the District of Columbia, and Puerto Rico as of the 2020 United States census
| Age (years) | Total (thousands) | % of US pop. | Males (thousands) | Females (thousands) | % male | % female | Sex ratio (males per female) |
|---|---|---|---|---|---|---|---|
| 0 | 3,564 | 1.1% | 1,822 | 1,743 | 51.1% | 48.9% | 1.05 |
| < 5 | 18,827 | 5.7% | 9,624 | 9,203 | 51.1% | 48.9% | 1.05 |
| < 15 | 60,467 | 18.2% | 30,989 | 29,578 | 51.2% | 48.8% | 1.05 |
| 15-24 | 43,089 | 13.0% | 21,996 | 21,092 | 51.0% | 49.0% | 1.04 |
| 25-34 | 45,495 | 13.7% | 23,053 | 22,442 | 50.7% | 49.3% | 1.03 |
| 35-44 | 43,404 | 13.1% | 21,858 | 21,546 | 50.4% | 49.6% | 1.01 |
| 45-54 | 40,688 | 12.3% | 20,312 | 20,376 | 49.9% | 50.1% | 0.99 |
| 55-64 | 42,803 | 12.9% | 20,963 | 21,840 | 49.0% | 51.0% | 0.96 |
| 65+ | 55,848 | 16.8% | 25,214 | 30,634 | 45.1% | 54.9% | 0.82 |
| 75+ | 22,182 | 6.7% | 9,344 | 12,837 | 42.1% | 57.9% | 0.73 |
| 85+ | 5,976 | 1.8% | 2,176 | 3,800 | 36.4% | 63.6% | 0.57 |
| 100+ | 98 | 0.03% | 25 | 73 | 25.5% | 74.5% | 0.34 |
| Total | 331,894 | 100% | 164,385 | 167,509 | 49.5% | 50.5% | 0.98 |
Age and sex distribution (2021)
Note that this table shows some people in more than one group: for example someone aged 90 is included three times: in "65+", "75+" and "85+".
| Age Group | Percentage |
|---|---|
| 0–14 years | 18.2% |
| 15–24 years | 13.0% |
| 25–54 years | 39.0% |
| 55–64 years | 12.9% |
| 65 years and over | 16.8% |
Percent distribution of the total population by age: 1900 to 2015
Sources: U.S. Census Bureau, U.S. Department of Commerce, United Nations medium variant projections[53]
| Ages | 1900 | 1910 | 1920 | 1930 | 1940 | 1950 | 1960 | 1970 | 1980 | 1990 | 2000 | 2010 | 2015 |
|---|---|---|---|---|---|---|---|---|---|---|---|---|---|
| 0–14 years | 34.5 | 32.1 | 31.8 | 29.4 | 25.0 | 26.9 | 31.1 | 28.5 | 22.6 | 21.5 | 21.4 | 20.2 | 19.8 |
| 15–24 years | 19.6 | 19.7 | 17.7 | 18.3 | 18.2 | 14.7 | 13.4 | 17.4 | 18.8 | 14.8 | 13.9 | ||
| 25–44 years | 28.1 | 29.2 | 29.6 | 29.5 | 30.1 | 30.0 | 26.2 | 23.6 | 27.7 | 32.5 | 30.2 | ||
| 45–64 years | 13.7 | 14.6 | 16.1 | 17.5 | 19.8 | 20.3 | 20.1 | 20.6 | 19.6 | 18.6 | 22.0 | ||
| 65 years and over | 4.1 | 4.3 | 4.7 | 5.4 | 6.8 | 8.1 | 9.2 | 9.9 | 11.3 | 12.6 | 12.4 | 13.0 | 14.3 |
| Total (%) | 100 | 100 | 100 | 100 | 100 | 100 | 100 | 100 | 100 | 100 | 100 | 33.2 | 34.1 |
Percent distribution of the total population by age groups (1900 to 2015).
Dependency ratio

The dependency ratio is the age-population ratio of people who are normally not in the labor force (the dependent population, which includes those aged 0 to 14 and 65 and older) to those who are (the productive part, ages 15 to 64). It is used to gauge the strain on the populace that is productive. The support ratio is the ratio of the working-age population to the elderly population, that is, the reciprocal of the aged dependency ratio.

Density

Number of persons per square mile in the United States in 2010

States and territories in the United States by population per square mile, according to the 2020 United States census

Counties in the United States by population growth since 2010 according to the U.S. Census Bureau 2018 Annual Estimate of the Resident Population.[55] Counties with population growth greater than the United States as a whole are in dark green, counties with population growth slower than the United States in light green, and counties with declining populations in light red.

States in the United States by population growth since 2010 according to the U.S. Census Bureau 2018 Annual Estimate of the Resident Population.[55] States with population growth greater than the United States as a whole are in dark green, states with population growth slower than the United States in light green, and states with declining populations in light red.
The most densely populated state is New Jersey (1,263/mi2 or 488/km2).
The population is highly urbanized, with 83.3% of the population residing in cities and suburbs.[6] Large urban clusters are spread throughout the eastern half of the United States (particularly the Great Lakes area, northeast, east, and southeast) and the western tier states; mountainous areas, principally the Rocky Mountains and Appalachian chain, deserts in the southwest, the dense boreal forests in the extreme north, and the central prairie states are less densely populated; Alaska's population is concentrated along its southern coast – with particular emphasis on the city of Anchorage – and Hawaii's is centered on the island of Oahu.[6] California and Texas are the most populous states, as the mean center of U.S. population has consistently shifted westward and southward.[56][57] New York City is the most populous city in the United States[58] and has been since at least 1790.
In the U.S. territories, population centers include the San Juan metro area in Puerto Rico,[59] Saipan in the Northern Mariana Islands,[60] and the island of Tutuila in American Samoa.[61]
Median age of the population

Median Age by County 2022
46 or more
43 to 45.9
39 to 42.9
35 to 39.9
34.9 or less
The median age of the total population as of 2021 is 38.8 years; the male median age is 37.7 years; the female median age is 39.8 years.[52]
Median age of the U.S. population through history. Source: U.S. Department of Commerce. Bureau of Census, United States Census Bureau and The World Factbook.[62][63]
| Years | 1820 | 1830 | 1840 | 1850 | 1860 | 1870 | 1880 | 1890 | 1900 |
|---|---|---|---|---|---|---|---|---|---|
| Median age of the total population | 16.7 | 17.2 | 17.8 | 18.9 | 19.4 | 20.2 | 20.9 | 22.0 | 22.9 |
| Median age of males | 16.6 | 17.2 | 17.9 | 19.2 | 19.8 | 20.2 | 21.2 | 22.3 | 23.3 |
| Median age of females | 16.8 | 17.3 | 17.8 | 18.6 | 19.1 | 20.1 | 20.7 | 21.6 | 22.4 |
| Years | 1910 | 1920 | 1930 | 1940 | 1950 | 1960 | 1970 | 1980 | 1990 | 2000 | 2010 | 2018 | 2021 |
|---|---|---|---|---|---|---|---|---|---|---|---|---|---|
| Median age of the total population | 24.1 | 25.3 | 26.5 | 29.0 | 30.2 | 29.6 | 28.1 | 30.0 | 32.9 | 35.3 | 37.2 | 38.2 | 38.8 |
| Median age of males | 24.6 | 25.8 | 26.7 | 29.1 | 29.9 | 28.7 | 26.8 | 28.8 | 31.7 | 34.0 | 35.8 | 36.9 | 37.7 |
| Median age of females | 23.5 | 24.7 | 25.2 | 29.0 | 30.5 | 30.4 | 29.8 | 31.2 | 34.1 | 36.5 | 38.5 | 39.5 | 39.8 |
Population centers
The United States has dozens of major cities, including 31 "global cities"[64] of all types, with 10 in the "alpha" group of global cities: New York, Los Angeles, Chicago, Washington, D.C., Boston, San Francisco, Miami, Philadelphia, Dallas, and Atlanta.[65] As of 2021[update], the United States had 56 metropolitan areas with 1 million or more inhabitants. (The U.S. Census Bureau ranked Urban Honolulu as the 56th most populous area, with just over 1 million residents. See Table of United States Metropolitan Statistical Areas.)
As of 2011[update], about 250 million Americans live in or around urban areas. That means more than three-quarters of the U.S. population shares just about three percent of the U.S. land area.[66]
The following table shows the populations of the top twenty metropolitan areas.
Largest metropolitan areas in the United States | |||||||||
|---|---|---|---|---|---|---|---|---|---|
| Rank | Name | Region | Pop. | Rank | Name | Region | Pop. | ||
 New York  Los Angeles |
1 | New York | Northeast | 19,940,274 | 11 | Boston | Northeast | 5,025,517 |  Chicago  Dallas–Fort Worth |
| 2 | Los Angeles | West | 12,927,614 | 12 | Riverside–San Bernardino | West | 4,744,214 | ||
| 3 | Chicago | Midwest | 9,408,576 | 13 | San Francisco | West | 4,648,486 | ||
| 4 | Dallas–Fort Worth | South | 8,344,032 | 14 | Detroit | Midwest | 4,400,578 | ||
| 5 | Houston | South | 7,796,182 | 15 | Seattle | West | 4,145,494 | ||
| 6 | Miami | South | 6,457,988 | 16 | Minneapolis–Saint Paul | Midwest | 3,757,952 | ||
| 7 | Washington, D.C. | South | 6,436,489 | 17 | Tampa–St. Petersburg | South | 3,424,560 | ||
| 8 | Atlanta | South | 6,411,149 | 18 | San Diego | West | 3,298,799 | ||
| 9 | Philadelphia | Northeast | 6,330,422 | 19 | Denver | West | 3,052,498 | ||
| 10 | Phoenix | West | 5,186,958 | 20 | Orlando | South | 2,940,513 | ||
Vital statistics
Summarize
Perspective
U.S. demographic table since 1915
Notable events in US demographics:
- 1929-1939 – Great Depression
- 1973 – Roe v. Wade
- 2008 – 2008 financial crisis
| Average population | Live births | Deaths | Natural change | Crude birth rate (per 1,000) | Crude death rate (per 1,000)[73] | Natural change (per 1,000) | Crude migration change (per 1,000) | Total fertility rate[fn 1][62][74] | |
|---|---|---|---|---|---|---|---|---|---|
| 1915 | 100,546,000 | 2,965,000 | 436,593 | 2,528,407 | 25.1 | 13.6 | 3.4 | ||
| 1916 | 101,961,000 | 2,964,000 | 486,682 | 2,477,318 | 25.0 | 14.0 | 3.3 | -10.9 | |
| 1917 | 103,268,000 | 2,944,000 | 776,222 | 2,167,778 | 24.7 | 14.3 | 5.6 | -11.3 | 3.333 |
| 1918 | 103,208,000 | 2,948,000 | 996,627 | 1,951,373 | 24.6 | 18.1 | 3.6 | -21.6 | 3.312 |
| 1919 | 104,514,000 | 2,740,000 | 798,104 | 1,941,896 | 22.3 | 12.9 | 5.5 | -6.2 | 3.068 |
| 1920 | 106,461,000 | 2,950,000 | 836,134 | 2,113,866 | 23.7 | 13.0 | 6.3 | 0.05 | 3.263 |
| 1921 | 108,538,000 | 3,055,000 | 825,511 | 2,229,489 | 24.2 | 11.6 | 8.2 | -0.34 | 3.326 |
| 1922 | 110,049,000 | 2,882,000 | 938,545 | 1,943,455 | 22.3 | 11.7 | 7.6 | -6.5 | 3.109 |
| 1923 | 111,947,000 | 2,910,000 | 992,237 | 1,917,763 | 22.2 | 12.2 | 7.2 | -0.41 | 3.101 |
| 1924 | 114,109,000 | 2,979,000 | 1,006,994 | 1,972,006 | 22.4 | 11.7 | 8.1 | 2.1 | 3.121 |
| 1925 | 115,828,000 | 2,909,000 | 1,030,518 | 1,878,482 | 21.5 | 11.8 | 7.3 | -2.2 | 3.012 |
| 1926 | 117,397,000 | 2,839,000 | 1,093,511 | 1,745,489 | 20.7 | 12.5 | 6.5 | -2.6 | 2.901 |
| 1927 | 119,085,000 | 2,802,000 | 1,176,805 | 1,625,195 | 20.6 | 11.4 | 8.1 | -0.48 | 2.824 |
| 1928 | 120,509,000 | 2,674,000 | 1,361,987 | 1,312,013 | 19.8 | 12.1 | 7.2 | -1.7 | 2.660 |
| 1929 | 121,767,000 | 2,582,000 | 1,369,757 | 1,212,243 | 18.9 | 11.9 | 6.6 | -0.44 | 2.532 |
| 1930 | 123,077,000 | 2,618,000 | 1,321,367 | 1,296,633 | 18.9 | 11.4 | 7.2 | 0.79 | 2.533 |
| 1931 | 124,040,000 | 2,506,000 | 1,301,405 | 1,204,595 | 18.0 | 11.1 | 6.5 | -2.7 | 2.402 |
| 1932 | 124,840,000 | 2,440,000 | 1,293,269 | 1,146,731 | 17.4 | 10.9 | 6.3 | -3.2 | 2.319 |
| 1933 | 125,579,000 | 2,307,000 | 1,342,106 | 964,894 | 16.6 | 9.7 | 5.9 | -3.3 | 2.172 |
| 1934 | 126,374,000 | 2,396,000 | 1,396,903 | 999,097 | 17.1 | 10.1 | 6.1 | -1.3 | 2.232 |
| 1935 | 127,250,000 | 2,377,000 | 1,392,752 | 984,248 | 18.7 | 10.9 | 7.7 | -0.97 | 2.189 |
| 1936 | 128,053,000 | 2,355,000 | 1,479,228 | 875,772 | 18.4 | 11.5 | 6.8 | -0.5 | 2.146 |
| 1937 | 128,825,000 | 2,413,000 | 1,450,427 | 962,573 | 18.7 | 11.2 | 7.5 | -1.5 | 2.173 |
| 1938 | 129,825,000 | 2,496,000 | 1,381,391 | 1,114,609 | 19.2 | 10.6 | 8.6 | -0.9 | 2.222 |
| 1939 | 130,880,000 | 2,466,000 | 1,387,897 | 1,078,103 | 18.8 | 10.6 | 8.2 | -0.1 | 2.172 |
| 1940 | 131,930,000 | 2,559,000 | 1,417,269 | 1,142,000 | 19.4 | 10.8 | 8.7 | -0.7 | 2.301 |
| 1941 | 133,058,000 | 2,703,000 | 1,397,642 | 1,305,358 | 20.3 | 10.5 | 9.8 | -1.3 | 2.399 |
| 1942 | 133,752,000 | 2,989,000 | 1,385,187 | 1,603,813 | 22.2 | 10.3 | 12 | -6.8 | 2.628 |
| 1943 | 133,971,000 | 3,104,000 | 1,459,544 | 1,644,306 | 22.8 | 10.7 | 12.3 | -10.7 | 2.718 |
| 1944 | 132,622,000 | 2,939,000 | 1,411,338 | 1,644,456 | 21.2 | 10.2 | 12.4 | -22.6 | 2.568 |
| 1945 | 132,137,000 | 2,858,000 | 1,401,719 | 1,456,281 | 20.4 | 11 | 11 | -14.7 | 2.491 |
| 1946 | 139,893,000 | 3,411,000 | 1,395,617 | 2,015,383 | 24.1 | 10.0 | 14.4 | 41.0 | 2.943 |
| 1947 | 143,375,000 | 3,817,000 | 1,445,370 | 2,371,630 | 26.6 | 10.0 | 16.5 | 7.8 | 3.274 |
| 1948 | 146,045,000 | 3,637,000 | 1,444,337 | 2,192,663 | 24.9 | 9.8 | 15 | 3.3 | 3.109 |
| 1949 | 148,558,000 | 3,649,000 | 1,443,607 | 2,205,393 | 24.5 | 9.7 | 14.8 | 2.1 | 3.110 |
| 1950 | 151,240,000 | 3,632,000 | 1,452,454 | 2,180,000 | 24.1 | 9.6 | 14.4 | 3.3 | 3.091 |
| 1951 | 153,384,000 | 3,823,000 | 1,482,099 | 2,340,901 | 24.8 | 9.6 | 15.3 | -1.3 | 3.269 |
| 1952 | 155,761,000 | 3,913,000 | 1,496,838 | 2,416,162 | 25.0 | 9.6 | 15.5 | -0.2 | 3.358 |
| 1953 | 158,313,000 | 3,965,000 | 1,518,459 | 2,517,541 | 25.2 | 9.1 | 15.9 | 0.2 | 3.424 |
| 1954 | 161,191,000 | 4,078,000 | 1,481,091 | 2,596,909 | 24.8 | 9.3 | 16.1 | 1.8 | 3.543 |
| 1955 | 164,302,000 | 4,104,000 | 1,528,717 | 2,568,283 | 25.0 | 9.3 | 15.6 | 3.3 | 3.580 |
| 1956 | 167,261,000 | 4,218,000 | 1,564,476 | 2,653,524 | 25.1 | 9.3 | 15.9 | 1.8 | 3.689 |
| 1957 | 170,295,000 | 4,308,000 | 1,633,128 | 2,666,872 | 25.3 | 9.5 | 15.7 | 2.1 | 3.767 |
| 1958 | 173,239,000 | 4,255,000 | 1,647,886 | 2,607,114 | 24.4 | 9.5 | 15 | 2.0 | 3.701 |
| 1959 | 176,511,000 | 4,244,796 | 1,656,814 | 2,587,982 | 24.0 | 9.4 | 14.7 | 3.8 | 3.670 |
| 1960 | 179,977,000 | 4,257,850 | 1,711,982 | 2,545,868 | 23.7 | 9.5 | 14.1 | 5.2 | 3.654 |
| 1961 | 182,953,000 | 4,268,326 | 1,701,522 | 2,566,804 | 23.3 | 9.3 | 14.0 | 2.3 | 3.629 |
| 1962 | 185,771,000 | 4,167,362 | 1,756,720 | 2,410,642 | 22.4 | 9.5 | 13 | 2.2 | 3.474 |
| 1963 | 188,483,000 | 4,098,020 | 1,813,549 | 2,284,471 | 21.7 | 9.6 | 12.1 | 2.3 | 3.333 |
| 1964 | 191,141,000 | 4,027,490 | 1,798,051 | 2,229,439 | 21.1 | 9.4 | 11.7 | 2.2 | 3.208 |
| 1965 | 193,526,000 | 3,760,358 | 1,828,136 | 1,932,222 | 19.4 | 9.5 | 9.9 | 2.4 | 2.928 |
| 1966 | 195,576,000 | 3,606,274 | 1,863,149 | 1,743,125 | 18.4 | 9.5 | 8.9 | 1.6 | 2.736 |
| 1967 | 197,457,000 | 3,520,959 | 1,851,323 | 1,669,636 | 17.8 | 9.4 | 8.4 | 1.1 | 2.578 |
| 1968 | 199,399,000 | 3,501,564 | 1,930,082 | 1,571,482 | 17.6 | 9.7 | 7.9 | 1.8 | 2.477 |
| 1969 | 201,385,000 | 3,600,206 | 1,921,990 | 1,678,216 | 17.9 | 9.5 | 8.4 | 1.5 | 2.465 |
| 1970 | 203,984,000 | 3,731,386 | 1,921,031 | 1,810,355 | 18.4 | 9.4 | 9.0 | 3.7 | 2.480 |
| 1971 | 206,827,000 | 3,555,970 | 1,927,542 | 1,628,428 | 17.2 | 9.3 | 7.9 | 5.8 | 2.266 |
| 1972 | 209,284,000 | 3,258,411 | 1,963,944 | 1,294,467 | 15.6 | 9.4 | 6.2 | 5.5 | 2.010 |
| 1973 | 211,357,000 | 3,136,965 | 1,973,003 | 1,163,962 | 14.8 | 9.5 | 5.3 | 4.5 | 1.879 |
| 1974 | 213,342,000 | 3,159,958 | 1,934,388 | 1,225,570 | 14.8 | 9.1 | 5.7 | 3.6 | 1.835 |
| 1975 | 215,465,000 | 3,144,198 | 1,892,879 | 1,251,319 | 14.6 | 8.8 | 5.8 | 4.1 | 1.774 |
| 1976 | 217,563,000 | 3,167,788 | 1,909,440 | 1,258,348 | 14.6 | 8.8 | 5.8 | 3.8 | 1.738 |
| 1977 | 219,760,000 | 3,326,632 | 1,899,597 | 1,427,035 | 15.1 | 8.6 | 6.5 | 3.5 | 1.789 |
| 1978 | 222,095,000 | 3,333,279 | 1,927,788 | 1,405,491 | 15.0 | 8.7 | 6.3 | 4.2 | 1.760 |
| 1979 | 224,567,000 | 3,494,398 | 1,913,841 | 1,580,557 | 15.6 | 8.5 | 7.1 | 3.9 | 1.808 |
| 1980 | 227,225,000 | 3,612,258 | 1,989,841 | 1,622,417 | 15.9 | 8.8 | 7.1 | 4.6 | 1.839 |
| 1981 | 229,466,000 | 3,629,238 | 1,977,981 | 1,651,257 | 15.8 | 8.6 | 7.2 | 2.6 | 1.812 |
| 1982 | 231,664,000 | 3,680,537 | 1,974,797 | 1,705,740 | 15.9 | 8.5 | 7.4 | 2.1 | 1.827 |
| 1983 | 233,792,000 | 3,638,933 | 2,019,201 | 1,619,732 | 15.6 | 8.6 | 6.9 | 2.2 | 1.799 |
| 1984 | 235,825,000 | 3,669,141 | 2,039,369 | 1,629,772 | 15.6 | 8.6 | 6.9 | 1.7 | 1.806 |
| 1985 | 237,924,000 | 3,760,561 | 2,086,440 | 1,674,121 | 15.8 | 8.8 | 7.0 | 1.8 | 1.844 |
| 1986 | 240,133,000 | 3,756,547 | 2,105,361 | 1,651,186 | 15.6 | 8.8 | 6.9 | 2.3 | 1.837 |
| 1987 | 242,289,000 | 3,809,394 | 2,123,323 | 1,686,071 | 15.7 | 8.8 | 7.0 | 1.9 | 1.872 |
| 1988 | 244,499,000 | 3,909,510 | 2,167,999 | 1,741,511 | 16.0 | 8.9 | 7.1 | 1.9 | 1.934 |
| 1989 | 246,819,000 | 4,040,958 | 2,150,466 | 1,890,492 | 16.4 | 8.7 | 7.7 | 1.7 | 2.014 |
| 1990 | 249,623,000 | 4,158,212 | 2,148,463 | 2,009,749 | 16.7 | 8.6 | 8.1 | 3.1 | 2.081 |
| 1991 | 252,981,000 | 4,110,907 | 2,169,518 | 1,941,389 | 16.2 | 8.6 | 7.7 | 5.6 | 2.062 |
| 1992 | 256,514,000 | 4,065,014 | 2,175,613 | 1,889,401 | 15.8 | 8.5 | 7.4 | 6.4 | 2.046 |
| 1993 | 259,919,000 | 4,000,240 | 2,268,553 | 1,731,687 | 15.4 | 8.7 | 6.7 | 6.4 | 2.019 |
| 1994 | 263,126,000 | 3,952,767 | 2,278,994 | 1,673,773 | 15.0 | 8.7 | 6.4 | 5.8 | 2.001 |
| 1995 | 266,278,000 | 3,899,589 | 2,312,132 | 1,587,457 | 14.6 | 8.7 | 6.0 | 5.8 | 1.978 |
| 1996 | 269,394,000 | 3,891,494 | 2,314,690 | 1,576,804 | 14.4 | 8.6 | 5.9 | 5.7 | 1.976 |
| 1997 | 272,647,000 | 3,880,894 | 2,314,245 | 1,566,649 | 14.2 | 8.5 | 5.7 | 6.2 | 1.971 |
| 1998 | 275,854,000 | 3,941,553 | 2,337,256 | 1,604,297 | 14.3 | 8.5 | 5.8 | 5.8 | 1.999 |
| 1999 | 279,040,000 | 3,959,417 | 2,391,399 | 1,568,018 | 14.2 | 8.6 | 5.6 | 5.8 | 2.007 |
| 2000 | 282,162,411 | 4,058,814 | 2,403,351 | 1,655,463 | 14.4 | 8.5 | 5.9 | 5.2 | 2.056 |
| 2001 | 284,968,955 | 4,025,933 | 2,416,425 | 1,609,508 | 14.1 | 8.5 | 5.6 | 4.2 | 2.030 |
| 2002 | 287,625,193 | 4,021,726 | 2,443,387 | 1,578,339 | 14.0 | 8.5 | 5.5 | 3.7 | 2.020 |
| 2003 | 290,107,933 | 4,089,950 | 2,448,288 | 1,641,662 | 14.1 | 8.4 | 5.6 | 3.0 | 2.047 |
| 2004 | 292,805,298 | 4,112,052 | 2,397,615 | 1,714,437 | 14.0 | 8.2 | 5.9 | 3.3 | 2.051 |
| 2005 | 295,516,599 | 4,138,349 | 2,448,017 | 1,690,332 | 14.0 | 8.3 | 5.7 | 3.5 | 2.057 |
| 2006 | 298,379,912 | 4,265,555 | 2,426,264 | 1,839,291 | 14.3 | 8.1 | 6.2 | 3.4 | 2.108 |
| 2007 | 301,231,207 | 4,316,234 | 2,423,712 | 1,892,522 | 14.3 | 8.0 | 6.3 | 3.2 | 2.120 |
| 2008 | 304,093,966 | 4,247,694 | 2,471,984 | 1,775,710 | 14.0 | 8.1 | 5.9 | 3.5 | 2.072 |
| 2009 | 306,771,529 | 4,130,665 | 2,437,163 | 1,693,502 | 13.5 | 7.9 | 5.6 | 3.1 | 2.002 |
| 2010 | 309,327,143 | 3,999,386 | 2,468,435 | 1,530,951 | 13.0 | 8.0 | 4.9 | 3.3 | 1.931 |
| 2011 | 311,849,745 | 3,953,590 | 2,515,458 | 1,438,412 | 12.7 | 8.1 | 4.6 | 3.5 | 1.894 |
| 2012 | 314,361,094 | 3,952,841 | 2,543,279 | 1,409,562 | 12.6 | 8.1 | 4.5 | 3.5 | 1.880 |
| 2013 | 316,755,680 | 3,932,181 | 2,596,993 | 1,336,183 | 12.4 | 8.2 | 4.2 | 3.3 | 1.857 |
| 2014 | 319,297,805 | 3,988,076 | 2,626,418 | 1,361,658 | 12.5 | 8.2 | 4.3 | 3.7 | 1.862 |
| 2015 | 321,882,469 | 3,978,497 | 2,712,630 | 1,265,867 | 12.4 | 8.4 | 4.0 | 4.1 | 1.843 |
| 2016 | 324,426,311 | 3,945,875 | 2,744,248 | 1,201,627 | 12.2 | 8.5 | 3.7 | 4.1 | 1.820 |
| 2017[75][76] | 326,686,918 | 3,855,500 | 2,813,503 | 1,041,997 | 11.8 | 8.6 | 3.2 | 3.7 | 1.765 |
| 2018[77][78] | 328,571,142 | 3,791,712 | 2,839,205 | 952,507 | 11.5 | 8.6 | 2.9 | 2.8 | 1.729 |
| 2019 | 330,284,261 | 3,747,540 | 2,854,858 | 892,682 | 11.3 | 8.6 | 2.7 | 2.5 | 1.706 |
| 2020[79][80][81]: 4 | 331,577,720[a] | 3,613,647 | 3,383,729 | 229,918 | 10.9 | 10.2 | 0.7 | 3.0 | 1.641 |
| 2021[83][84][85] | 332,099,760[a] | 3,664,292 | 3,464,231 | 200,061 | 11.0 | 10.4 | 0.6 | 1.1 | 1.664[85]: 5 |
| 2022[86][87][85] | 334,017,321[a] | 3,667,758 | 3,279,857 | 387,901 | 11.0 | 9.8 | 1.2 | 5.1 | 1.656[85]: 5 |
| 2023[88] | 336,806,231[a] | 3,596,017 | 3,090,964 | 505,053 | 10.68 | 9.2 | 1.5 | 6.8 | 1.617 |
| 2024p[b][88] | 340,110,988 | 3,618,267 | 3,065,049 | 553,218 | 10.64 | 9.0 | 1.6 | 8.2 | 1.611[c] |
Current vital statistics
| Period | Live births | Deaths | Natural increase |
|---|---|---|---|
| January-February 2024 | 580,036 | 549,626 | +30,410 |
| January-February 2025 | 568,845 | 534,135 | +34,710 |
| Difference |
All current numbers in this section are provisional and may change through future updates. For more information, please see the reference link.
Graphs are unavailable due to technical issues. Updates on reimplementing the Graph extension, which will be known as the Chart extension, can be found on Phabricator and on MediaWiki.org. |
Births, deaths and natural increase in the United States 1935–2021


According to the U.S. Census Bureau, in 2021, the population of the United States grew at a slower rate than in any other year since the country's founding.[90] The U.S. population grew only 0.1% from the previous year before.[90] The United States' population has grown by less than one million people for the first time since 1937, with the lowest numeric growth since at least 1900, when the Census Bureau began yearly population estimates.[90] Apart from the previous few years, when population growth plummeted to historically low levels, the slowest pace of increase in the twentieth century occurred between 1918 and 1919, when the influenza epidemic and World War I were both in full swing.[90] Slower population growth has been the norm in the United States for some years, owing to lower fertility and net international migration, as well as rising mortality from an aging population.[90]
To put it another way, since the mid-2010s, births and net international migration have been dropping while deaths have risen. These trends have a cumulative effect of reduced population increase.[90]
The COVID-19 pandemic has accelerated this trend, resulting in a historically slow population increase in 2021.
The growth rate is 0.1% as estimated for 2021.[90]
The birth rate is 11.0 births/1,000 population, as of 2020.[81] This was the lowest birth rate since records began. There were 3,613,647 births in 2020, this was the lowest number of births since 1980.[81]
- 11.0 births/1,000 population per year (final data for 2020).
- 11.4 births/1,000 population per year (final data for 2019).[81]
In 2020, the CDC reported that there were 1,676,911 marriages in 2020, compared to 2019, there were 2,015,603 marriages.[91] Marriage rates varied significantly by state, ranging from 3.2 marriages/1,000 population in California to 21.0 marriages/1,000 population in Nevada.*[92]
- 5.1 marriages/1,000 population per year (provisional data for 2020).[91]
- 6.1 marriages/1,000 population per year (provisional data for 2019).[91]
*Rates are based on provisional counts of marriages by state of occurrence
In 2009, Time magazine reported that 40% of births were to unmarried women.[93] The following is a breakdown by race for unwed births: 17% Asian, 29% White, 53% Hispanics (of any race), 66% Native Americans, and 72% Black American.[94]
According to the CDC, in 2020, there were at least, 1,461,121 births to unmarried women. In 2020, 40.5% of births were to unmarried women. The following is a breakdown by race for unwed births: 28.4% Non-Hispanic White, 70.4% Non-Hispanic Black, and 52.8% Hispanic (of any race).[95]
The drop in the birth rate from 2007 to 2009 is believed to be associated with the Great Recession.[96]
A study by the Agency for Healthcare Research and Quality (AHRQ) found that more than half (51 percent) of live hospital births in 2008 and 2011 were male.[97]
Per U.S. federal government data released in March 2011, births fell 4% from 2007 to 2009, the largest drop in the U.S. for any two-year period since the 1970s.[98] Births have declined for three consecutive years, and are now 7% below the peak in 2007.[99] This drop has continued through 2010, according to data released by the U.S. National Center for Health Statistics in June 2011.[99] Numerous experts have suggested that this decline is largely a reflection of unfavorable economic conditions.[100] This connection between birth rates and economic downturns partly stems from the fact that American birth rates have now fallen to levels that are comparable to the Great Depression of the 1930s.[101] Teen birth rates in the U.S. are at the lowest level in U.S. history.[102] In fact, teen birth rates in the U.S. have consistently decreased since 1991 through 2011, except for a brief increase between 2005 and 2007.[102] The other aberration from this otherwise steady decline in teen birth rates is the 6% decrease in birth rates for 15- to 19-year-olds between 2008 and 2009.[102] Despite these years of decrease, U.S. teen birth rates are still higher than in other developed nations.[102] Racial differences prevail with teen birth and pregnancy rates as well. The American Indian/Alaska Native, Hispanic, and non-Hispanic Black teen pregnancy rates are more than double the non-Hispanic white teen birth rate.[103]
| Age group (2010) | Total (of population) |
White alone (of race/age group) |
Black alone (of race/age group) |
Mixed and/or Some Other Race (of race/age group) |
Asian alone (of race/age group) |
Either American Indian or Alaska Native (of race/age group) |
Either Native Hawaiian or Other Pacific Islander (of race/age group) |
|---|---|---|---|---|---|---|---|
| Total | 308745538 (100%) | 223553265 (72.4%) | 38929319 (12.6%) | 28116441 (9.1%) | 14674252 (4.9%) | 2932248 (1.0%) | 540013 (0.2%) |
| 0–4 | 20201362 (6.5%) | 12795675 (5.7%/63.3%) | 2902590 (7.5%/14.4%) | 3315480 (11.8%/16.4%) | 898011 (6.1%/4.5%) | 244615 (8.3%/1.2%) | 44991 (8.3%/0.2%) |
| 5–9 | 20348657 (6.6%) | 13293799 (5.9%/65.3%) | 2882597 (7.4%/14.2%) | 2957487 (10.5%/14.5%) | 928248 (6.3%/4.6%) | 243259 (8.3%/1.2%) | 43267 (8.0%/0.0%) |
| 10–14 | 20677194 (6.7%) | 13737332 (6.1%/66.4%) | 3034266 (7.8%/14.7%) | 2736570 (9.7%/13.2%) | 881590 (6.0%/4.3%) | 245049 (8.4%/1.19%) | 42387 (7.8%/0.2%) |
| 15–19 | 22040343 (7.1%) | 14620638 (6.5%/66.4%) | 3448051 (8.9%/15.6%) | 2704571 (9.6%/12.3%) | 956028 (6.5%/4.3%) | 263805 (9.0%/1.2%) | 47250 (8.7%/0.2%) |
| 20–24 | 21585999 (7.0%) | 14535947 (6.5%/67.3%) | 3111397 (8.0%/14.4%) | 2538967 (9.0%/11.8%) | 1106222 (7.5%/5.1%) | 240716 (8.2%/1.1%) | 52750 (9.8%/0.2%) |
| 25–29 | 21101849 (6.8%) | 14345364 (6.4%/68.0%) | 2786254 (7.2%/13.2%) | 2464343 (8.8%/11.7%) | 1234322 (8.4%/5.9%) | 221654 (7.6%/1.1%) | 49912 (9.2%/0.2%) |
| 30–34 | 19962099 (6.5%) | 13573270 (6.1%/68.0%) | 2627925 (6.8%/13.2%) | 2273322 (8.1%/11.4%) | 1240906 (8.5%/6.2%) | 202928 (6.9%/1.0%) | 43748 (8.1%/0.2%) |
| 35–39 | 20179642 (6.5%) | 13996797 (6.3%/69.36%) | 2613389 (6.7%/13.0%) | 2038408 (7.2%/10.1%) | 1296301 (8.8%/6.4%) | 196017 (6.7%/1.0%) | 38730 (7.2%/0.2%) |
| 40–44 | 20890964 (6.8%) | 15052798 (6.7%/72.1%) | 2669034 (6.9%/12.8%) | 1782463 (6.3%/8.5%) | 1155565 (7.9%/5.5%) | 194713 (6.6%/0.9%) | 36391 (6.7%/0.2%) |
| 45–49 | 22708591 (7.4%) | 17028255 (7.6%/75.0%) | 2828657 (7.3%/12.5%) | 1532117 (5.4%/6.8%) | 1076060 (7.3%/4.7%) | 207857 (7.1%/0.9%) | 35645 (6.6%/0.2%) |
| 50–54 | 22298125 (7.2%) | 17178632 (7.7%/77.0%) | 2694247 (6.9%/12.1%) | 1222175 (4.3%/5.5%) | 980282 (6.7%/4.4%) | 191893 (6.5%/0.9%) | 30896 (5.7%/0.1%) |
| 55–59 | 19664805 (6.4%) | 15562187 (7.0%/79.1%) | 2205820 (5.7%/11.2%) | 873943 (3.1%/4.4%) | 844490 (5.8%/4.3%) | 154320 (5.3%/0.8%) | 24045 (4.5%/0.1%) |
| 60–64 | 16817924 (5.4%) | 13693334 (6.1%/81.4%) | 1686695 (4.3%/10.0%) | 611144 (2.2%/3.6%) | 689601 (4.7%/4.1%) | 118362 (4.0%/0.7%) | 18788 (3.5%/0.1%) |
| 65–69 | 12435263 (4.0%) | 10313002 (4.6%/82.9%) | 1162577 (3.0%/9.4%) | 394208 (1.4%/3.2%) | 474327 (3.2%/3.8%) | 79079 (2.7%/0.6%) | 12070 (2.2%/0.1%) |
| 70–74 | 9278166 (3.0%) | 7740932 (3.5%/83.4%) | 852317 (2.2%/9.2%) | 268574 (1.0%/2.9%) | 354268 (2.4%/3.8%) | 53926 (1.8%/0.6%) | 8149 (1.5%/0.1%) |
| 75–79 | 7317795 (2.4%) | 6224569 (2.8%/85.1%) | 616789 (1.6%/8.4%) | 184596 (0.7%/2.5%) | 251210 (1.7%/3.4%) | 35268 (1.2%/0.5%) | 5363 (1.0%/0.1%) |
| 80–84 | 5743327 (1.9%) | 5002427 (2.2%/87.1%) | 424592 (1.1%/7.4%) | 122249 (0.4%/2.1%) | 168879 (1.2%/2.9%) | 21963 (0.7%/0.4%) | 3217 (0.6%/0.1%) |
| 85+ | 5493433 (1.8%) | 4858307 (2.2%/88.4%) | 382122 (1.0%/7.0%) | 95824 (0.3%/1.7%) | 137942 (0.9%/2.5%) | 16824 (0.6%/0.3%) | 2414 (0.4%/0.0%) |
Total fertility rate (TFR)

In 1800 the average U.S. woman had 7.04 children;[104] by the first decade of the 1900s, this number had already decreased to 3.56.[105] Since 1971, the birth rate has generally been below the replacement rate of 2.1.[106][107]: 3 Since the Great Recession of 2007, the rate has consistently been below replacement.[106][107]: 3 The drop in the TFR from 2.08 per woman in 2007 to 1.76 in 2017 was mostly due to the declining birth rate of ethnic minorities, teenagers and women in their 30s.[108] During that period, the birthrate for women ages 35 to 44 has risen.[106][108] The 12 month ending general fertility rate increased from 56.6 to 57.0 in 2022 Q1 compared to 2021 Q4.[109]
Total fertility rates from 1800 to 2020
The total fertility rate is the number of children born per woman. Sources: Ansley J. Coale, Zelnik and National Center for Health Statistics.[110]
| Years | 1800 | 1810 | 1820 | 1830 | 1840 | 1850 | 1860 | 1870 | 1880 | 1890 | 1900[110] |
|---|---|---|---|---|---|---|---|---|---|---|---|
| Total Fertility Rate in the United States | 7.0 | 6.9 | 6.7 | 6.6 | 6.1 | 5.4 | 5.2 | 4.6 | 4.2 | 3.9 | 3.6 |
| Years | 1910 | 1920 | 1930 | 1940 | 1950 | 1960 | 1970 | 1980 | 1990 | 2000 | 2010[110] | 2020 |
|---|---|---|---|---|---|---|---|---|---|---|---|---|
| Total Fertility Rate in the United States | 3.4 | 3.2 | 2.5 | 2.2 | 3.0 | 3.5 | 2.5 | 1.8 | 2.08 | 2.06 | 1.93 | 1.64 |
The U.S. total fertility rate as of 2020 is 1.641[81]
- 1.55 for non-Hispanic whites[81]
- 1.71 for non-Hispanic Blacks[81]
- 1.65 for Native Americans (including Hispanics)
- 1.53 for Asian Americans (including Hispanics)
Other:[46]
(Note that ≈95% of Hispanics are included as "white Hispanics" by CDC, which does not recognize the Census's "Some other race" category and counts people in that category as white.)
Source: National Vital statistics report based on 2010 US Census data[111]
Total fertility rates by state
Births and fertility by race
A total of 3,659,289 babies were born in 2021, a 1% increase from 2020. Additionally, researchers also looked at births by race and found that White and Hispanic women each saw the number of births increase by about 2% from 2020 to 2021. Meanwhile, Black and Asian women saw the number of births decline by 2.4% and 2.5%, respectively, over the same period, while American Indian/Alaskan Native women saw their numbers fall by 3.2%.[112] It also marks the first rise in births since 2014. Prior to this report, the total number of births had been decreasing by an average of 2% per year.[112] However, the total fertility rate (the number of births that the average women have over their lifetimes) was 1.6635 births per every woman. This is still below the replacement level, the level a population needs to replace itself, which is, at least, 2.1 births per woman.[112]
| General Fertility Rate: 15–44 years |
2020 Q1 | 2020 Q2 | 2020 Q3 | 2020 Q4 | 2021 Q1 | 2021 Q2 | 2021 Q3 | 2021 Q4 | 2022 Q1 | 2022 Q2 | 2022 Q3 |
|---|---|---|---|---|---|---|---|---|---|---|---|
| All races and origins | 58.1 | 57.6 | 56.8 | 56.0 | 55.0 | 55.2 | 55.6 | 56.3 | 56.6 | 56.4 | 56.2 |
| Hispanic | 65.2 | 64.7 | 63.9 | 63.1 | 61.5 | 61.7 | 62.2 | 63.4 | 64.8 | 65.1 | 65.7 |
| Non-Hispanic Black | 61.3 | 61.0 | 60.1 | 59.2 | 57.7 | 57.3 | 57.3 | 57.4 | 57.5 | 57.2 | 56.6 |
| Non-Hispanic White | 55.2 | 54.7 | 54.0 | 53.2 | 52.7 | 53.1 | 53.6 | 54.4 | 54.3 | 53.7 | 53.2 |
| Year | Total | Non-Hispanic White | Non-Hispanic Black | Hispanic | Non-Hispanic Asian | Non-Hispanic American Indian/Alaskan Native | Non-Hispanic Native Hawaiian | Multiracial |
|---|---|---|---|---|---|---|---|---|
| 2021 | 3,664,292 (TFR: 1.664) | 1,887,656 (TFR: 1.598) | 517,889 (TFR: 1.675) | 885,916 (TFR: 1.899) | 213,813 (TFR: 1.351) | 26,124 (TFR: 1.477) | 9,531 (TFR: 2.131) | 86,982 (TFR: 1.52) |
| 2020 | 3,613,647 (TFR: 1.641) | 1,843,432 (TFR: 1.551) | 529,811 (TFR: 1.713) | 866,713 (TFR: 1.879) | 219,068 (TFR: 1.379) | 26,813 (TFR: 1.520) | 9,626 (TFR: 2.134) | |
| 2019 | 3,747,540(TRF: 1.706 | 1,915,912 (TFR: 1.610) | 548,075 (TFR: 1.775) | 886,467 (TFR: 1.940) | 238,769 (TFR: 1.511) | 28,450 (TFR: 1.611) | 9.770 (TFR: 2,178) |
| Race and Hispanic origin of mother and year | January–June | January | February | March | April | May | June | Total pop.'s percent (January–June) |
|---|---|---|---|---|---|---|---|---|
| Non-Hispanic White (2019) | 937,741 | 156,819 | 142,992 | 157,502 | 156,516 | 165,587 | 158,325 | 51.67% |
| Non-Hispanic White (2020) | 916,986 | 152,519 | 138,756 | 155,981 | 150,953 | 156,888 | 156,933 | 51.43% |
| Non-Hispanic White (2021) | 914,813 | 142,083 | 138,803 | 159,055 | 153,980 | 156,969 | 163,923 | 52.32% |
| Non-Hispanic Black (2019) | 262,114 | 47,486 | 41,497 | 43,583 | 42,151 | 44,584 | 42,813 | 14.45% |
| Non-Hispanic Black (2020) | 259,759 | 46,356 | 40,587 | 43,591 | 41,395 | 42,999 | 43,381 | 14.57% |
| Non-Hispanic Black (2021) | 245,753 | 41,310 | 38,628 | 41,952 | 39,810 | 40,936 | 43,117 | 14.05% |
| Non-Hispanic American Indian or Alaska native (2019) | 14,013 | 2,525 | 2,182 | 2,332 | 2,293 | 2,382 | 2,299 | 0.77% |
| Non-Hispanic American Indian or Alaska native (2020) | 13,234 | 2,292 | 1,977 | 2,213 | 2,195 | 2,240 | 2,246 | 0.74% |
| Non-Hispanic American Indian or Alaska native (2021) | 12,498 | 2,135 | 1,932 | 2,181 | 2,098 | 1,961 | 2,191 | 0.69% |
| Non-Hispanic Asian (2019) | 116,289 | 19,628 | 17,975 | 19,910 | 19,261 | 20,168 | 19,347 | 6.41% |
| Non-Hispanic Asian (2020) | 110,811 | 19,303 | 17,068 | 19,268 | 17,986 | 18,696 | 17,880 | 6.21% |
| Non-Hispanic Asian (2021) | 102,279 | 15,658 | 15,410 | 18,019 | 17,482 | 17,552 | 18,158 | 5.85% |
| Non-Hispanic Hawaiian or other Pacific Islander (2019) | 4,695 | 790 | 762 | 814 | 738 | 847 | 744 | 0.26% |
| Non-Hispanic Hawaiian or other Pacific Islander (2020) | 4,665 | 803 | 759 | 794 | 705 | 820 | 757 | 0.26% |
| Non-Hispanic Hawaiian or other Pacific Islander (2021) | 4,413 | 799 | 616 | 753 | 731 | 806 | 708 | 0.25% |
| Hispanic (of any race) (2019) | 421,991 | 73,742 | 65,667 | 70,442 | 68,517 | 72,747 | 70,876 | 23.26% |
| Hispanic (of any race) (2020) | 420,563 | 73,601 | 65,140 | 70,361 | 68,000 | 70,085 | 71,050 | 23.59% |
| Hispanic (of any race) (2021) | 409,941 | 65,687 | 61,961 | 70,060 | 68,202 | 70,722 | 73,309 | 23.44% |
| All races and origins (2019) | 1,814,497 | 310,872 | 279,963 | 304,237 | 298,947 | 316,386 | 304,092 | |
| All races and origins (2020) | 1,783,124 | 304,722 | 272,907 | 301,625 | 290,478 | 301,481 | 302,164 | |
| All races and origins (2021) | 1,748,768 | 276,980 | 266,107 | 302,137 | 292,454 | 299,308 | 311,782 |
| Race and Hispanic origin of mother and year | January–June | January | February | March | April | May | June |
|---|---|---|---|---|---|---|---|
| Non-Hispanic White (2019-2020) | -2 | -3 | -3 | -1 | -4 | -5 | -1 |
| Non-Hispanic White (2020-2021) | †0 | -7 | †0 | 2 | 2 | †0 | 4 |
| Non-Hispanic Black (2019-2020) | -1 | -2 | -2 | †0 | -2 | -4 | †1 |
| Non-Hispanic Black (2020-2021) | -5 | -11 | -5 | -4 | -4 | -5 | †-1 |
| Non-Hispanic American Indian or Alaska native (2019-2020) | -6 | -9 | -9 | †-5 | †-4 | -6 | †-2 |
| Non-Hispanic American Indian or Alaska native (2020-2021) | -6 | -7 | †-2 | †-1 | †-4 | -12 | †-2 |
| Non-Hispanic Asian (2019-2020) | -5 | †-2 | -5 | -3 | -7 | -7 | -8 |
| Non-Hispanic Asian (2020-2021) | -8 | -19 | -10 | -6 | -3 | -6 | †2 |
| Non-Hispanic Hawaiian or other Pacific Islander (2019-2020) | †-1 | †2 | †0 | †-2 | †-4 | †-3 | †2 |
| Non-Hispanic Hawaiian or other Pacific Islander (2020-2021) | 5 | †0 | -19 | †-5 | †4 | †-2 | †-6 |
| Hispanic (of any race) (2019-2020) | †0 | †0 | †-1 | †0 | †-1 | -4 | †0 |
| Hispanic (of any race) (2020-2021) | -3 | -11 | -5 | †0 | †0 | †1 | 3 |
| All races and origins (2019-2020) | -2 | -2 | -3 | -1 | -3 | -5 | -1 |
| All races and origins (2020-2021) | -2 | -9 | -2 | †0 | 1 | -1 | 3 |
U.S.-born residents
Note: Hispanics are counted both by their ethnicity and by their race, giving a higher overall number. Also note that growth arrows indicate an increase or decrease in the number of births, not in the fertility rate.[46][118][119][120]
| Race of mother | Number of births in 2016 |
% of all born |
TFR (2016) |
Number of births in 2017 |
% of all born |
TFR (2017) |
Number of births in 2018 |
% of all born |
TFR (2018) |
Number of births in 2019 |
% of all born |
TFR (2019) |
Number of births in 2020 |
% of all born |
TFR (2020) |
2020-2016
|
|---|---|---|---|---|---|---|---|---|---|---|---|---|---|---|---|---|
| White | 2,900,933 | 73.5% | 1.77 | 2,812,267 | 72.9% | 1.76 | 2,788,439 | 73.5% | 1.75 | |||||||
| > NH White | 2,056,332 | 52.1% | 1.719 | 1,992,461 | 51.7% | 1.666 | 1,956,413 | 51.6% | 1.640 | 1,915,912 | 51.1% | 1.611 | 1,843,432 | 51.0% | 1.552 | |
| Black | 623,886 | 15.8% | 1.90 | 626,027 | 16.2% | 1.92 | 600,933 | 15.8% | 1.87 | |||||||
| > NH Black | 558,622 | 14.2% | 1.832 | 560,715 | 14.5% | 1.824 | 552,029 | 14.6% | 1.792 | 548,075 | 14.6% | 1.776 | 529,811 | 14.7% | 1.714 | |
| NH Asian | 254,471 | 6.5% | 1.690 | 249,250 | 6.5% | 1.597 | 240,798 | 6.4% | 1.525 | 238,769 | 6.4% | 1.511 | 219,068 | 6.1% | 1.385 | |
| NH American Indian or Alaska native | 31,452 | 0.8% | 1.794 | 29,957 | 0.8% | 1.702 | 29,092 | 0.8% | 1.651 | 28,450 | 0.76% | 1.612 | 26,813 | 0.74% | 1.517 | |
| NH Hawaiian (incl. other Pacific Islander) | 9,342 | 0.2% | 2.076 | 9,426 | 0.2% | 2.085 | 9,476 | 0.3% | 2.106 | 9,770 | 0.26% | 2.178 | 9,626 | 0.26% | 2.142 | |
| Total | 3,945,875 | 100% | 1.820 | 3,855,500 | 100% | 1.765 | 3,791,712 | 100% | 1.729 | 3,747,540 | 100% | 1.706 | 3,613,647 | 100% | 1.641 |
Key:
- NH = Non-Hispanic.
- TFR = Total fertility rate (number of children born per woman).
- Growth arrows (
 /
/ ) indicate an increase or decrease in the number of births, not in the fertility rate, comparing to the previous year.
| Ethnicity of mother | Number of births in 2016 |
% of all born |
TFR (2016) |
Number of births in 2017 |
% of all born |
TFR (2017) |
Number of births in 2018 |
% of all born |
TFR (2018) |
Number of births in 2019 |
% of all born |
TFR (2019) |
Number of births in 2020 |
% of all born |
TFR (2020) |
2020-2016
|
|---|---|---|---|---|---|---|---|---|---|---|---|---|---|---|---|---|
| Non-Hispanic (of any race) | 3,027,428 | 2,956,736 | 2,905,502 | 2,861,073 | 2,746,933 | |||||||||||
| Hispanic (of any race) | 918,447 | 23.3% | 2.093 | 898,764 | 23.3% | 2.007 | 886,210 | 23.4% | 1.959 | 886,467 | 23.7% | 1.940 | 866,714 | 24.0% | 1.876 |
Percent of births to White Non-Hispanic women that were their 8th+ child, by U.S. state, in 2021
| State | Percent |
|---|---|
| New York | 2.21% |
| New Jersey | 1.7% |
| Wisconsin | 1.04% |
| Arkansas | 1.02% |
| Montana | 0.86% |
| Ohio | 0.85% |
| Iowa | 0.84% |
| Pennsylvania | 0.82% |
| Kansas | 0.76% |
| Kentucky | 0.76% |
| Utah | 0.75% |
| Minnesota | 0.75% |
| Indiana | 0.72% |
| Wyoming | 0.72% |
| Mississippi | 0.7% |
| Michigan | 0.7% |
| Idaho | 0.65% |
| West Virginia | 0.64% |
| Arizona | 0.62% |
| North Dakota | 0.59% |
| South Dakota | 0.54% |
| Arkansas | 0.51% |
| New Mexico | 0.50% |
| Maryland | 0.49% |
| Oregon | 0.46% |
| Michigan | 0.44% |
| Oklahoma | 0.44% |
| Florida | 0.43% |
| Tennessee | 0.42% |
| Virginia | 0.41% |
| Illinois | 0.40% |
| Nevada | 0.40% |
| West Virginia | 0.39% |
| Delaware | 0.38% |
| Georgia | 0.36% |
| Nebraska | 0.36% |
| Texas | 0.33% |
| Alabama | 0.33% |
| Missouri | 0.32% |
| Vermont | 0.31% |
| South Carolina | 0.30% |
| California | 0.29% |
| Colorado | 0.29% |
| North Carolina | 0.25% |
| Alaska | 0.25% |
| Connecticut | 0.20% |
| New Hampshire | 0.19% |
| Massachusetts | 0.17% |
Mother's mean age at first birth

- 27.1 years (2020 est.)[81]
Life expectancy


According to the Centers for Disease Control and Prevention (CDC), average American life expectancy at birth was 78.4 years in 2023. This was a gain of 0.9 year from 77.5 years in 2022.[122] It was 76.4 years in 2021.[123]: 1
- Male: 75.8 years (2023), 74.8 years (2022), 73.5 years (2021)[123]: 1
- Female: 81.1 years (2023), 80.2 years (2022), 79.3 years (2021)[123]: 1
Starting in 1998, life expectancy in the U.S. fell behind that of other wealthy industrialized countries, and Americans' "health disadvantage" gap has been increasing ever since.[124] Average U.S. life expectancy in the United States has actually declined in four of the years following 2014 (the year when average U.S. life expectancy reached 78.9 years, its historical peak).[125] These declines were mostly reversed in both 2022 (+1.1 years) and 2023 (+0.9 year).[126] As of 2024, death rates among the youngest remain well higher than in peer nations.[126] In 2023, there lower death rates in each of the ten U.S. leading causes of death but gains in life expectancy were largely driven by "decreases in mortality due to COVID-19, heart disease, unintentional injuries, cancer and diabetes".[126][122]
From 2019 to 2020, the COVID-19 pandemic had contributed to approximately 61% of the decrease in life expectancy in the United States.[127] While increases in mortality from unintentional injuries, heart disease, homicide, and diabetes contributed to 11.7%, 5.8%, 2.9%, and 2.8% of the decrease in life expectancy from 2019 to 2020, respectively.[127] Life expectancy has also varied by racial and ethnic group, with Non-Hispanic Asians having the highest life expectancy and Non-Hispanic American Indians having the lowest.[127] In 2021, life expectancy at birth in the United States fell for the second year in a row, the first two-year drop since 1961–1963.[128]
| Race | Males 2021 |
Females 2021 |
Total 2021* |
Total 2020 |
Total 2019 |
2019 to 2021 |
|---|---|---|---|---|---|---|
| NH White | 73.7 | 79.2 | 76.4 | 77.4 | 78.8 | |
| NH Black | 66.7 | 74.8 | 70.8 | 71.5 | 74.8 | |
| NH Asian | 81.2 | 85.6 | 83.5 | 83.6 | 85.6 | |
| NH American Indian or Alaska Native | 61.5 | 69.2 | 65.2 | 67.1 | 71.8 | |
| Hispanic | 74.4 | 81.0 | 77.7 | 77.9 | 81.9 | |
| All origins and races | 73.2 | 79.1 | 76.1 | 77.0 | 78.8 |
NOTE: Life expectancy at birth data for 2021 are provisional.*
- NH = Non-Hispanic.
- LEB = Life expectancy at birth
- Growth arrows (/) indicate an increase or decrease in total life expectancy compared to years before.
Life expectancy at birth from 1901 to 2015
Life expectancy in the United States from 1901 to 2015. Source: Our World In Data and the United Nations.
1901–1950
| Years | 1901 | 1902 | 1903 | 1904 | 1905 | 1906 | 1907 | 1908 | 1909 | 1910[130] |
|---|---|---|---|---|---|---|---|---|---|---|
| Life expectancy in the United States | 49.3 | 50.5 | 50.6 | 49.6 | 50.3 | 50.2 | 50.1 | 51.9 | 52.8 | 51.8 |
| Years | 1911 | 1912 | 1913 | 1914 | 1915 | 1916 | 1917 | 1918 | 1919 | 1920[130] |
|---|---|---|---|---|---|---|---|---|---|---|
| Life expectancy in the United States | 53.4 | 54.1 | 53.5 | 54.6 | 55.1 | 54.2 | 54.0 | 47.0 | 55.3 | 55.4 |
| Years | 1921 | 1922 | 1923 | 1924 | 1925 | 1926 | 1927 | 1928 | 1929 | 1930[130] |
|---|---|---|---|---|---|---|---|---|---|---|
| Life expectancy in the United States | 58.2 | 58.1 | 57.5 | 58.5 | 58.5 | 57.9 | 59.4 | 58.3 | 58.5 | 59.6 |
| Years | 1931 | 1932 | 1933 | 1934 | 1935 | 1936 | 1937 | 1938 | 1939 | 1940[130] |
|---|---|---|---|---|---|---|---|---|---|---|
| Life expectancy in the United States | 60.3 | 61.0 | 60.9 | 60.2 | 60.9 | 60.4 | 61.1 | 62.4 | 63.1 | 63.2 |
| Years | 1941 | 1942 | 1943 | 1944 | 1945 | 1946 | 1947 | 1948 | 1949 | 1950[130] |
|---|---|---|---|---|---|---|---|---|---|---|
| Life expectancy in the United States | 63.8 | 64.6 | 64.3 | 65.1 | 65.6 | 66.3 | 66.7 | 67.3 | 67.6 | 68.1 |
1901–2015
| Period | Life expectancy in Years |
|---|---|
| 1901–1909 | 49.3 – 52.8 |
| 1910–1919 | 53.5 – 55.3[131] |
| 1920–1929 | 55.4 – 59.4 |
| 1930–1939 | 60.2 – 63.1 |
| 1940–1949 | 63.8 – 67.6 |
| 1950–1955 | 68.7 |
| 1955–1960 | 69.7 |
| 1960–1965 | 70.1 |
| 1965–1970 | 70.4 |
| 1970–1975 | 71.4 |
| 1975–1980 | 73.3 |
| 1980–1985 | 74.4 |
| 1985–1990 | 74.9 |
| 1990–1995 | 75.7 |
| 1995–2000 | 76.5 |
| 2000–2005 | 77.2 |
| 2005–2010 | 78.2 |
| 2010–2015 | 78.9 |
| 2015–2020 | 78.8 |
Source: UN World Population Prospects[132]
Life tables
| Females | Males | Total | ||||
|---|---|---|---|---|---|---|
| Age | Cohort | Life expectancy | Cohort | Life expectancy | Cohort | Life expectancy |
| 0 | 100,000 | 79.9 | 100,000 | 74.2 | 100,000 | 77.0 |
| 1 | 99,508 | 79.3 | 99,415 | 73.6 | 99,461 | 76.4 |
| 5 | 99,429 | 75.3 | 99,313 | 69.7 | 99,377 | 72.5 |
| 10 | 99,381 | 70.4 | 99,254 | 64.7 | 99,323 | 67.5 |
| 15 | 99,317 | 65.4 | 99,155 | 59.8 | 99,242 | 62.6 |
| 20 | 99,157 | 60.5 | 98,741 | 55.0 | 98,952 | 57.7 |
| 25 | 98,876 | 55.7 | 97,961 | 50.5 | 98,415 | 53.0 |
| 30 | 98,479 | 50.9 | 96,994 | 45.9 | 97,725 | 48.4 |
| 35 | 97,933 | 46.2 | 95,815 | 41.5 | 96,856 | 43.8 |
| 40 | 97,215 | 41.5 | 94,420 | 37.0 | 95,794 | 39.3 |
| 45 | 96,266 | 36.9 | 92,731 | 32.7 | 94,471 | 34.8 |
| 50 | 94,928 | 32.4 | 90,497 | 28.4 | 92,680 | 30.4 |
| 55 | 92,979 | 28.0 | 87,332 | 24.3 | 90,115 | 26.2 |
| 60 | 90,111 | 23.8 | 82,736 | 20.5 | 86,376 | 22.2 |
| 65 | 86,039 | 19.8 | 76,439 | 17.0 | 81,181 | 18.5 |
| 70 | 80,547 | 15.9 | 68,491 | 13.7 | 74,466 | 14.9 |
| 75 | 72,737 | 12.4 | 58,588 | 10.6 | 65,565 | 11.6 |
| 80 | 61,298 | 9.2 | 45,661 | 7.8 | 53,346 | 8.6 |
| 85 | 45,424 | 6.5 | 30,276 | 5.5 | 37,700 | 6.1 |
| 90 | 26,271 | 4.4 | 14,824 | 3.7 | 20,477 | 4.2 |
| 95 | 9,599 | 2.9 | 4,216 | 2.5 | 6,889 | 2.8 |
| 100 | 1,727 | 2.0 | 549 | 1.8 | 1,142 | 2.0 |
Population projections
Summarize
Perspective
The United States Census Bureau's 2017 projections were produced using the cohort-component method. In the cohort-component method, the components of population change (fertility, mortality, and net migration) are projected separately for each birth cohort (persons born in a given year). The base population is advanced each year by using projected survival rates and net international migration. Each year, a new birth cohort is added to the population by applying the projected fertility rates to the female population.
| Year | Population |
|---|---|
| 2017 | 325,511 |
| 2018 | 327,892 |
| 2019 | 330,269 |
| 2020 | 332,639 |
| 2021 | 334,998 |
| 2022 | 337,342 |
| 2023 | 339,665 |
| 2024 | 341,963 |
| 2025 | 344,234 |
| 2026 | 346,481 |
| 2027 | 348,695 |
| 2028 | 350,872 |
| 2029 | 353,008 |
| 2030 | 355,101 |
| 2031 | 357,147 |
| 2032 | 359,147 |
| 2033 | 361,099 |
| 2034 | 363,003 |
| 2035 | 364,862 |
| 2036 | 366,676 |
| 2037 | 368,448 |
| 2038 | 370,179 |
| 2039 | 371,871 |
| 2040 | 373,528 |
| 2041 | 375,152 |
| 2042 | 376,746 |
| 2043 | 378,314 |
| 2044 | 379,861 |
| 2045 | 381,390 |
| 2046 | 382,907 |
| 2047 | 384,415 |
| 2048 | 385,918 |
| 2049 | 387,419 |
| 2050 | 388,922 |
| 2051 | 390,431 |
| 2052 | 391,947 |
| 2053 | 393,473 |
| 2054 | 395,009 |
| 2055 | 396,557 |
| 2056 | 398,118 |
| 2057 | 399,691 |
| 2058 | 401,277 |
| 2059 | 402,874 |
| 2060 | 404,483 |
| states | 2030 | 2040 |
|---|---|---|
| 5,029,833 | 5,056,796 | |
| 792,188 | 819,954 | |
| 8,238,407 | 9,166,279 | |
| 3,155,798 | 3,217,535 | |
| 43,751,116 | 46,467,001 | |
| 6,766,983 | 7,692,907 | |
| 3,601,202 | 3,542,707 | |
| 1,082,192 | 1,164,344 | |
| 888,891 | 1,058,820 | |
| 25,372,664 | 28,886,983 | |
| 11,835,126 | 12,820,271 | |
| 1,548,831 | 1,619,703 | |
| 2,008,329 | 2,227,842 | |
| 12,709,901 | 12,397,564 | |
| 6,978,254 | 7,095,000 | |
| 3,317,412 | 3,392,783 | |
| 3,011,782 | 3,032,653 | |
| 4,648,190 | 4,714,761 | |
| 4,945,783 | 5,062,780 | |
| 1,344,841 | 1,326,159 | |
| 6,553,548 | 6,842,902 | |
| 7,420,882 | 7,742,628 | |
| 10,068,941 | 9,960,115 | |
| 6,070,551 | 6,364,886 | |
| 3,003,963 | 2,962,160 | |
| 6,318,126 | 6,359,970 | |
| 1,163,353 | 1,236,304 | |
| 2,089,841 | 2,190,918 | |
| 3,591,043 | 4,058,371 | |
| 1,385,799 | 1,393,451 | |
| 9,363,317 | 9,470,012 | |
| 2,132,823 | 2,127,318 | |
| 20,638,066 | 20,873,488 | |
| 11,673,849 | 12,658,927 | |
| 923,452 | 1,060,457 | |
| 11,837,405 | 11,751,540 | |
| 4,253,604 | 4,439,038 | |
| 4,738,074 | 5,164,041 | |
| 12,946,245 | 12,809,150 | |
| 1,068,663 | 1,055,318 | |
| 5,792,247 | 6,352,502 | |
| 973,361 | 1,043,032 | |
| 7,395,106 | 7,823,662 | |
| 34,738,482 | 40,015,913 | |
| 3,786,963 | 4,344,339 | |
| 617,969 | 601,865 | |
| 9,331,666 | 9,876,728 | |
| 8,746,493 | 9,776,126 | |
| 1,746,577 | 1,661,849 | |
| 5,971,617 | 5,997,137 | |
| 605,972 | 615,787 |
Race and ethnicity
Summarize
Perspective

Hispanics and Non-Hispanics in the United States (2020 United States census)[9]
- Non-Hispanic Americans (81.27%)
- Hispanic Americans (18.73%)
| Race / Ethnicity | Pop 2000[135] | Pop 2010[136] | Pop 2020[137] | % 2000 | % 2010 | % 2020 |
|---|---|---|---|---|---|---|
| White alone (NH) | 194,552,774 | 196,817,552 | 191,697,647 | 69.13% | 63.75% | 57.84% |
| Black or African American alone (NH) | 33,947,837 | 37,685,848 | 39,940,338 | 12.06% | 12.21% | 12.05% |
| Native American or Alaska Native alone (NH) | 2,068,883 | 2,247,098 | 2,251,699 | 0.74% | 0.73% | 0.68% |
| Asian alone (NH) | 10,123,169 | 14,465,124 | 19,618,719 | 3.60% | 4.69% | 5.92% |
| Pacific Islander alone (NH) | 353,509 | 481,576 | 622,018 | 0.13% | 0.16% | 0.19% |
| Some Other Race alone (NH) | 467,770 | 604,265 | 1,689,833 | 0.17% | 0.20% | 0.51% |
| Mixed Race/Multi-Racial (NH) | 4,602,146 | 5,966,481 | 13,548,983 | 1.64% | 1.93% | 4.09% |
| Hispanic or Latino (any race) | 35,305,818 | 50,477,594 | 62,080,044 | 12.55% | 16.35% | 18.73% |
| Total | 281,421,906 | 308,745,538 | 331,449,281 | 100.00% | 100.00% | 100.00% |
- Hispanic and Non-Hispanic racial groups (2020 census)
Racial Non-Hispanic groups in the United States (2020 United States census)[9]
| Non-Hispanic Americans in 2020 | |||||||
|---|---|---|---|---|---|---|---|
| Year | Population | % of Non-Hispanics |
% of the USA |
Percent Change | |||
| White (alone) | 191,697,647 | 71.16% | 57.83% | ||||
| African (alone) | 39,940,338 | 14.83% | 12.05% | ||||
| Asian (alone) | 19,618,719 | 7.28% | 5.92% | ||||
| Multiracial | 13,548,983 | 5.03% | 4.09% | ||||
| Native (alone) | 2,251,699 | 0.84% | 0.67% | ||||
| Pacific Islander (alone) | 622,018 | 0.23% | 0.19% | ||||
| Some Other Race (alone) | 1,689,833 | 0.63% | 0.51% | ||||
| Total | 269,369,237 | 100% | 81.27% | ||||
| Source: 2020 United States census[9] | |||||||
Racial Hispanic groups in the United States (2020 United States census)[9]
| Hispanic Americans in 2020 | |||||||
|---|---|---|---|---|---|---|---|
| Year | Population | % of Hispanics |
% of the USA |
Percent Change | |||
| Multiracial | 20,299,960 | 32.70% | 6.12% | ||||
| White (alone) | 12,579,626 | 20.26% | 3.80% | ||||
| Native (alone) | 1,475,436 | 2.38% | 0.45% | ||||
| African (alone) | 1,163,862 | 1.87% | 0.35% | ||||
| Asian (alone) | 267,330 | 0.43% | 0.08% | ||||
| Pacific Islander (alone) | 67,948 | 0.11% | 0.02% | ||||
| Some Other Race (alone) | 26,225,882 | 42.25% | 7.91% | ||||
| Total | 62,080,044 | 100% | 18.73% | ||||
| Source: 2020 United States census[9] | |||||||
Racial groups in the United States (2020 census) including racial identification of Hispanic[138]
- White Americans (61.6%)
- Black Americans (12.4%)
- Two or more races (10.2%)
- Some other race (8.4%)
- Asian Americans (6%)
- Native Americans (1.1%)
- Pacific Islander Americans (0.2%)
Racial and ethnic groups in the United States (2020 census)[139]
- White Americans* (57.8%)
- Hispanic Americans** (18.7%)
- Black Americans* (12.1%)
- Asian Americans* (5.9%)
- Two or more races* (4.1%)
- Native Americans* (0.7%)
- Some other race* (0.5%)
- Pacific Islander Americans* (0.2%)


Counties in the United States by percentage of the population which is non-Hispanic or Latino and/or non-white according to the U.S. Census Bureau American Community Survey 2013–2017 5-Year Estimates.[140] Counties with larger populations of Hispanic/Latino and/or non-white than the United States as a whole are in full purple.

States in the United States by Hispanic/Latino and/or non-white population according to the U.S. Census Bureau American Community Survey 2013–2017 5-Year Estimates.[140] States with larger Hispanic/Latino and/or non-white populations than the United States as a whole are in full purple.
Race

The United States Census Bureau collects racial data in accordance with guidelines provided by the U.S. Office of Management and Budget (OMB), and these data are based on self-identification. Many other countries count multiple races based on origin while America compiles multiple dozens of ethnicity groups into skin color grouping them together.[141] The racial classifications and definitions used by the U.S. Census Bureau are:[142]
- White: a person having origins in any of the original peoples of Europe, the Middle East, or North Africa.[143] It includes people who indicate their race as "White" or report entries such as English, Iranian (Azerbaijani, Kurd and Lur), Irish, German, Italian, Spanish, Portuguese, Lebanese, Arab, Moroccan, or Caucasian.
- Black or African American: a person having origins in any of the Black racial groups of Africa.[143] It includes people who indicate their race as "Black, African Am." or report entries such as African American, Kenyan, Nigerian, or Haitian.
- American Indian or Alaska Native: a person having origins in any of the original peoples of North and South America (including Central America) and who maintains tribal affiliation or community attachment.[143] This category includes people who indicate their race as "American Indian or Alaska Native" or report entries such as Navajo, Blackfeet, Inupiat, Yup'ik, Central American Indian groups, or South American Indian groups.
- Asian: a person having origins in any of the original peoples of East Asia, Southeast Asia, or the Indian subcontinent including, for example: Cambodia, China, India, Japan, Korea, Malaysia, Pakistan, the Philippine Islands, Thailand, and Vietnam.[143]
- Native Hawaiian or Other Pacific Islander: a person having origins in any of the original peoples of Hawaii, Guam, Samoa, or other Pacific Islands.[143]
- Some other race: includes all other responses not included in the "White", "Black or African American", "American Indian or Alaska Native", "Asian", and "Native Hawaiian or other Pacific Islander" racial categories described above includes Asians from West Asia or Russia (non-European Russia) and White Africans.
- Two or more races: people may choose to provide two or more races either by checking two or more race response check boxes, providing multiple responses, or some combination of check boxes and other responses.
Data about race and ethnicity are self-reported to the Census Bureau. Since the 2000 census, Congress has authorized people to identify themselves according to more than one racial classification by selecting more than one category. Only one ethnicity may be selected, however, because the Census Bureau recognizes only two ethnicities – "Hispanic or Latino" and "Not Hispanic or Latino" – which are mutually exclusive since you can be one or the other, but not both. The singular term Hispanic has been supplanted as a federally-recognized ethnicity by the combined "Hispanic or Latino," defined by the Census Bureau as a person of Cuban, Mexican, Puerto Rican, Cuban, South or Central American, or other Spanish culture or origin, regardless of race.[144]
According to the Census Bureau website, the racial composition of the United States in 2021 was:[145]
| Race (2021) | Population | Share of population |
|---|---|---|
| Total | 323,175,700 | 100.0% |
| (Non-Hispanic) White, percent | 187,925,100 | 58.2% |
| (Non-Hispanic) Black or African American, percent | 37,520,800 | 11.6% |
| Hispanic or Latino, percent | 61,241,900 | 19.0% |
| (Non-Hispanic) Asian, percent | 18,558,600 | 5.7% |
| (Non-Hispanic) American Indian and Alaska Native, percent | 1,667,100 | 0.5% |
| (Non-Hispanic) Native Hawaiian and Other Pacific Islander | 541,200 | 0.2% |
| Two or more Races, percent | 15,711,100 | 4.9% |
According to the 2022 American Community Survey, the racial composition of the United States in 2022 was:[146][147]
| Race | Population (2022 est.) | Share of total population |
|---|---|---|
| Total | 333,287,550 | 100% |
| One race | 291,505,262 | 87.5% |
| White | 202,889,020 | 60.2% |
| Black or African American | 40,603,656 | 12.2% |
| American Indian and Alaska Native | 3,205,331 | 1% |
| Asian | 19,696,980 | 5.9% |
| Native Hawaiian and Other Pacific Islander | 665,807 | 0.2% |
| Other races | 24,444,482 | 7.3% |
| Two or more races | 41,782,288 | 12.5% |
| White and Black or African American | 3,831,683 | 1.1% |
| White and American Indian and Alaska Native | 3,012,849 | 0.9% |
| White and Asian | 2,865,504 | 0.9% |
| Black or African American and American Indian and Alaska Native | 464,679 | 0.1% |
| White and Some Other Race | 26,317,236 | 7.9% |
| Hispanic or Latino (of any race) | 63,553,640 | 19.1% |
| Mexican | 37,414,772 | 11.2% |
| Central American | 6,531,267 | 2% |
| Puerto Rican | 5,905,178 | 1.8% |
| South American | 4,666,970 | 1.4% |
| Cuban | 2,435,573 | 0.7% |
| Dominican | 2,396,784 | 0.7% |
| Other Hispanic or Latino | 4,203,095 | 1.3% |
| Not Hispanic or Latino | 269,733,920 | 80.9% |
| White (non-Hispanic) | 192,153,070 | 57.7% |
| Black or African American (non-Hispanic) | 39,582,960 | 11.9% |
| American Indian and Alaska Native (non-Hispanic) | 1,750,489 | 0.5% |
| Asian (non-Hispanic) | 19,415,252 | 5.8% |
| Native Hawaiian and Other Pacific Islander (non-Hispanic) | 590,339 | 0.2% |
| Some other race (non-Hispanic) | 1,912,680 | 0.6% |
| Two or more races | 14,329,127 | 4.3% |
- United States in racial groups (of one race)


- United States in ethnic groups


- Distribution of Total Population by Race, 1900 to 2020 (in %)
Hispanic are shown like part of the races. Source: U.S. Census Bureau.[148][63]
| Years | 1900 | 1910 | 1920 | 1930 | 1940 | 1950 | 1960 | 1970 | 1980 | 1990 | 2000* | 2010* | 2020* |
|---|---|---|---|---|---|---|---|---|---|---|---|---|---|
| White | 87.9 | 88.9 | 89.7 | 89.8 | 89.8 | 89.5 | 88.6 | 87.5 | 83.0 | 80.3 | 75.1 | 72.4 | 61.6 |
| Black or African American | 11.6 | 10.7 | 9.9 | 9.7 | 9.8 | 10.0 | 10.5 | 11.1 | 11.7 | 12.1 | 12.3 | 12.6 | 12.4 |
| American Indian and Alaska Native | 0.8 | 0.8 | 0.9 | 0.9 | 1.1 | ||||||||
| Asian and Native Hawaiian and other Pacific Islander |
1.5 | 2.9 | 3.8 | 5.0 | 6.2 | ||||||||
| Some other race | 3.0 | 3.9 | 5.5 | 6.2 | 8.4 | ||||||||
| Two or more races | 2.4 | 2.9 | 10.2 | ||||||||||
| Sum (%) | 99.5 | 99.6 | 99.6 | 99.5 | 99.6 | 99.5 | 99.1 | 98.6 | 100 | 100 | 100 | 100 | 100 |
*Data are shown for the White, Black or African American, American Indian and Alaska Native, Asian and Native Hawaiian and Other Pacific Islander, and Some other race alone populations.
- Median age by each race alone and ethnicity, 2021
Source: United States Census Bureau.[149]
| Race | Median age (both sexes) (years) | Median age (male) (years) | Median age (female) (years) |
|---|---|---|---|
| Total Population | 38.8 | 37.7 | 39.8 |
| White (Non-Hispanic) | 43.8 | 42.6 | 45.0 |
| Black or African American (Non-Hispanic) | 34.5 | 32.9 | 36.1 |
| American Indian and Alaska Native (Non-Hispanic) | 32.1 | 31.8 | 32.5 |
| Asian (Non-Hispanic) | 37.7 | 36.5 | 38.9 |
| Native Hawaiian and Other Pacific Islander (Non-Hispanic) | 32.7 | 32.5 | 32.9 |
| Two or More Races | 29.5 (2020)[150] | 20.4 | 21.8 |
| Hispanic alone | 30.5 | 30.2 | 30.8 |
| Not Hispanic | 41.0 | 39.8 | 42.1 |
- Median age by race alone or in combination and ethnicity, 2021
Source: United States Census Bureau.[149]
| Race | Median age (both sexes) (years) | Median age (male) (years) | Median age (female) (years) |
|---|---|---|---|
| White (include White Hispanics) | 39.8 | 38.9 | 40.8 |
| Black or African American | 32.7 | 31.2 | 34.2 |
| American Indian and Alaska Native | 31.6 | 30.9 | 32.2 |
| Asian | 35.4 | 34.1 | 36.6 |
| Native Hawaiian and Other Pacific Islander | 29.8 | 29.3 | 30.3 |
| White (excludes White Hispanics) | 42.8 | 41.7 | 44.0 |
| Race/ethnicity | White | Black or African American | Hispanic | Asian | American Indian and Alaska Native | Native Hawaiian and Pacific Islander | Multiracial |
|---|---|---|---|---|---|---|---|
| Most common age | 58 yo | 27 yo | 11 yo | 29 yo | 26 yo | 28 yo | 3 yo |
| State or territory | Population
(2015 est.) |
White | Black or
African American |
American Indian
and Alaska Native |
Asian | Native Hawaiian and
Other Pacific Islander |
Some other race | Two or more races |
|---|---|---|---|---|---|---|---|---|
| Alabama | 4,830,620 | 68.8% | 26.4% | 0.5% | 1.2% | 0.1% | 1.3% | 1.7% |
| Alaska | 733,375 | 66.0% | 3.4% | 13.8% | 5.9% | 1.2% | 1.3% | 8.4% |
| Arizona | 6,641,928 | 78.4% | 4.2% | 4.4% | 3.0% | 0.2% | 6.5% | 3.2% |
| Arkansas | 2,958,208 | 78.0% | 15.5% | 0.6% | 1.4% | 0.2% | 2.1% | 2.1% |
| California | 38,421,464 | 61.8% | 5.9% | 0.7% | 13.7% | 0.4% | 12.9% | 4.5% |
| Colorado | 5,278,906 | 84.2% | 4.0% | 0.9% | 2.9% | 0.1% | 4.3% | 3.5% |
| Connecticut | 3,593,222 | 77.3% | 10.3% | 0.2% | 4.2% | 0.0% | 5.1% | 2.8% |
| Delaware | 926,454 | 69.4% | 21.6% | 0.3% | 3.6% | 0.0% | 2.3% | 2.7% |
| District of Columbia | 647,484 | 40.2% | 48.9% | 0.3% | 3.7% | 0.0% | 4.2% | 2.7% |
| Florida | 19,645,772 | 76.0% | 16.1% | 0.3% | 2.6% | 0.1% | 2.5% | 2.4% |
| Georgia | 10,006,693 | 60.2% | 30.9% | 0.3% | 3.6% | 0.0% | 2.8% | 2.1% |
| Hawaii | 1,406,299 | 25.4% | 2.0% | 0.2% | 37.7% | 9.9% | 1.1% | 23.7% |
| Idaho | 1,616,547 | 91.7% | 0.6% | 1.3% | 1.3% | 0.1% | 2.4% | 2.6% |
| Illinois | 12,873,761 | 72.3% | 14.3% | 0.2% | 5.0% | 0.0% | 5.8% | 2.2% |
| Indiana | 6,568,645 | 84.2% | 9.2% | 0.2% | 1.9% | 0.0% | 2.3% | 2.2% |
| Iowa | 3,093,526 | 91.2% | 3.2% | 0.3% | 2.0% | 0.1% | 1.3% | 2.0% |
| Kansas | 2,892,987 | 85.2% | 5.8% | 0.8% | 2.6% | 0.1% | 2.2% | 3.3% |
| Kentucky | 4,397,353 | 87.6% | 7.9% | 0.2% | 1.3% | 0.0% | 0.9% | 2.1% |
| Louisiana | 4,625,253 | 62.8% | 32.1% | 0.6% | 1.7% | 0.0% | 1.0% | 1.8% |
| Maine | 1,329,100 | 95.0% | 1.1% | 0.6% | 1.1% | 0.0% | 0.2% | 2.0% |
| Maryland | 5,930,538 | 57.6% | 29.5% | 0.3% | 6.0% | 0.0% | 3.6% | 3.0% |
| Massachusetts | 6,705,586 | 79.6% | 7.1% | 0.2% | 6.0% | 0.0% | 4.2% | 2.9% |
| Michigan | 9,900,571 | 79.0% | 14.0% | 0.5% | 2.7% | 0.0% | 1.1% | 2.6% |
| Minnesota | 5,419,171 | 84.8% | 5.5% | 1.0% | 4.4% | 0.0% | 1.5% | 2.7% |
| Mississippi | 2,988,081 | 59.2% | 37.4% | 0.4% | 1.0% | 0.0% | 0.9% | 1.2% |
| Missouri | 6,045,448 | 82.6% | 11.5% | 0.4% | 1.8% | 0.1% | 1.1% | 2.4% |
| Montana | 1,014,699 | 89.2% | 0.5% | 6.5% | 0.7% | 0.1% | 0.5% | 2.5% |
| Nebraska | 1,869,365 | 88.1% | 4.7% | 0.9% | 2.0% | 0.1% | 1.9% | 2.2% |
| Nevada | 2,798,636 | 69.0% | 8.4% | 1.1% | 7.7% | 0.6% | 8.8% | 4.4% |
| New Hampshire | 1,324,201 | 93.7% | 1.3% | 0.2% | 2.4% | 0.0% | 0.5% | 1.8% |
| New Jersey | 8,904,413 | 68.3% | 13.5% | 0.2% | 9.0% | 0.0% | 6.4% | 2.5% |
| New Mexico | 2,084,117 | 73.2% | 2.1% | 9.1% | 1.4% | 0.1% | 10.9% | 3.3% |
| New York | 19,673,174 | 64.6% | 15.6% | 0.4% | 8.0% | 0.0% | 8.6% | 2.9% |
| North Carolina | 9,845,333 | 69.5% | 21.5% | 1.2% | 2.5% | 0.1% | 3.0% | 2.4% |
| North Dakota | 721,640 | 88.7% | 1.6% | 5.3% | 1.2% | 0.0% | 0.8% | 2.2% |
| Ohio | 11,575,977 | 82.4% | 12.2% | 0.2% | 1.9% | 0.0% | 0.8% | 2.5% |
| Oklahoma | 3,849,733 | 73.1% | 7.2% | 7.3% | 1.9% | 0.1% | 2.6% | 7.8% |
| Oregon | 3,939,233 | 85.1% | 1.8% | 1.2% | 4.0% | 0.4% | 3.4% | 4.1% |
| Pennsylvania | 12,779,559 | 81.6% | 11.0% | 0.2% | 3.1% | 0.0% | 2.0% | 2.1% |
| Puerto Rico | 3,583,073 | 69.7% | 8.4% | 0.3% | 0.3% | 0.0% | 12.0% | 9.3% |
| Rhode Island | 1,053,661 | 81.1% | 6.5% | 0.5% | 3.2% | 0.0% | 5.8% | 2.8% |
| South Carolina | 4,777,576 | 67.2% | 27.5% | 0.3% | 1.4% | 0.1% | 1.5% | 2.0% |
| South Dakota | 843,190 | 85.0% | 1.6% | 8.6% | 1.2% | 0.0% | 0.9% | 2.6% |
| Tennessee | 6,499,615 | 77.8% | 16.8% | 0.3% | 1.6% | 0.1% | 1.5% | 2.0% |
| Texas | 26,538,614 | 74.9% | 11.9% | 0.5% | 4.2% | 0.1% | 6.0% | 2.5% |
| Utah | 2,903,379 | 87.6% | 1.1% | 1.1% | 2.2% | 0.9% | 4.5% | 2.6% |
| Vermont | 626,604 | 94.9% | 1.1% | 0.3% | 1.4% | 0.0% | 0.3% | 1.9% |
| Virginia | 8,256,630 | 69.0% | 19.2% | 0.3% | 6.0% | 0.1% | 2.2% | 3.2% |
| Washington | 6,985,464 | 77.8% | 3.6% | 1.3% | 7.7% | 0.6% | 3.8% | 5.2% |
| West Virginia | 1,851,420 | 93.6% | 3.3% | 0.2% | 0.7% | 0.0% | 0.2% | 2.0% |
| Wisconsin | 5,742,117 | 86.5% | 6.3% | 0.9% | 2.5% | 0.0% | 1.7% | 2.1% |
| Wyoming | 579,679 | 91.0% | 1.1% | 2.2% | 0.9% | 0.1% | 2.1% | 2.7% |
| State or territory | Population (2022 est.) | White (Non Hispanic) | Black or African American (Non Hispanic) | American Indian and Alaska Native (Non Hispanic) | Asian (Non Hispanic) | Native Hawaiian and Other Pacific Islander (Non Hispanic) | Some other race (Non Hispanic) | Two or more races (Non Hispanic) | Hispanic or Latino |
|---|---|---|---|---|---|---|---|---|---|
| Alabama | 5,074,296 | 64.1% | 25.6% | 0.3% | 1.5% | 0.0% | 0.4% | 3.3% | 4.9% |
| Alaska | 733,583 | 57.4% | 2.8% | 12.7% | 6.1% | 2.0% | 0.5% | 10.7% | 7.7% |
| Arizona | 7,359,197 | 51.8% | 4.4% | 3.3% | 3.5% | 0.2% | 0.5% | 3.9% | 32.5% |
| Arkansas | 3,045,637 | 67.5% | 14.3% | 0.4% | 1.6% | 0.5% | 0.4% | 7.0% | 8.4% |
| California | 39,029,344 | 33.7% | 5.2% | 0.3% | 15.3% | 0.3% | 0.6% | 4.3% | 40.3% |
| Colorado | 5,839,926 | 65.0% | 3.8% | 0.4% | 3.1% | 0.1% | 0.5% | 4.6% | 22.5% |
| Connecticut | 3,626,205 | 62.0% | 9.8% | 0.1% | 4.8% | 0.0% | 0.8% | 4.4% | 18.2% |
| Delaware | 1,018,396 | 58.9% | 21.6% | 0.1% | 4.1% | 0.0% | 0.5% | 4.5% | 10.3% |
| District of Columbia | 671,803 | 36.7% | 41.7% | 0.2% | 4.1% | 0.1% | 0.6% | 5.0% | 11.7% |
| Florida | 22,244,824 | 50.8% | 14.6% | 0.1% | 2.8% | 0.0% | 0.7% | 3.9% | 27.1% |
| Georgia | 10,912,876 | 49.6% | 30.7% | 0.1% | 4.4% | 0.1% | 0.5% | 4.2% | 10.4% |
| Hawaii | 1,440,196 | 20.7% | 1.6% | 0.1% | 34.6% | 9.3% | 0.4% | 22.1% | 11.1% |
| Idaho | 1,939,033 | 79.0% | 0.6% | 0.8% | 1.3% | 0.2% | 0.5% | 4.2% | 13.5% |
| Illinois | 12,582,032 | 58.5% | 13.2% | 0.1% | 5.9% | 0.0% | 0.4% | 3.6% | 18.3% |
| Indiana | 6,833,037 | 76.0% | 9.2% | 0.1% | 2.5% | 0.0% | 0.5% | 3.9% | 7.8% |
| Iowa | 3,200,517 | 82.8% | 3.7% | 0.2% | 2.3% | 0.3% | 0.3% | 3.6% | 6.8% |
| Kansas | 2,937,150 | 73.1% | 5.0% | 0.4% | 2.9% | 0.1% | 0.5% | 4.9% | 13.0% |
| Kentucky | 4,512,310 | 82.2% | 7.6% | 0.1% | 1.4% | 0.1% | 0.3% | 4.2% | 4.2% |
| Louisiana | 4,590,241 | 56.7% | 30.9% | 0.4% | 1.8% | 0.0% | 0.4% | 4.0% | 5.7% |
| Maine | 1,385,340 | 90.2% | 1.6% | 0.4% | 1.2% | 0.0% | 0.4% | 4.2% | 2.1% |
| Maryland | 6,164,660 | 47.1% | 29.2% | 0.1% | 6.5% | 0.0% | 0.8% | 4.7% | 11.4% |
| Massachusetts | 6,981,974 | 67.0% | 6.6% | 0.1% | 7.2% | 0.0% | 1.2% | 4.9% | 13.0% |
| Michigan | 10,034,118 | 72.6% | 13.1% | 0.3% | 3.3% | 0.0% | 0.5% | 4.5% | 5.7% |
| Minnesota | 5,717,184 | 76.2% | 6.9% | 0.7% | 5.2% | 0.0% | 0.6% | 4.5% | 5.8% |
| Mississippi | 2,940,057 | 55.3% | 36.5% | 0.4% | 0.9% | 0.0% | 0.3% | 3.3% | 3.3% |
| Missouri | 6,177,957 | 76.6% | 10.6% | 0.2% | 2.1% | 0.1% | 0.4% | 5.1% | 4.7% |
| Montana | 1,122,867 | 83.5% | 0.3% | 5.2% | 0.7% | 0.1% | 0.8% | 4.9% | 4.4% |
| Nebraska | 1,967,923 | 75.8% | 4.5% | 0.5% | 2.5% | 0.1% | 0.4% | 3.9% | 12.3% |
| Nevada | 3,177,772 | 44.4% | 9.0% | 0.6% | 8.8% | 0.6% | 0.6% | 5.7% | 30.3% |
| New Hampshire | 1,395,231 | 86.6% | 1.3% | 0.1% | 2.6% | 0.1% | 0.5% | 4.4% | 4.5% |
| New Jersey | 9,261,699 | 51.5% | 12.0% | 0.1% | 10.0% | 0.0% | 1.0% | 3.6% | 21.9% |
| New Mexico | 2,113,344 | 34.8% | 1.7% | 8.1% | 1.7% | 0.0% | 0.4% | 3.1% | 50.2% |
| New York | 19,677,152 | 52.9% | 13.4% | 0.2% | 9.0% | 0.0% | 1.1% | 3.7% | 19.7% |
| North Carolina | 10,698,973 | 60.7% | 20.1% | 0.9% | 3.2% | 0.1% | 0.5% | 4.1% | 10.4% |
| North Dakota | 779,261 | 82.0% | 3.3% | 4.3% | 1.6% | 0.4% | 0.4% | 3.7% | 4.4% |
| Ohio | 11,756,058 | 76.1% | 11.9% | 0.1% | 2.5% | 0.0% | 0.4% | 4.5% | 4.4% |
| Oklahoma | 4,019,800 | 62.6% | 6.7% | 6.8% | 2.3% | 0.1% | 0.3% | 9.1% | 12.1% |
| Oregon | 4,240,137 | 71.6% | 1.8% | 0.7% | 4.5% | 0.4% | 0.6% | 6.0% | 14.4% |
| Pennsylvania | 12,972,008 | 73.1% | 10.1% | 0.1% | 3.8% | 0.0% | 0.5% | 3.8% | 8.6% |
| Puerto Rico | 3,221,789 | 0.6% | 0.1% | 0.0% | 0.1% | 0% | 0.1% | 0.1% | 99.0% |
| Rhode Island | 1,093,734 | 68.2% | 4.7% | 0.1% | 3.4% | 0.0% | 0.9% | 5.2% | 17.6% |
| South Carolina | 5,282,634 | 62.5% | 24.9% | 0.2% | 1.7% | 0.0% | 0.6% | 3.6% | 6.5% |
| South Dakota | 909,824 | 79.9% | 2.0% | 7.1% | 1.4% | 0.1% | 0.3% | 4.5% | 4.7% |
| Tennessee | 7,051,339 | 71.9% | 15.5% | 0.1% | 1.9% | 0.1% | 0.4% | 4.0% | 6.3% |
| Texas | 30,029,572 | 38.9% | 11.7% | 0.2% | 5.4% | 0.1% | 0.4% | 3.2% | 40.2% |
| Utah | 3,380,800 | 75.6% | 1.0% | 0.7% | 2.4% | 1.1% | 0.4% | 3.5% | 15.1% |
| Vermont | 647,064 | 90.2% | 1.0% | 0.2% | 1.8% | 0.0% | 0.4% | 4.2% | 2.3% |
| Virginia | 8,683,619 | 58.7% | 18.4% | 0.1% | 6.9% | 0.1% | 0.7% | 4.7% | 10.4% |
| Washington | 7,785,786 | 63.5% | 3.8% | 0.9% | 9.7% | 0.7% | 0.7% | 6.7% | 14.0% |
| West Virginia | 1,775,156 | 89.8% | 3.3% | 0.1% | 0.7% | 0.0% | 0.3% | 3.8% | 1.9% |
| Wisconsin | 5,892,539 | 79.0% | 5.9% | 0.6% | 2.9% | 0.0% | 0.3% | 3.7% | 7.6% |
| Wyoming | 581,381 | 81.4% | 0.7% | 1.6% | 0.6% | 0.1% | 0.9% | 3.9% | 10.8% |
| Territory | Population (2010 est.) | White | Black or African American | American Indian and Alaska Native | Asian | Native Hawaiian and Other Pacific Islander | Some other race | Two or more races |
|---|---|---|---|---|---|---|---|---|
| American Samoa | 55,519 | 0.9% | 0.0% | — | 3.6% | 92.6% | 0.1% | 2.7% |
| Guam | 159,358 | 7.1% | 1.0% | — | 32.2% | 49.3% | 0.3% | 9.4% |
| Northern Mariana Islands | 53,883 | 2.1% | 0.1% | — | 49.9% | 34.9% | 0.2% | 12.7% |
| U.S. Virgin Islands | 106,405 | 15.6% | 76.0% | — | 1.4% | 0.0% | 4.9% | 2.1% |
| Year | White Alone | Black Alone | Hispanic | Native American Alone | Asian Alone | Pacific Islander Alone |
|---|---|---|---|---|---|---|
| 2018 | 51.6% | 14.6% | 23.4% | 0.8% | 6.4% | 0.3% |
| Year | White | Black or African American | Hispanic | Asian | Pacific Islander | American Indian Alaska Native | Two or more races |
|---|---|---|---|---|---|---|---|
| 2000 | 60% | 15% | 16% | 3% | — | 1% | 2% |
| 2017 | 51% | 14% | 25% | 5% | — | 1% | 4% |
| Year | White | Black or African American | Hispanic | Asian | Pacific Islander | American Indian Alaska Native | Two or more races |
|---|---|---|---|---|---|---|---|
| 2000 | 62% | 14% | 18% | 4% | — | 1% | 1% |
| 2017 | 54% | 14% | 22% | 6% | — | 1% | 3% |
| Age group | 85+ | 80–84 | 75–79 | 70–74 | 65–69 | 60–64 | 55–59 | 50–54 | 45–49 | 40–44 | 35–39 | 30–34 | 25–29 | 20–24 | 15–19 | 10–14 | 5–9 | <5 |
|---|---|---|---|---|---|---|---|---|---|---|---|---|---|---|---|---|---|---|
| non-Hispanic white | 83% | 81% | 79% | 78% | 77% | 74% | 72% | 69% | 65% | 61% | 58% | 57% | 57% | 56% | 55% | 54% | 52% | 50% |
| Minority | 17% | 19% | 21% | 22% | 23% | 26% | 28% | 31% | 35% | 39% | 42% | 43% | 43% | 44% | 45% | 46% | 48% | 50% |
Hispanic or Latino origin

The U.S. Office of Management and Budget (OMB) defines "Hispanic or Latino" as a person of Cuban, Mexican, Puerto Rican, Dominican, South or Central American, or other Spanish culture or origin regardless of race. People who identify with the terms "Hispanic" or "Latino" are those who classify themselves in one of the specific Hispanic or Latino categories listed on the decennial census questionnaire and various Census Bureau survey questionnaires – "Mexican, Mexican Am., Chicano" or "Puerto Rican" or "Cuban" – as well as those who indicate that they are "another Hispanic, Latino, or Spanish origin."[161] People who identify their origin as Hispanic or Latino may be of any race.[142]
| Hispanic or Latino and Race | Population (2022 est.) | Percentage of total population |
|---|---|---|
| United States population | 333,287,550 | 100% |
| Hispanic or Latino (of any race) | 63,553,640 | 19.1% |
| White | 10,735,941 | 3.2% |
| Black or African American | 1,020,695 | 0.3% |
| American Indian and Alaska Native | 1,454,842 | 0.4% |
| Asian | 181,231 | 0.1% |
| Native Hawaiian and Other Pacific Islander | 75,468 | 0.0% |
| Some other race | 22,531,802 | 6.8% |
| Two or more races | 27,453,162 | 8.2% |
| Not Hispanic or Latino | 269,733,920 | 80.9% |
- Population distribution by Hispanic origin 1970–2020 (in %)
Source: U.S. Census Bureau, decennial census of population, 1970 (5-percent sample), 1980 to 2020.[63]
| Years | 1970 | 1980 | 1990 | 2000 | 2010 | 2020 |
|---|---|---|---|---|---|---|
| Not Hispanic or Latino | 95.5 | 93.6 | 91.0 | 87.5 | 83.7 | 81.3 |
| Hispanic or Latino | 4.5 | 6.4 | 9.0 | 12.5 | 16.3 | 18.7 |
| Total (%) | 100 | 100 | 100 | 100 | 100 | 100 |
- Median age of each race alone, 2021 (Hispanic)
Source: United States Census Bureau.[149]
| Race | Median age (both sex) (years) | Median age (male) (years) | Median age (female) (years) |
|---|---|---|---|
| Total (Hispanic) | 30.5 | 30.2 | 30.8 |
| White | 31.2 | 30.9 | 31.5 |
| Black or African American | 27.1 | 26.1 | 28.2 |
| American Indian and Alaska Native | 28.4 | 29.0 | 27.8 |
| Asian | 26.9 | 26.2 | 27.7 |
| Native Hawaiian and Other Pacific Islander | 27.8 | 28.3 | 27.2 |
| Two or More Races | 21.5 | 21.1 | 22.0 |
- Median age of each race alone or in combination, 2021 (Hispanic)
Source: United States Census Bureau.[149]
| Race | Median age (both sex) (years) | Median age (male) (years) | Median age (female) (years) |
|---|---|---|---|
| White | 30.9 | 30.6 | 31.1 |
| Black or African American | 25.3 | 24.3 | 26.3 |
| American Indian and Alaska Native | 27.6 | 27.8 | 27.3 |
| Asian | 23.0 | 22.3 | 23.7 |
| Native Hawaiian and Other Pacific Islander | 24.8 | 24.9 | 24.7 |
Note: Hispanic origin is considered an ethnicity, not a race. Hispanics may be of any race.
Indigenous peoples
As of 2020, there are 9,666,058 people identifying as American Indian and Alaska Native people in the United States, including those identifying with more than one race,[162] representing around 3% of the U.S. population. This number includes not only groups indigenous to the United States, but any Indigenous people of the Americas,[163] including Mesoamerican peoples such as the Maya, as well as Canadian and South American natives. In 2022, 634,503 Indigenous people in the United States identified with Central American Indigenous groups, 875,183 identified with the Indigenous people of Mexico, and 47,518 identified with Canadian First Nations.[164] Of the 3.2 million Americans who identified as American Indian or Alaska Native alone in 2022, around 45% were of Hispanic or Latino ethnicity,[165][166] with this number growing as increasing numbers of Indigenous people from Latin American countries immigrate to the US and more Latinos self-identify with indigenous heritage. Of groups Indigenous to the contiguous United States, the largest self-reported tribes are Cherokee (1,449,888), Navajo (434,910), Choctaw (295,373), Blackfeet (288,255), and Sioux (220,739). Additionally, 205,954 identify with an Alaska Native tribe. There are 573 federally recognized tribal governments[167] in the United States.[168]
The US Census Bureau classifies Native Hawaiians separately from American Indians and Alaska Natives, grouping them with Pacific Islanders instead. According to 2022 estimates, 714,847 Americans identified with Native Hawaiian ancestry.[169]
Other groups
There were 16.1 million veterans in 2022,[170] with only 6.2% of Americans having served in the Armed Forces.[171]
In 2010, The Washington Post estimated that there were 11 million undocumented immigrants in the country.[172] As of 2017, Pew Research reported that there an estimated 10.5 million undocumented immigrants in the U.S.[173]
In 2022, an estimated 1,849,176 adults were imprisoned in the US.[174]
Projections
| 2023 | 2060 | |
|---|---|---|
| White Americans1 | 75.5% | 72.3% |
| > Non-Hispanic Whites | 58.9% | 44.9% |
| Black Americans1 | 13.6% | 14.8% |
| Asian Americans1 | 6.3% | 9.4% |
| Multiracial Americans1 | 3.0% | 6.1% |
| Native Americans1 | 1.3% | 1.4% |
| Pacific Islanders1 | 0.3% | 0.4% |
| Hispanics/Latinos (of any race) | 19.1% | 26.9% |
| 1 Including Hispanics | ||
A report by the U.S. Census Bureau projects a decrease in the ratio of non-Hispanic Whites between 2023 and 2060, a decline from 58.9% of the population to 44.9%. Non-Hispanic Whites are projected to no longer make up a majority of the population by 2050, but will remain the largest single ethnic group. Non-Hispanic whites made up 85% of the population in 1960.[176]
While non-Hispanic whites are projected to become a minority, the total White population (including Hispanics), will remain a majority from 2023 to 2060, falling from 75.5% to 72.3% of the population who are white alone according to the projections.[177] However, these projections are not directly comparable to other Census Bureau data, as they are based on a modified race dataset,[178] which does not include the "some other race" category used in census surveys.[179] Individuals identifying as “some other race” alone or in combination made up 16.2% of the population in 2022,[180] and they are reclassified into recognized race categories in the dataset used for the projections.[181] As a result, there is a significant discrepancy between the share of the white alone population in 2023 according to the projections (75.5%), and the estimated share of white alone (60.9%), as reported by the American Community Survey in 2022.[182]
The report foresees the Hispanic or Latino population rising from 19.1% today to 26.9% by 2060, the Black percentage barely rising from 13.6% to 14.8%, and Asian Americans upping their 6.3% share to 9.4%. The United States had a population of 333 million people in July 2023, and is projected to reach 355 million by 2040 and 364 million in 2060.[183][184][185][186][187] It is further projected that all of the increase in population from 2023 to 2060 will be due to immigrants.
Of the nation's children in 2060, 64% are expected to be of a minority ethnicity, up from 51% today. Approximately 32% are projected to be Hispanic or Latino (up from 26% in 2023), and 36% are projected to be single-race, non-Hispanic Whites (down from 49% in 2023). Racial and ethnic minorities surpassed non-Hispanic whites as the largest group of U.S. children under 5 years old in 2015.[188]
The fastest growing racial group in America is Asian Americans with a growth rate of 35%, however the multi-racial mixed Asian group is growing even faster, with a growth rate of 55%. Multi-racial Asians are therefore the fastest growing demographic group in America.[33][32]
In 2020, it was reported that 51.0% of births were to non-Hispanic white mothers.[111] In 2021, the percentage increased to 51.5%.[111][189] However, by 2022 the rate of births to white mothers had declined by 3%, dropping to 50% of all total births. In the same period, the rate of births to Asian and Hispanic women increased by 2% and 6%, respectively.[35][34]
- Population pyramids of racial groups (of one race)


- Population pyramids of ethnic groups

 Non-Hispanic African Americans


- Pew Research Center projections
The United Nations projects a population of just over 400 million in 2060.[citation needed]
| 1960 | 2005 | 2050 | |
|---|---|---|---|
| White Americans | 85% | 67% | 47% |
| Hispanic Americans | 3.5% | 14% | 29% |
| Black Americans | 11% | 13% | 14% |
| Asian Americans | 0.6% | 5% | 9% |
| Note: All races modified and not Hispanic; American Indian/Alaska Native not shown. | |||
The country's racial profile will be vastly different, and although whites will remain the single largest ethnic group in the U.S., they will no longer be a majority excluding White Hispanics by 2055 according to Pew Research Center. Growth in the Hispanic and Asian populations is predicted to almost triple over the next 40 years. By 2055, the breakdown is estimated to be 48% non-Hispanic white, 24% Hispanic, 16% Black, and 14% Asian.[191]
As of 2015[update], 14% of the United States' population is foreign born, compared to just 5% in 1965. Nearly 39 million immigrants have come to the U.S. since 1965, with most coming from Asia and Latin America. The 2015 Census Report predicts that the percentage of the U.S. population that is foreign-born will continue to increase, reaching 19% by 2060. This increase in the foreign-born population will account for a large share of the overall population growth.[191]
The average person in the U.S. of 2060 is likely to be older than the average person of 2018 today, and it is projected that almost one in four people will be 65 or older.[191]
U.S. Census Census Bureau projections
- Percent minority 1970–2042 (2008 projections)
- [63]
| Years | 1970 | 1980 | 1990 | 2000 | 2010 | 2020 | 2030 | 2040 | 2042 |
|---|---|---|---|---|---|---|---|---|---|
| Percent minority (%) | 16.5 | 20.4 | 24.4 | 30.9 | 36.3 | 39.9 | 44.5 | 49.2 | 50.1 |
Note: "Minority" refers to people who reported their ethnicity and race as something other than non-Hispanic White alone in the decennial census.
- Total US population
Self-reported ancestry

This table displays all self-reported ancestries with over 50,000 members, alone or in combination, according to estimates from the 2022 American Community Survey. The total population of the US according to the survey was 333,287,550, and 251,732,240 people reported an ancestry. Of these, 175,054,020 reported a single ancestry, and 76,678,224 reported two or more ancestries.[193] Hispanic groups are not distinguished between total and partial ancestry:
| Ancestry[194][195][196][197] | Number in 2022 (Alone)[198] | Number as of 2022 (Alone or in any combination) | % Total |
|---|---|---|---|
| Black or African American
(Including Afro-Caribbean and sub-Saharan African) |
40,603,656 | 47,859,760 | 14.4% |
| German | 13,241,923 | 41,137,168 | 12.3% |
| Mexican | — | 37,414,772 | 11.2% |
| English | 12,331,696 | 31,380,620 | 9.4% |
| Irish | 8,649,243 | 30,655,612 | 9.2% |
| American
(Mostly old-stock white Americans of British descent) |
14,929,899 | 17,786,214 | 5.3% |
| Italian | 5,766,634 | 16,009,774 | 4.8% |
| Polish | 2,658,632 | 8,249,491 | 2.5% |
| French
(Not including French Canadian) |
1,360,631 | 6,310,548 | 1.9% |
| Puerto Rican | — | 5,905,178 | 1.8% |
| Chinese
(Not including Taiwanese) |
4,258,198 | 5,465,428 | 1.6% |
| Scottish | 1,555,579 | 5,352,344 | 1.6% |
| Indian | 4,534,339 | 4,946,306 | 1.5% |
| Broadly "European"
(No country specified) |
3,718,055 | 4,819,541 | 1.4% |
| Filipino | 2,969,978 | 4,466,918 | 1.3% |
| Swedish | 740,478 | 3,936,772 | 1.2% |
| Norwegian | 1,224,373 | 3,317,462 | 1.0% |
| Dutch | 858,809 | 3,019,465 | 0.9% |
| Indigenous American
(No tribe specified) |
493,837 | 2,550,528 | 0.8% |
| Scotch-Irish | 940,337 | 2,524,746 | 0.8% |
| Salvadoran | — | 2,480,509 | 0.7% |
| Cuban | — | 2,435,573 | 0.7% |
| Dominican | — | 2,396,784 | 0.7% |
| Vietnamese | 1,887,550 | 2,301,868 | 0.7% |
| Other Hispanic or Latino
(Including Hispano, Californio, Tejano, Isleño, and unspecified Hispanic origins) |
— | 2,276,867 | 0.7% |
| Arab
(Including Lebanese (583,719), Egyptian (334,574), Syrian (203,282), Palestinian (171,969), Iraqi (164,851), Moroccan (140,196), Jordanian (86,926), and all other Arab ancestries) |
1,502,360 | 2,237,982 | 0.7% |
| Russian | 747,866 | 2,099,079 | 0.6% |
| Korean | 1,501,587 | 2,051,572 | 0.6% |
| Spanish
(Including responses of "Spaniard," "Spanish," and "Spanish American." Many Hispanos of New Mexico identify as Spanish/Spaniard) |
— | 1,926,228 | 0.6% |
| Guatemalan | — | 1,878,599 | 0.6% |
| Broadly “African”
(Not further specified) |
1,297,668 | 1,721,108 | 0.5% |
| French Canadian | 694,089 | 1,626,456 | 0.5% |
| Japanese | 717,413 | 1,587,040 | 0.5% |
| Welsh | 293,551 | 1,521,565 | 0.5% |
| Colombian | — | 1,451,271 | 0.4% |
| Cherokee | 239,224 | 1,449,888 | 0.4% |
| Portuguese | 543,531 | 1,350,442 | 0.4% |
| Hungarian | 390,561 | 1,247,165 | 0.4% |
| Jamaican | 903,516 | 1,234,336 | 0.4% |
| Honduran | — | 1,219,212 | 0.4% |
| Greek | 486,878 | 1,200,706 | 0.4% |
| Broadly “British”
(Not further specified) |
503,077 | 1,196,265 | 0.4% |
| Czech | 340,768 | 1,188,711 | 0.4% |
| Ukrainian | 565,431 | 1,164,728 | 0.3% |
| Haitian | 937,373 | 1,138,855 | 0.3% |
| Danish | 268,019 | 1,127,518 | 0.3% |
| Broadly "Eastern European"
(Not further specified) |
566,715 | 951,384 | 0.3% |
| Broadly "Scandinavian"
(Not further specified) |
372,673 | 935,153 | 0.3% |
| Indigenous Mexican | 548,717 | 875,183 | 0.3% |
| Ecuadorian | — | 870,965 | 0.3% |
| Swiss | 196,120 | 847,247 | 0.3% |
| Venezuelan | — | 814,080 | 0.2% |
| Peruvian | — | 751,519 | 0.2% |
| Native Hawaiian | 185,466 | 714,847 | 0.2% |
| Nigerian | 532,438 | 712,294 | 0.2% |
| Indigenous Central American
(Mayan, etc) |
315,313 | 634,503 | 0.2% |
| Pakistani | 560,494 | 625,570 | 0.2% |
| Finnish | 189,603 | 606,028 | 0.2% |
| Slovak | 186,902 | 602,949 | 0.2% |
| Lithuanian | 167,355 | 598,508 | 0.2% |
| Broadly "Asian"
(Not further specified) |
218,730 | 591,806 | 0.2% |
| Austrian | 123,987 | 584,517 | 0.2% |
| Brazilian | 389,082 | 546,757 | 0.2% |
| Canadian | 249,309 | 542,459 | 0.2% |
| Iranian | 392,051 | 519,658 | 0.2% |
| Nicaraguan | — | 488,080 | 0.1% |
| Armenian | 282,012 | 458,841 | 0.1% |
| Other sub-Saharan African
All sub-Saharan African origins other those already listed + Ugandan (35,849), Senegalese (31,462), and Zimbabwean (17,991) |
325,963 | 452,003 | 0.1% |
| Romanian | 251,069 | 450,751 | 0.1% |
| Navajo | 328,434 | 434,910 | 0.1% |
| Broadly "Northern European"
(No country specified) |
273,675 | 434,292 | 0.1% |
| Croatian | 128,623 | 389,272 | 0.1% |
| Ethiopian | 348,332 | 387,880 | 0.1% |
| Cambodian | 280,862 | 376,096 | 0.1% |
| Hmong | 335,612 | 362,244 | 0.1% |
| Thai | 197,158 | 328,176 | 0.1% |
| Taiwanese | 263,772 | 324,389 | 0.1% |
| Belgian | 96,361 | 316,493 | 0.1% |
| Argentine | — | 304,541 | 0.09% |
| Choctaw | 90,321 | 295,373 | 0.09% |
| Bangladeshi | 256,681 | 272,338 | 0.08% |
| Central Asian | 186,393 | 269,255 | 0.08% |
| Samoan | 123,150 | 264,392 | 0.08% |
| Nepali | 247,639 | 260,323 | 0.08% |
| Other Pacific Islander
(Pacific Islander origin without a specified Melanesian, Polynesian, or Micronesian group) |
43,135 | 251,806 | 0.08% |
| Guyanese | 182,088 | 250,467 | 0.08% |
| Broadly "West Indian"
(No country specified) |
130,229 | 245,867 | 0.07% |
| Laotian | 173,524 | 245,220 | 0.07% |
| Burmese | 225,591 | 244,086 | 0.07% |
| Trinidadian | 167,746 | 243,541 | 0.07% |
| Panamanian | — | 242,035 | 0.07% |
| Turkish | 168,354 | 239,667 | 0.07% |
| Pennsylvania German | 155,563 | 228,634 | 0.07% |
| "Czechoslovakian"
(Not further specified) |
79,992 | 227,217 | 0.07% |
| Albanian | 182,625 | 223,984 | 0.07% |
| Sioux | 100,575 | 220,739 | 0.07% |
| Ghanian | 179,527 | 217,322 | 0.07% |
| Chippewa/Ojibwe | 87,888 | 206,224 | 0.06% |
| Alaska Native
(Including all tribes) |
107,877 | 205,954 | 0.06% |
| Chilean | — | 199,948 | 0.06% |
| "Yugoslavian"
(Not further specified) |
129,759 | 198,687 | 0.06% |
| Apache | 73,085 | 191,823 | 0.06% |
| Serbian | 96,388 | 191,538 | 0.06% |
| Afghan | 169,255 | 189,493 | 0.06% |
| Costa Rican | — | 186,159 | 0.06% |
| Somali | 151,206 | 164,723 | 0.05% |
| Indonesian | 84,074 | 155,173 | 0.05% |
| Slovene | 48,809 | 153,589 | 0.05% |
| Chamorro
(10,194 additionally reported their ancestry as "Guamanian" alone, and 25,888 reported "Guamanian" alone or in combination) |
74,138 | 152,006 | 0.05% |
| Israeli | 80,336 | 144,202 | 0.04% |
| Bolivian | — | 142,108 | 0.04% |
| Broadly "Slavic"
(No country specified) |
57,491 | 140,956 | 0.04% |
| Kenyan | 98,938 | 122,131 | 0.04% |
| Creek/Muscogee | 36,446 | 119,850 | 0.04% |
| "British West Indian"
(No country/territory specified) |
74,833 | 109,344 | 0.03% |
| Iroqouis | 30,095 | 107,839 | 0.03% |
| Bulgarian | 75,386 | 106,896 | 0.03% |
| Cape Verdean | 71,306 | 104,710 | 0.03% |
| South African | 64,890 | 98,309 | 0.03% |
| Assyrian | 64,349 | 93,542 | 0.03% |
| Liberian | 76,087 | 92,651 | 0.03% |
| Latvian | 33,742 | 91,859 | 0.03% |
| Cajun | 59,046 | 91,706 | 0.03% |
| Indigenous South American | 28,813 | 91,508 | 0.03% |
| Australian | 37,180 | 88,999 | 0.03% |
| Lumbee | 58,226 | 81,645 | 0.02% |
| Pueblo | 49,201 | 81,419 | 0.02% |
| Other Micronesian
(All Micronesian groups other than Chamorro/Guamanian, Chuukese (12,567), or Marshallese) |
62,829 | 79,879 | 0.02% |
| Tongan | 41,530 | 79,826 | 0.02% |
| Uruguayan | — | 77,180 | 0.02% |
| Sri Lankan | 58,210 | 75,808 | 0.02% |
| Chickasaw | 23,670 | 72,601 | 0.02% |
| Sudanese | 64,586 | 71,788 | 0.02% |
| Yaqui | 35,442 | 71,063 | 0.02% |
| Belizean | 42,028 | 67,329 | 0.02% |
| Macedonian | 39,586 | 65,107 | 0.02% |
| Basque | 24,219 | 62,731 | 0.02% |
| Barbadian | 37,974 | 62,356 | 0.02% |
| Bahamian | 31,777 | 56,928 | 0.02% |
| Icelandic | 18,978 | 53,415 | 0.02% |
| Fijian | 35,788 | 53,250 | 0.02% |
| Uzbek | 25,849 | 52,304 | 0.02% |
| Mongolian | — | 51,954 | 0.02% |
| Marshallese | 43,548 | 51,119 | 0.02% |
Religion
Summarize
Perspective
Religious affiliations
Religion in the United States (2023)[199]
- Protestantism 42 (41.6%)
- Catholicism 21 (20.8%)
- Mormon 2 (1.98%)
- Orthodox Christian 1 (0.99%)
- Jewish 1 (0.99%)
- Muslim 1 (0.99%)
- Buddhist 1 (0.99%)
- Hindu 1 (0.99%)
- Other religion 2 (1.98%)
- Unaffiliated 28 (27.7%)
- Refused 1 (0.99%)
The table below is based mainly on selected data as reported to the United States Census Bureau. It only includes the voluntary self-reported membership of religious bodies with 750,000 or more. The definition of a member is determined by each religious body.[200] In 2004[update], the US census bureau reported that about 13% of the population did not identify themselves as a member of any religion.[201][clarification needed]
In a Pew Research Survey performed in 2012, Americans without a religion (atheists, agnostics, nothing in particular, etc.) approached the numbers of Evangelical Protestant Americans with almost 20% of Americans being nonreligious (compared to just over 26% being Evangelical Protestant). If this current growth rate continues, by 2050, around 51% of Americans will not have a religion.[202]
Surveys conducted in 2014 and 2019 by Pew indicated that the percentage of Americans unaffiliated with a religion increased from 16% in 2007 to 23% in 2014 and 26% of the population in 2019.[203][204]
According to statistical data made by the Pew Research Center in 2021 about 63% of the US population is Christian, 28% is Unaffiliated, 2% is Jewish, 1% follows Buddhism, 1% follows Hinduism, 1% follows Islam and 2% follow traditional religions and others. Currently, the United States has the largest Christian population in the world (approximately 230-250 million) and the largest Protestant Christian population (approximately 150-160 million). The country also has the second largest Jewish community in the world (after Israel) and the largest Buddhist and Hindu communities in the West, as well as the largest number of followers of Islam in North America. The country has about 64 million non-affiliates (only China and Japan have more).[citation needed][205]
Chart:
 Religious affiliation within each state that has the largest deviation compared to the national average, 2001
 Percentage of state populations that identify with a religion rather than "no religion", 2014
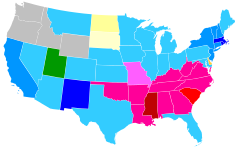 Plurality religion by state, 2001. Data is unavailable for Alaska and Hawaii.


According to Pew Research Center study released in 2018, by 2040, Islam will surpass Judaism to become the second largest religion in the US due to higher immigration and birth rates.[231]
Religions of U.S. adults
The United States government does not collect religious data in its census. The survey below, the American Religious Identification Survey (ARIS) 2008, was a random digit-dialed telephone survey of 54,461 American residential households in the contiguous United States. The 1990 sample size was 113,723; 2001 sample size was 50,281.
Adult respondents were asked the open-ended question, "What is your religion, if any?". Interviewers did not prompt or offer a suggested list of potential answers. The religion of the spouse or partner was also asked. If the initial answer was "Protestant" or "Christian" further questions were asked to probe which particular denomination. About one-third of the sample was asked more detailed demographic questions.
Religious Self-Identification of the U.S. Adult Population: 1990, 2001, 2008[232]
Figures are not adjusted for refusals to reply; investigators suspect refusals are possibly more representative of "no religion" than any other group.
| Group | 1990 adults × 1,000 | 2001 adults × 1,000 | 2008 adults × 1,000 | Numerical Change 1990– 2008 as % of 1990 | 1990 % of adults | 2001 % of adults | 2008 % of adults | change in % of total adults 1990– 2008 |
|---|---|---|---|---|---|---|---|---|
| Adult population, total | 175,440 | 207,983 | 228,182 | 30.1% | ||||
| Adult population, Responded | 171,409 | 196,683 | 216,367 | 26.2% | 97.7% | 94.6% | 94.8% | −2.9% |
| Total Christian | 151,225 | 159,514 | 173,402 | 14.7% | 86.2% | 76.7% | 76.0% | −10.2% |
| Catholic | 46,004 | 50,873 | 57,199 | 24.3% | 26.2% | 24.5% | 25.1% | −1.2% |
| Non-Catholic Christian | 105,221 | 108,641 | 116,203 | 10.4% | 60.0% | 52.2% | 50.9% | −9.0% |
| Baptist | 33,964 | 33,820 | 36,148 | 6.4% | 19.4% | 16.3% | 15.8% | −3.5% |
| Mainline Protestant | 32,784 | 35,788 | 29,375 | −10.4% | 18.7% | 17.2% | 12.9% | −5.8% |
| Methodist | 14,174 | 14,039 | 11,366 | −19.8% | 8.1% | 6.8% | 5.0% | −3.1% |
| Lutheran | 9,110 | 9,580 | 8,674 | −4.8% | 5.2% | 4.6% | 3.8% | −1.4% |
| Presbyterian | 4,985 | 5,596 | 4,723 | −5.3% | 2.8% | 2.7% | 2.1% | −0.8% |
| Episcopalian/Anglican | 3,043 | 3,451 | 2,405 | −21.0% | 1.7% | 1.7% | 1.1% | −0.7% |
| United Church of Christ | 438 | 1,378 | 736 | 68.0% | 0.2% | 0.7% | 0.3% | 0.1% |
| Christian Generic | 25,980 | 22,546 | 32,441 | 24.9% | 14.8% | 10.8% | 14.2% | −0.6% |
| Jehovah's Witness | 1,381 | 1,331 | 1,914 | 38.6% | 0.8% | 0.6% | 0.8% | 0.1% |
| Christian Unspecified | 8,073 | 14,190 | 16,384 | 102.9% | 4.6% | 6.8% | 7.2% | 2.6% |
| Non-denominational Christian | 194 | 2,489 | 8,032 | 4040.2% | 0.1% | 1.2% | 3.5% | 3.4% |
| Protestant – Unspecified | 17,214 | 4,647 | 5,187 | −69.9% | 9.8% | 2.2% | 2.3% | −7.5% |
| Evangelical/Born Again | 546 | 1,088 | 2,154 | 294.5% | 0.3% | 0.5% | 0.9% | 0.6% |
| Pentecostal/Charismatic | 5,647 | 7,831 | 7,948 | 40.7% | 3.2% | 3.8% | 3.5% | 0.3% |
| Pentecostal – Unspecified | 3,116 | 4,407 | 5,416 | 73.8% | 1.8% | 2.1% | 2.4% | 0.6% |
| Assemblies of God | 617 | 1,105 | 810 | 31.3% | 0.4% | 0.5% | 0.4% | 0.0% |
| Church of God | 590 | 943 | 663 | 12.4% | 0.3% | 0.5% | 0.3% | 0.0% |
| Other Protestant Denomination | 4,630 | 5,949 | 7,131 | 54.0% | 2.6% | 2.9% | 3.1% | 0.5% |
| Seventh-day Adventist | 668 | 724 | 938 | 40.4% | 0.4% | 0.3% | 0.4% | 0.0% |
| Churches of Christ | 1,769 | 2,593 | 1,921 | 8.6% | 1.0% | 1.2% | 0.8% | −0.2% |
| Mormon/Latter-Day Saints | 2,487 | 2,697 | 3,158 | 27.0% | 1.4% | 1.3% | 1.4% | 0.0% |
| Total non-Christian religions | 5,853 | 7,740 | 8,796 | 50.3% | 3.3% | 3.7% | 3.9% | 0.5% |
| Jewish | 3,137 | 2,837 | 2,680 | −14.6% | 1.8% | 1.4% | 1.2% | −0.6% |
| Eastern Religions | 687 | 2,020 | 1,961 | 185.4% | 0.4% | 1.0% | 0.9% | 0.5% |
| Buddhist | 404 | 1,082 | 1,189 | 194.3% | 0.2% | 0.5% | 0.5% | 0.3% |
| Muslim | 527 | 1,104 | 1,349 | 156.0% | 0.3% | 0.5% | 0.6% | 0.3% |
| New Religious Movements & Others | 1,296 | 1,770 | 2,804 | 116.4% | 0.7% | 0.9% | 1.2% | 0.5% |
| None/ No religion, total | 14,331 | 29,481 | 34,169 | 138.4% | 8.2% | 14.2% | 15.0% | 6.8% |
| Agnostic+Atheist | 1,186 | 1,893 | 3,606 | 204.0% | 0.7% | 0.9% | 1.6% | 0.9% |
| Did Not Know/ Refused to reply | 4,031 | 11,300 | 11,815 | 193.1% | 2.3% | 5.4% | 5.2% | 2.9% |
 States in the United States by Catholic population according to the Pew Research Center 2014 Religious Landscape Survey.[233] States with Catholic population greater than the United States as a whole are in full red.
 States in the United States by Evangelical Protestant population according to the Pew Research Center 2014 Religious Landscape Survey.[233] States with Evangelical Protestant populations greater than the United States as a whole are in full orange.


 States in the United States by Mainline or Black Protestant population according to the Pew Research Center 2014 Religious Landscape Survey.[233] States with Mainline or Black Protestant population greater than the United States as a whole are in full purple.
 States in the United States by non-Christian (e.g. Non-religious, Jewish, Muslim, Hindu, Buddhist) population according to the Pew Research Center 2014 Religious Landscape Survey.[233] States with non-Christian populations greater than the United States as a whole are in full blue.


 States in the United States by non-Protestant and non-Catholic Christian (e.g. Mormon, Jehovah's Witness, Eastern Orthodox) population according to the Pew Research Center 2014 Religious Landscape Survey.[233] States with non-Catholic/non-Protestant Christian population greater than the United States as a whole are in full green.

LGBT population
Summarize
Perspective
The 2000 U.S. Census counted same-sex couples in an oblique way; asking the sex and the relationship to the "main householder", whose sex was also asked. Community Marketing & Insights, an organization specializing in analyzing gay demographic data, reported, based on this count in the 2000 census and in the 2000 supplementary survey, that same-sex couples comprised between 1.0% and 1.1% of U.S. couples in 2000.[234] A 2006 report issued by The Williams Institute on Sexual Orientation concluded that the number of same-sex couples in the U.S. grew from 2000 to 2005, from nearly 600,000 couples in 2000 to almost 777,000 in 2005.[235] A 2006 UCLA study reported that 4.1% of Americans aged 18–45 identify as gay, lesbian, or bisexual.[236]
A 2011 report by the Williams Institute estimated that nine million adults identify as gay, lesbian, or bisexual, representing 3.5% of the population over 18.[237] A spokesperson said that, until recently, few studies have tried to distinguish people who had occasionally undertaken homosexual behavior or entertained homosexual thoughts, from people who identified as lesbian or gay.[238] (Older estimates have varied depending on methodology and timing; see Demographics of sexual orientation for a list of studies.)
Migration
Summarize
Perspective
Immigration
Foreign-born population


As of 2017, an estimated 44,525,458 residents of the United States were foreign-born,[240] 13.5% of the country's total population. This demographic includes recent as well as longstanding immigrants; statistically Europeans have resided in the US longer than those from other regions with approximately 66% having arrived prior to 2000.[241]
| Place of birth | Estimate | Percentage of total foreign-born people |
|---|---|---|
| Americas | 23,241,959 | 52.2% |
| Caribbean | 4,414,943 | 9.9% |
| > Cuba | 1,311,803 | 3.0% |
| > Dominican Republic | 1,162,568 | 2.6% |
| Central America (including Mexico) | 14,796,926 | 33.2% |
| > Mexico | 11,269,913 | 25.3% |
| > El Salvador | 1,401,832 | 3.2% |
| South America | 3,213,187 | 7.2% |
| Canada | 809,267 | 1.8% |
| Europe | 4,818,662 | 10.8% |
| Northern Europe | 941,796 | 2.1% |
| Western Europe | 949,591 | 2.1% |
| Southern Europe | 761,390 | 1.7% |
| Eastern Europe | 2,153,855 | 4.8% |
| Asia | 13,907,844 | 31.2% |
| Eastern Asia | 4,267,303 | 9.6% |
| > China | 2,639,365 | 5.9% |
| > Korea | 1,064,960 | 2.4% |
| South Central Asia | 4,113,013 | 9.2% |
| > India | 2,348,687 | 5.3% |
| South Eastern Asia | 4,318,647 | 9.8% |
| > Philippines | 1,945,345 | 4.4% |
| > Vietnam | 1,314,927 | 3.0% |
| Western Asia | 1,159,835 | 2.6% |
| Africa | 2,293,028 | 5.2% |
| Eastern Africa | 693,784 | 1.6% |
| Middle Africa | 163,364 | 0.4% |
| Northern Africa | 359,559 | 0.8% |
| Southern Africa | 116,297 | 0.2% |
| Western Africa | 837,290 | 1.9% |
| Oceania | 263,965 | 0.6% |
| Australia and New Zealand Subregion | 123,080 | 0.3% |
Immigration (2023)
| Immigrants in the | ||||
| Country | Immigrants | |||
|---|---|---|---|---|
| 10,918,205 | ||||
| 2,910,042 | ||||
| 2,193,250 | ||||
| 2,051,900 | ||||
| 1,494,869 | ||||
| 1,450,808 | ||||
| 1,365,841 | ||||
| 1,265,231 | ||||
| 1,250,053 | ||||
| 1,049,821 | ||||
In 2017, out of the U.S. foreign-born population, some 45% (20.7 million) were naturalized citizens, 27% (12.3 million) were lawful permanent residents (including many eligible to become citizens), 6% (2.2 million) were temporary lawful residents, and 23% (10.5 million) were unauthorized immigrants.[243] Among current living immigrants to the U.S., the top five countries of birth are Mexico (25% of immigrants), China (6%), India (6%), the Philippines (5%) and El Salvador (3%). Some 13% of current living immigrants come from Europe and Canada, and 10% from the Caribbean.[243] Among new arrivals, Asian immigrants have been more numerous than Hispanic immigrants since 2010; in 2017, 37.4% of immigrant arrivals were Asian, and 26.6% were Hispanic.[243] Until 2017 and 2018, the United States led the world in refugee resettlement for decades, admitting more refugees than the rest of the world combined.[244] From fiscal year 1980 until 2017, 55% of refugees came from Asia, 27% from Europe, 13% from Africa, and 4% from Latin America, fleeing war and persecution.[244]
- Net migration rate (2024): 3 migrants/1,000 population.[6] Country comparison to the world: 38th[6]
- Net migration rate* (2020-2021): 0.73 migrants/1,000 population.[245]
*(mid-year estimates)
As of 2017, 13.6% (44.4 million) of the population was foreign born – an increase from 4.7% in 1970 but less than the 1890 record of 14.8%. Some 45% of the foreign born population were naturalized US citizens. Around 23% (10.3 million) of the foreign born community is undocumented, accounting for 3.2% of the total population.[243] According to the 2010 census, Latin America and the Caribbean is the largest region-of-birth group, accounting for 53% of the foreign born population. As of 2018 this region is still the largest source of immigrants to the United States[246][247][248] In 2018, there were almost 90 million immigrants and U.S. born children of immigrants (second-generation Americans) in the United States, accounting for 28% of the overall U.S. population.[249] In 2018, 1,096,611 immigrants were granted either permanent or temporary legal residence in the United States[250]
| Country | 2021 |
|---|---|
| 107,230 | |
| 93,450 | |
| 49,847 | |
| 27,511 | |
| 24,553 | |
| 23,077 | |
| 18,668 | |
| 18,351 | |
| 16,312 | |
| 15,293 | |
| 14,412 | |
| 13,357 | |
| 13,100 | |
| 12,351 | |
| 11,456 |
| Region | 2021 |
|---|---|
| Americas | 311,806 |
| Asia | 295,306 |
| Africa | 66,211 |
| Europe | 61,521 |
| Oceania | 4,147 |
| Not Specified | 1,011 |
| Total | 707,362 |
| Class of Admission (Adjustments of Status and New Arrivals) | 2021 |
|---|---|
| Immediate relatives of U.S. citizens | 385,396 |
| Family-sponsored preferences | 65,690 |
| Employment-based preferences | 193,338 |
| Diversity | 15,145 |
| Refugees | 35,847 |
| Asylees | 20,550 |
| Parolees | 13 |
| Children born abroad to alien residents | 75 |
| Certain Iraqis and Afghans employed by U.S. Government and their spouses and children | 8,303 |
| Cancellation of removal | 5,017 |
| Victims of human trafficking | 942 |
| Victims of crimes and their spouses and children | 9,257 |
| Other | 429 |
Emigration and Expatriation
As of April 2015, the U.S. State Department estimated that 8.7 million American citizens live overseas. Americans living abroad are not counted in the U.S. Census unless they are federal government employees or dependents of a federal employee.[253] A 2010 paper estimated the number of civilian Americans living abroad to be around 4 million.[254] So-called "accidental Americans" are citizens of a country other than the United States who may also be considered U.S. citizens or be eligible for U.S. citizenship under specific laws but are not aware of having such status (or became aware of it only recently).[255]
As of 2022, 1.6 million Americans live in Mexico, according to the State Department.[256]
Economics
Summarize
Perspective
Income
In 2020, the median household income in the United States was around $67,521, 2.9 percent less than the 2019 median of $69,560.[257] Household and personal income depends on variables such as race, number of income earners, educational attainment and marital status.
| Type of household | Race and Hispanic origin | Region | ||||||||
|---|---|---|---|---|---|---|---|---|---|---|
| All households | Family households |
Nonfamily households |
Asian | Non-Hispanic White | Hispanic (of any race) |
Black | Northeast | Midwest | South | West |
| $70,784 | $91,162 | $41,797 | $101,418 | $77,999 | $57,981 | $48,297 | $77,422 | $71,129 | $63,368 | $79,430 |
| Age of Householder | Nativity of Householder | Metropolitan Statistical Area (MSA) Status | Educational Attainment of Householder* | ||||||
|---|---|---|---|---|---|---|---|---|---|
| Under 65 years | 65 years and older | Native-born | Foreign-born | Inside MSA | Outside MSA | No high school diploma | High school, no college | Some college | Bachelor's degree or higher |
| $80,734 | $47,620 | $71,522 | $66,043 | $73,823 | $53,750 | $30,378 | $50,401 | $64,378 | $115,456 |
| *Householders aged 25 and older. In 2021, the median household income for this group was $72,046. | |||||||||
| Total workers | Full-Time, year-round workers | ||||
|---|---|---|---|---|---|
| Both sexes | Male | Female | Both sexes | Male | Female |
| $45,470 | $50,983 | $39,201 | $56,473 | $61,180 | $51,226 |
| Measure | Overall | Less than 9th grade | Some High School | High school graduate | Some college | Associate's degree | Bachelor's degree or higher | Bachelor's degree | Master's degree | Professional degree | Doctorate degree |
|---|---|---|---|---|---|---|---|---|---|---|---|
| Persons, age 25+ w/ earnings* | $46,985 | $25,162 | $26,092 | $34,540 | $39,362 | $42,391 | $66,423 | $60,705 | $71,851 | $102,741 | $101,526 |
| Male, age 25+ w/ earnings* | $52,298 | $30,089 | $31,097 | $40,852 | $47,706 | $52,450 | $80,192 | $71,666 | $91,141 | $126,584 | $121,956 |
| Female, age 25+ w/ earnings* | $40,392 | $18,588 | $19,504 | $27,320 | $31,837 | $36,298 | $57,355 | $51,154 | $62,522 | $92,780 | $85,551 |
| Persons, age 25+, employed full-time | $59,371 | $33,945 | $34,897 | $42,417 | $50,640 | $52,285 | $77,105 | $71,283 | $82,183 | $130,466 | $119,552 |
| Household | $69,228 | $29,609 | $29,520 | $47,405 | $60,392 | $68,769 | $106,936 | $100,128 | $114,900 | $151,560 | $142,493 |
| *Total work experience | |||||||||||
| 10th percentile | 20th percentile | 30th percentile | 40th percentile | 50th percentile | 60th percentile | 70th percentile | 80th percentile | 90th percentile | 95th percentile |
|---|---|---|---|---|---|---|---|---|---|
| ≤ $15,700 | ≤ $28,000 | ≤ $40,500 | ≤ $55,000 | $70,800 | ≤ $89,700 | ≤ $113,200 | ≤ $149,100 | ≤ $212,100 | ≤ $286,300 |
| Source: US Census Bureau, 2021; income statistics for the year 2021 | |||||||||
 Counties in the United States by the percentage of the over 25-year-old population with bachelor's degrees according to the U.S. Census Bureau American Community Survey 2013–2017 5-Year Estimates.[261] Counties with higher percentages of bachelor's degrees than the United States as a whole are in full orange.
 States in the United States by the percentage of the over 25-year-old population with bachelor's degrees according to the U.S. Census Bureau American Community Survey 2013–2017 5-Year Estimates.[261] States with higher percentages of bachelor's degrees than the United States as a whole are in full orange.


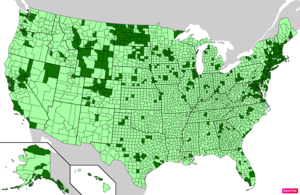 Counties in the United States by per capita income according to the U.S. Census Bureau American Community Survey 2013–2017 5-Year Estimates.[262] Counties with per capita incomes higher than the United States as a whole are in full green.
 States in the United States by per capita income according to the U.S. Census Bureau American Community Survey 2013–2017 5-Year Estimates.[262] States with per capita incomes higher than the United States as a whole are in full green.


 Counties in the United States by median nonfamily household income according to the U.S. Census Bureau American Community Survey 2013–2017 5-Year Estimates.[262] Counties with median nonfamily household incomes higher than the United States as a whole are in full green.
 States in the United States by median nonfamily household income according to the U.S. Census Bureau American Community Survey 2013–2017 5-Year Estimates.[262] States with median nonfamily household incomes higher than the United States as a whole are in full green.


 Counties in the United States by median family household income according to the U.S. Census Bureau American Community Survey 2013–2017 5-Year Estimates.[262] Counties with median family household incomes higher than the United States as a whole are in full green.
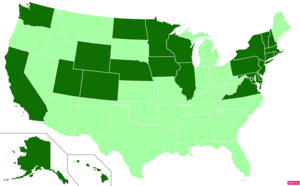 States in the United States by median family household income according to the U.S. Census Bureau American Community Survey 2013–2017 5-Year Estimates.[262] States with median family household incomes higher than the United States as a whole are in full green.


Economic class
Social classes in the United States lack distinct boundaries and may overlap. Even their existence (when distinguished from economic strata) is controversial. The following table provides a summary of some prominent academic theories on the stratification of American society:
| Dennis Gilbert, 2002 | William Thompson & Joseph Hickey, 2005 | Leonard Beeghley, 2004 | |||
|---|---|---|---|---|---|
| Class | Typical characteristics | Class | Typical characteristics | Class | Typical characteristics |
| Capitalist class (1%) | Top-level executives, high-rung politicians, heirs. Ivy League education common. | Upper class (1%) | Top-level executives, celebrities, heirs; income of $500,000+ common. Ivy league education common. | The super-rich (0.9%) | Multi-millionaires whose incomes commonly exceed $3.5 million or more; includes celebrities and powerful executives/politicians. Ivy League education common. |
| Upper middle class[1] (15%) | Highly-educated (often with graduate degrees), most commonly salaried, professionals and middle management with large work autonomy. | Upper middle class[1] (15%) | Highly-educated (often with graduate degrees) professionals & managers with household incomes varying from the high 5-figure range to commonly above $100,000. | The rich (5%) | Households with net worth of $1 million or more; largely in the form of home equity. Generally have college degrees. |
| Middle class (plurality/ majority?; ca. 46%) |
College-educated workers with considerably higher-than-average incomes and compensation; a man making $57,000 and a woman making $40,000 may be typical. | ||||
| Lower middle class (30%) | Semi-professionals and craftsmen with a roughly average standard of living. Most have some college education and are white-collar. | Lower middle class (32%) | Semi-professionals and craftsmen with some work autonomy; household incomes commonly range from $35,000 to $75,000. Typically, some college education. | ||
| Working class (30%) | Clerical and most blue-collar workers whose work is highly routinized. Standard of living varies depending on number of income earners, but is commonly just adequate. High school education. | ||||
| Working class (32%) | Clerical, pink- and blue-collar workers with often low job security; common household incomes range from $16,000 to $30,000. High school education. | Working class (ca. 40–45%) |
Blue-collar workers and those whose jobs are highly routinized with low economic security; a man making $40,000 and a woman making $26,000 may be typical. High school education. | ||
| Working poor (13%) | Service, low-rung clerical and some blue-collar workers. High economic insecurity and risk of poverty. Some high school education. | ||||
| Lower class (ca. 14–20%) | Those who occupy poorly-paid positions or rely on government transfers. Some high school education. | ||||
| Underclass (12%) | Those with limited or no participation in the labor force. Reliant on government transfers. Some high school education. | The poor (ca. 12%) | Those living below the poverty line with limited to no participation in the labor force; a household income of $18,000 may be typical. Some high school education. | ||
| |||||
Unemployment rate (seasonally adjusted)

<3.0%
<3.5%
<4.0%
<4.5%
<5.0%
<5.5%
<6.0%
<6.5%
≥6.5%
The U6 unemployment rate as of April 2017[update] was 8.6 percent.[266] The U6 unemployment rate counts not only people without work seeking full-time employment (the more familiar U3 rate), but also counts "marginally attached workers and those working part-time for economic reasons." Some of these part-time workers counted as employed by U6 could be working as little as an hour a week. And the "marginally attached workers" include those who have become discouraged and stopped looking, but still want to work. The age considered for this calculation is 16 years and over.
Urban Americans have more job opportunities than those in more rural areas. From 2008 to 2018, 72% of the nation's employment growth occurred in cities with more than one million residents, which account for 56% of the overall population.[267]
Generational cohorts
Summarize
Perspective
A definitive recent study of US generational cohorts was done by Schuman and Scott (2012) in which a broad sample of adults of all ages was asked, "What world events are especially important to you?"[268] They found that 33 events were mentioned with great frequency. When the ages of the respondents were correlated with the expressed importance rankings, seven (some put 8 or 9) distinct cohorts became evident.
Today the following descriptors are frequently used for these cohorts:
| Generation | Birth Years | Notes | Citation |
|---|---|---|---|
| Lost Generation | c. 1883 – 1900 | Came of age during World War I; known for disillusionment and questioning of traditional values. | [269] |
| Greatest Generation | c. 1901 – 1927 | Also called the "Depression cohort"; fought in World War II. | [270] |
| Silent Generation | c. 1928 – 1945 | Grew up during the Great Depression and World War II; includes most who fought in the Korean War. | [271] |
| Baby boomers | 1946 – 1964 | The large generation of children born after World War II to the Greatest and Silent Generations; also called "Boomers". | [272] |
| Generation X | c. 1965 – 1980 | Sometimes called the "baby bust" generation due to declining birth rates after the baby boom. | [273] |
| Millennials | c. 1981 – 1996 | Also known as "Generation Y". | [274] |
| Generation Z | c. 1997 – 2012 | Also called "Zoomers", "iGeneration," or "Digital Natives". | [275] |
| Generation Alpha | Early 2010s – mid-2020s | First generation fully raised in a digital world; children of Millennials. | [276] |
U.S. demographic birth cohorts
Graphs are unavailable due to technical issues. Updates on reimplementing the Graph extension, which will be known as the Chart extension, can be found on Phabricator and on MediaWiki.org. |
Birth rate, death rate and natural increase rate in the United States 1935–2021
Subdivided groups are present when peak boom years or inverted peak bust years are present, and may be represented by a normal or inverted bell-shaped curve (rather than a straight curve). The boom subdivided cohorts may be considered as "pre-peak" (including peak year) and "post-peak". The year 1957 was the baby boom peak with 4.3 million births and 122.7 fertility rate. Although post-peak births (such as trailing edge boomers) are in decline, and sometimes referred to as a "bust", there are still a relatively large number of births. The dearth-in-birth bust cohorts include those up to the valley birth year, and those including and beyond, leading up to the subsequent normal birth rate. The baby boom began around 1943 to 1946.[277]
From the decline in U.S. birth rates starting in 1958 and the introduction of the birth control pill in 1960, the Baby Boomer normal distribution curve is negatively skewed. The trend in birth rates from 1958 to 1961 show a tendency to end late in the decade at approximately 1969, thus returning to pre-WWII levels, with 12 years of rising and 12 years of declining birth rates. Pre-war birth rates were defined as anywhere between 1939 and 1941 by demographers such as the Taeuber's, Philip M. Hauser and William Fielding Ogburn.[278]
Mobility
In 2021, 27.1 million Americans said they were living in a different place than a year before, compared to 29.8 million in 2020. This reflects an 8.4% mover rate, the lowest recorded in more than 70 years.[279]
Education
This section needs expansion. You can help by adding to it. (February 2025) |
See also
- Aging of the United States
- Demographic history of the United States
- History of public health in the United States
- Historical Statistics of the United States, the book
- Languages of the United States
- Maps of American ancestries
- Places in the United States with notable demographic characteristics
Lists
- List of metropolitan areas in the Americas
- List of U.S. states and territories by fertility rate
- List of U.S. states and territories by population
- List of U.S. states and territories by race/ethnicity
- List of U.S. states by socioeconomic factors
- Lists of U.S. cities with non-white majority populations
Income
Population
Notes
- In fertility rates, 2.1 and above is a stable population and has been marked blue, 2 and below leads to an aging population and the result is that the population decreases.
References
External links
Wikiwand - on
Seamless Wikipedia browsing. On steroids.