Top Qs
Timeline
Chat
Perspective
United States balance of trade
Aspect of U.S. foreign trade From Wikipedia, the free encyclopedia
Remove ads
The balance of trade of the United States moved into substantial deficit from the late 1990s, especially with China and other Asian countries. This has been accompanied by a relatively low savings ratio and high levels of government and corporate debt. Debate continues over the causes and impacts of this trade deficit, and the nature of any measures required in response.

Remove ads
History

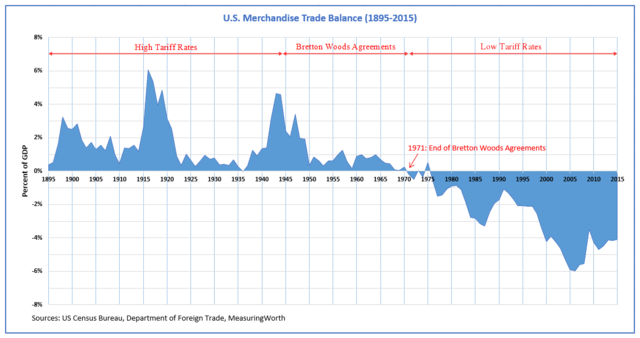
The 1920s marked a decade of economic growth in the United States following a classical supply side policy.[1] U.S. President Warren Harding signed the Emergency Tariff of 1921 and the Fordney–McCumber Tariff of 1922. Harding's policies reduced taxes and protected U.S. business and agriculture. Following the Great Depression and World War II, the United Nations Monetary and Financial Conference brought the Bretton Woods currency agreement followed by the economy of the 1950s and 1960s. In 1971, President Richard Nixon ended U.S. ties to Bretton Woods, leaving the U.S. with a floating fiat currency.
Over the long run, nations with trade surpluses tend also to have a savings surplus. The U.S. generally has developed lower savings rates than its trading partners, which have tended to have trade surpluses. Germany, France, Japan, and Canada have maintained higher savings rates than the U.S. over the long run.[2]
Remove ads
Impacts
Summarize
Perspective


The notion that bilateral trade deficits are bad in and of themselves is overwhelmingly rejected by trade experts and economists.[4][5][6][7][8] Some economists note that the trade deficit increases when the U.S. economy grows and Americans are able to buy the goods and services they want from abroad. But many also worry that a persistent trade deficit could lead to lower employment and economic growth in the United States.[9]
Wealth-producing sector jobs in the U.S. such as those in manufacturing and computer software have often been replaced by lower-paying wealth-consuming service sector jobs such as those in retail and government when the economy recovered from recessions.[10][11] Some economists contend that the U.S. is borrowing to fund consumption of imports while accumulating unsustainable amounts of debt.[3][12]
In 2006, the primary economic concerns focused on: high national debt ($9 trillion), high non-bank corporate debt ($9 trillion), high mortgage debt ($9 trillion), high financial institution debt ($12 trillion), high unfunded Medicare liability ($30 trillion), high unfunded Social Security liability ($12 trillion), high external debt (amount owed to foreign lenders) and a serious deterioration in the United States net international investment position (NIIP) (−24% of GDP),[3] high trade deficits, and a rise in illegal immigration.[12][13]
These issues have raised concerns among economists and unfunded liabilities were mentioned as a serious problem facing the United States in the President's 2006 State of the Union address.[13][14] On June 26, 2009, Jeff Immelt, the CEO of General Electric, called for the U.S. to increase its manufacturing base employment to 20% of the workforce, commenting that the U.S. has outsourced too much in some areas and can no longer rely on the financial sector and consumer spending to drive demand.[15]
In 1985, the U.S. had just begun a growing trade deficit with China. During the 1990s, U.S. trade deficit became a more excessive long-run trade deficit, mostly with Asia. By 2012, the U.S. trade deficit, fiscal budget deficit, and federal debt increased to record or near record levels following accompanying decades of the implementation of broad unconditional or unilateral U.S. free trade policies and formal trade agreements.[16][17] The overall U.S. trade deficit widened 12.2 percent in 2022 to nearly $1 trillion as Americans bought large volumes of foreign machinery, pharmaceuticals, industrial supplies and car parts, according to new data released by the Commerce Department.[18]
The US last had a trade surplus in 1975.[19] However, recessions may cause short-run anomalies to rising trade deficits.
Remove ads
Balance of trade table
See also
References
Wikiwand - on
Seamless Wikipedia browsing. On steroids.
Remove ads
