Wakefield Metropolitan District Council elections
Local government elections in West Yorkshire, England From Wikipedia, the free encyclopedia
One third of Wakefield Metropolitan District Council in West Yorkshire, England is elected each year for 3 years, followed by one year without an election. 63 councillors are elected with 3 from each of the 21 wards.[1]
This article needs additional citations for verification. (June 2021) |
Council elections
- 1998 Wakefield Metropolitan District Council election
- 1999 Wakefield Metropolitan District Council election
- 2000 Wakefield Metropolitan District Council election
- 2002 Wakefield Metropolitan District Council election
- 2003 Wakefield Metropolitan District Council election
- 2004 Wakefield Metropolitan District Council election (whole council elected after boundary changes)[2]
- 2006 Wakefield Metropolitan District Council election
- 2007 Wakefield Metropolitan District Council election
- 2008 Wakefield Metropolitan District Council election
- 2010 Wakefield Metropolitan District Council election
- 2011 Wakefield Metropolitan District Council election
- 2012 Wakefield Metropolitan District Council election
- 2014 Wakefield Metropolitan District Council election
- 2015 Wakefield Metropolitan District Council election
- 2016 Wakefield Metropolitan District Council election
- 2018 Wakefield Metropolitan District Council election
- 2019 Wakefield Metropolitan District Council election
- 2021 Wakefield Metropolitan District Council election
- 2022 Wakefield Metropolitan District Council election
- 2023 Wakefield Metropolitan District Council election
- 2024 Wakefield Metropolitan District Council election
Borough result maps
 2006 results map
 2007 results map
 2008 results map
 2010 results map
 2011 results map
 2012 results map
 2014 results map
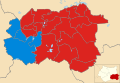 2015 results map
 2016 results map
 2018 results map
 2019 results map
 2021 results map
 2022 results map
 2023 results map
- 2024 results map


By-election results
1998-2002
| Party | Candidate | Votes | % | ±% | |
|---|---|---|---|---|---|
| Labour | Tony Richardson | 988 | 49.3 | −22.8 | |
| Conservative | Kenneth Blackburn | 661 | 33.0 | +15.4 | |
| Liberal Democrats | Mark Goodair | 356 | 17.8 | +7.4 | |
| Majority | 327 | 16.3 | |||
| Turnout | 2,005 | 17.9 | |||
| Labour hold | Swing | ||||
| Party | Candidate | Votes | % | ±% | |
|---|---|---|---|---|---|
| Labour | 833 | 55.0 | +2.7 | ||
| Conservative | 511 | 37.7 | −1.7 | ||
| Liberal Democrats | Douglas Dale | 171 | 11.3 | −1.0 | |
| Majority | 322 | 17.3 | |||
| Turnout | 1,515 | 14.1 | |||
| Labour hold | Swing | ||||
2001-2009
| Party | Candidate | Votes | % | ±% | |
|---|---|---|---|---|---|
| Labour | 3,013 | 51.8 | +3.2 | ||
| Conservative | 2,004 | 34.5 | −5.3 | ||
| Liberal Democrats | Mark Goodair | 797 | 13.7 | +2.1 | |
| Majority | 1,009 | 17.3 | |||
| Turnout | 5,814 | 54.6 | |||
| Labour hold | Swing | ||||
| Party | Candidate | Votes | % | ±% | |
|---|---|---|---|---|---|
| Labour | 848 | 42.7 | +10.3 | ||
| Conservative | 605 | 30.4 | −14.6 | ||
| Liberal Democrats | Mark Goodair | 405 | 20.4 | −2.2 | |
| Independent | 69 | 3.5 | +3.5 | ||
| Independent | 60 | 3.0 | +3.0 | ||
| Majority | 243 | 12.3 | |||
| Turnout | 1,987 | 16.5 | |||
| Labour hold | Swing | ||||
2002-2006
| Party | Candidate | Votes | % | ±% | |
|---|---|---|---|---|---|
| Labour | David Watts | 1,156 | 38.2 | +9.4 | |
| Conservative | Glenn Armitage | 1,110 | 36.6 | +10.2 | |
| Liberal Democrats | Mark Goodair | 764 | 25.2 | +4.4 | |
| Majority | 46 | 1.6 | |||
| Turnout | 3,030 | 26.0 | |||
| Labour gain from Conservative | Swing | ||||
2006-2010
| Party | Candidate | Votes | % | ±% | |
|---|---|---|---|---|---|
| Labour | Les Shaw | 1,330 | 49.9 | +3.2 | |
| Liberal Democrats | Paul Kirby | 603 | 22.6 | +8.3 | |
| BNP | Stephen Rogerson | 353 | 13.3 | −7.7 | |
| Conservative | Carl Milner | 275 | 10.3 | −7.7 | |
| Independent | Jason Smart | 102 | 3.8 | +3.8 | |
| Majority | 727 | 27.3 | |||
| Turnout | 2,663 | 23.4 | |||
| Labour hold | Swing | ||||
2010-2014
| Party | Candidate | Votes | % | ±% | |
|---|---|---|---|---|---|
| Labour | Janet Holmes | 1,776 | 51.4 | +2.2% | |
| Conservative | Richard Wakefield | 1061 | 30.7 | −10.5% | |
| UKIP | David Dews | 232 | 6.7 | +6.7% | |
| Liberal Democrats | Mark Goodair | 200 | 5.8 | −3.7% | |
| Independent | Norman Tate | 93 | 2.7 | +2.7 | |
| Independent | Mark Harrop | 88 | 2.5 | +2.5 | |
| Majority | 715 | 20.7 | |||
| Turnout | 3, 454 | 28.6 | |||
| Labour gain from Conservative | Swing | ||||
| Party | Candidate | Votes | % | ±% | |
|---|---|---|---|---|---|
| Labour | Richard Forster | 1,567 | 76.7 | ||
| UKIP | Nathan Garbutt | 349 | 17.1 | ||
| Conservative | Anne-Marie Glover | 95 | 4.6 | ||
| Liberal Democrats | Mark Goodair | 33 | 1.6 | ||
| Majority | 1218 | 60.0 | |||
| Turnout | 2,044 | 16.9 | |||
| Labour hold | Swing | ||||
| Party | Candidate | Votes | % | ±% | |
|---|---|---|---|---|---|
| Labour | Rory Bickerton | 1,061 | 40.3 | −0.2% | |
| UKIP | Graham Jesty | 856 | 32.5 | +22.5 | |
| Conservative | Angela Howell | 504 | 19.1 | −3.7 | |
| Liberal Democrats | Mark Goodair | 212 | 8.1 | −0.2 | |
| Majority | 205 | 7.8 | |||
| Turnout | 2, 633 | 20.77 | |||
| Labour hold | Swing | ||||
2014-2018
| Party | Candidate | Votes | % | ±% | |
|---|---|---|---|---|---|
| Labour | Lorna Malkin | 909 | |||
| UKIP | Nathan Garbutt | 453 | |||
| Conservative | Anthony Hill | 299 | |||
| Yorkshire First | Lucy Brown | 124 | |||
| Liberal Democrats | Daniel Woodlock | 86 | |||
| TUSC | Daniel Dearden | 24 | |||
| Majority | |||||
| Turnout | |||||
| Labour hold | Swing | ||||
| Party | Candidate | Votes | % | ±% | |
|---|---|---|---|---|---|
| Labour | Jack Spencer Hemmingway | 1,353 | 51.0 | +2.4 | |
| Conservative | Nathan Garbutt Moore | 847 | 31.9 | +7.3 | |
| Liberal Democrats | Nicola Kate Sinclair | 165 | 6.2 | +2.3 | |
| Yorkshire | Lucy Victoria Brown | 153 | 5.8 | +5.8 | |
| UKIP | James Lee Johnston | 136 | 5.1 | −16.4 | |
| Majority | 506 | 19.1 | |||
| Turnout | 2,655 | 21.5 | |||
| Labour hold | Swing | ||||
| Party | Candidate | Votes | % | ±% | |
|---|---|---|---|---|---|
| Labour | Michael Paul Graham | 1,118 | 49.6 | ||
| Conservative | Dawn Lesley Hunt | 933 | 41.4 | ||
| Yorkshire | Paul Phelps | 152 | 6.7 | ||
| Liberal Democrats | Peter John Williams | 46 | 2.0 | ||
| Majority | 185 | 8.2 | |||
| Turnout | 2253 | 20.6 | |||
| Labour hold | Swing | ||||
2022-2026
| Party | Candidate | Votes | % | ±% | |
|---|---|---|---|---|---|
| Labour | Scott Haslam | 893 | 42.1 | ||
| Liberal Democrats | Christopher Howden | 548 | 25.9 | ||
| Reform UK | Waj Ali | 463 | 21.8 | ||
| Conservative | Pepe Ruzvidzo | 141 | 6.7 | ||
| Green | Alexander Wood | 74 | 3.5 | ||
| Majority | 345 | 16.3 | |||
| Turnout | 2,119 | ||||
| Labour hold | Swing | ||||
References
External links
Wikiwand - on
Seamless Wikipedia browsing. On steroids.