Ramachandran plot
Visual representation of allowable protein conformations From Wikipedia, the free encyclopedia

In biochemistry, a Ramachandran plot (also known as a Rama plot, a Ramachandran diagram or a [φ,ψ] plot), originally developed in 1963 by G. N. Ramachandran, C. Ramakrishnan, and V. Sasisekharan,[1] is a way to visualize energetically allowed regions for backbone dihedral angles ( also called as torsional angles , phi and psi angles ) ψ against φ of amino acid residues in protein structure. The figure on the left illustrates the definition of the φ and ψ backbone dihedral angles[2] (called φ and φ' by Ramachandran). The ω angle at the peptide bond is normally 180°, since the partial-double-bond character keeps the peptide bond planar.[3] The figure in the top right shows the allowed φ,ψ backbone conformational regions from the Ramachandran et al. 1963 and 1968 hard-sphere calculations: full radius in solid outline, reduced radius in dashed, and relaxed tau (N-Cα-C) angle in dotted lines.[4] Because dihedral angle values are circular and 0° is the same as 360°, the edges of the Ramachandran plot "wrap" right-to-left and bottom-to-top. For instance, the small strip of allowed values along the lower-left edge of the plot are a continuation of the large, extended-chain region at upper left.


Uses
A Ramachandran plot can be used in two somewhat different ways. One is to show in theory which values, or conformations, of the ψ and φ angles are possible for an amino-acid residue in a protein (as at top right). A second is to show the empirical distribution of datapoints observed in a single structure (as at right, here) in usage for structure validation, or else in a database of many structures (as in the lower 3 plots at left). It's used to predict about Drug-ligand interaction and helpful in pharmaceutical industries. Either case is usually shown against outlines for the theoretically favored regions.
Amino-acid preferences
One might expect that larger side chains would result in more restrictions and consequently a smaller allowable region in the Ramachandran plot, but the effect of side chains is small.[5] In practice, the major effect seen is that of the presence or absence of the methylene group at Cβ.[5] Glycine has only a hydrogen atom for its side chain, with a much smaller van der Waals radius than the CH3, CH2, or CH group that starts the side chain of all other amino acids. Hence it is least restricted, and this is apparent in the Ramachandran plot for glycine (see Gly plot in gallery) for which the allowable area is considerably larger. In contrast, the Ramachandran plot for proline, with its 5-membered-ring side chain connecting Cα to backbone N, shows a limited number of possible combinations of ψ and φ (see Pro plot in gallery). The residue preceding proline ("pre-proline") also has limited combinations compared to the general case.
More recent updates
Summarize
Perspective
The first Ramachandran plot was calculated just after the first protein structure at atomic resolution was determined (myoglobin, in 1960[6]), although the conclusions were based on small-molecule crystallography of short peptides. Now, many decades later, there are tens of thousands of high-resolution protein structures determined by X-ray crystallography and deposited in the Protein Data Bank (PDB). Many studies have taken advantage of this data to produce more detailed and accurate φ,ψ plots (e.g., Morris et al. 1992;[7] Kleywegt & Jones 1996;[8] Hooft et al. 1997;[9] Hovmöller et al. 2002;[10] Lovell et al. 2003;[11] Anderson et al. 2005.[12] Ting et al. 2010[13]).
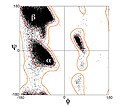
The four figures below show the datapoints from a large set of high-resolution structures and contours for favored and for allowed conformational regions for the general case (all amino acids except Gly, Pro, and pre-Pro), for Gly, and for Pro.[11] The most common regions are labeled: α for α helix, Lα for left-handed helix, β for β-sheet, and ppII for polyproline II. Such a clustering is alternatively described in the ABEGO system, where each letter stands for α (and 310) helix, right-handed β sheets (and extended structures), left-handed helixes, left-handed sheets, and finally unplottable cis peptide bonds sometimes seen with proline; it has been used in the classification of motifs[14] and more recently for designing proteins.[15]
While the Ramachandran plot has been a textbook resource for explaining the structural behavior of peptide bond, an exhaustive exploration of how a peptide behaves in every region of the Ramachandran plot was only recently published (Mannige 2017[16]).
The Molecular Biophysics Unit at Indian Institute of Science celebrated 50 years of Ramachandran Map[17] by organizing International Conference on Biomolecular Forms and Functions from 8–11 January 2013.[18]
Related conventions
One can also plot the dihedral angles in polysaccharides (e.g. with CARP Archived 2019-05-05 at the Wayback Machine).[19]
Gallery
 Ramachandran plot for the general case; data from Lovell 2003
 Ramachandran plot for Glycine
 Ramachandran plot for Proline
 Ramachandran plot for pre-Proline


Software
- Web-based Structural Analysis tool for any uploaded PDB file, producing Ramachandran plots, computing dihedral angles and extracting sequence from PDB Archived 2016-03-05 at the Wayback Machine
- Web-based tool showing Ramachandran plot of any PDB entry
- MolProbity web service that produces Ramachandran plots and other validation of any PDB-format file
- SAVES (Structure Analysis and Verification) — uses WHATCHECK, PROCHECK, and does its own internal Ramachandran Plot
- STING
- Pymol with the DynoPlot extension
- VMD, distributed with dynamic Ramachandran plot plugin
- WHAT CHECK, the stand-alone validation routines from the WHAT IF software
- UCSF Chimera, found under the Model Panel.
- Sirius
- Swiss PDB Viewer
- TALOS
- Zeus molecular viewer — found under "Tools" menu, high quality plots with regional contours
- Procheck
- Neighbor-Dependent and Neighbor-Independent Ramachandran Probability Distributions[13]
- See also PDB for a list of similar software.
References
Further reading
External links
Wikiwand - on
Seamless Wikipedia browsing. On steroids.