Parliamentary constituencies in Derbyshire
From Wikipedia, the free encyclopedia
The ceremonial county of Derbyshire (which includes the unitary authority of Derby) is divided into 11 parliamentary constituencies: three borough constituencies and eight county constituencies. Since the 2024 general election, all eleven constituencies have been represented by members of the Labour Party.
Constituencies
† Conservative ‡ Labour ¤ Reform
| Constituency[a] | Electorate[1] | Majority[2][b] | Member of Parliament[2] | Nearest opposition[2] | Map | ||
|---|---|---|---|---|---|---|---|
| Amber Valley CC | 70,625 | 3,554 | Linsey Farnsworth ‡ | Alex Stevenson ¤ |  | ||
| Bolsover CC | 74,680 | 6,323 | Natalie Fleet ‡ | Mark Fletcher † |  | ||
| Chesterfield BC | 70,722 | 10,820 | Toby Perkins ‡ | Ben Flook † |  | ||
| Derby North BC | 71,867 | 8,915 | Catherine Atkinson ‡ | Amanda Solloway † |  | ||
| Derby South BC | 72,067 | 6,002 | Baggy Shanker ‡ | Alan Graves ¤ |  | ||
| Derbyshire Dales CC | 71,435 | 350 | John Whitby ‡ | Sarah Dines † |  | ||
| Erewash CC | 71,986 | 5,859 | Adam Thompson ‡ | Maggie Throup † |  | ||
| High Peak CC | 73,960 | 7,908 | Jon Pearce ‡ | Robert Largan † |  | ||
| Mid Derbyshire CC | 70,085 | 1,878 | Jonathan Davies ‡ | Luke Gardiner † |  | ||
| North East Derbyshire CC | 72,344 | 1,753 | Louise Jones ‡ | Lee Rowley † |  | ||
| South Derbyshire CC | 71,202 | 4,168 | Samantha Niblett ‡ | Heather Wheeler † |  | ||
Boundary changes
Summarize
Perspective
See 2023 Periodic Review of Westminster constituencies for further details.
| Constituency name[a] | Boundaries 2010-2024 | Boundaries 2024–present |
|---|---|---|
 |
 |
For the 2023 Periodic Review of Westminster constituencies, which redrew the constituency map ahead of the 2024 United Kingdom general election, the Boundary Commission for England opted to retain the eleven constituencies in Derbyshire, with minor boundary changes to reflect changes to electoral wards within the county and to bring the electorates within the statutory range.[3] These changes came into effect from the 2024 general election .
The following constituencies were proposed:
Containing electoral wards from Amber Valley
- Amber Valley
- Derbyshire Dales (part)
- Mid Derbyshire (part)
Containing electoral wards from Bolsover
- Bolsover (part)
Containing electoral wards from Chesterfield
Containing electoral wards from Derby
- Derby North
- Derby South
- Mid Derbyshire (part)
Containing electoral wards from Derbyshire Dales
- Derbyshire Dales (part)
Containing electoral wards from Erewash
- Erewash
- Mid Derbyshire (part)
Containing electoral wards from High Peak
Containing electoral wards from North East Derbyshire
- Bolsover (part)
- North East Derbyshire (part)
Containing electoral wards from South Derbyshire
- Derbyshire Dales (part)
- South Derbyshire
Results history
Summarize
Perspective
Primary data source: House of Commons research briefing - General election results from 1918 to 2019[4]
2024
The number of votes cast for each political party who fielded candidates in constituencies comprising Derbyshire in the 2024 general election were as follows:[2]
| Party | Votes | % | Change from 2019 | Seats | Change from 2019 |
|---|---|---|---|---|---|
| Labour | 195,568 | 40.1% | 11 | ||
| Conservative | 133,262 | 27.3% | 0 | ||
| Reform UK | 94,292 | 19.3% | 0 | ||
| Green | 30,338 | 6.2% | 0 | ||
| Liberal Democrats | 24,897 | 5.1% | 0 | ||
| Workers | 5,603 | 1.1% | New | 0 | |
| Others | 3,498 | 0.7% | 0 | ||
| Total | 487,458 | 100.0 | 11 |
Percentage votes
| Election year | 1974
(Feb) |
1974
(Oct) |
1979 | 1983 | 1987 | 1992 | 1997 | 2001 | 2005 | 2010 | 2015 | 2017 | 2019 | 2024 |
|---|---|---|---|---|---|---|---|---|---|---|---|---|---|---|
| Labour | 47.6 | 48.4 | 45.6 | 34.9 | 36.2 | 43.4 | 53.6 | 50.0 | 43.9 | 34.5 | 36.5 | 44.5 | 34.7 | 40.1 |
| Conservative | 37.5 | 33.9 | 40.9 | 41.5 | 43.2 | 41.5 | 29.5 | 31.1 | 30.1 | 36.5 | 39.4 | 48.7 | 52.3 | 27.3 |
| Reform1 | - | - | - | - | - | - | - | - | - | - | - | - | 2.7 | 19.1 |
| Green Party | - | - | - | * | * | * | * | * | 0.6 | 2.8 | 1.2 | 2.6 | 6.2 | |
| Liberal Democrat2 | 14.8 | 17.5 | 13.0 | 22.6 | 20.5 | 14.7 | 13.8 | 17.5 | 21.4 | 21.6 | 5.6 | 3.8 | 7.2 | 5.1 |
| UKIP | - | - | - | - | - | - | * | * | * | 3.2 | 15.4 | 1.6 | * | - |
| Other | - | 0.2 | 0.5 | 1.0 | 0.1 | 0.4 | 3.1 | 1.4 | 4.6 | 3.7 | 0.2 | 0.2 | 0.5 | 1.8 |
1As the Brexit Party in 2019
21974 &1979 - Liberal Party; 1983 & 1987 - SDP-Liberal Alliance
* Included in Other
Seats
| Election year | 1974
(Feb) |
1974
(Oct) |
1979 | 1983 | 1987 | 1992 | 1997 | 2001 | 2005 | 2010 | 2015 | 2017 | 2019 | 2024 |
|---|---|---|---|---|---|---|---|---|---|---|---|---|---|---|
| Labour | 7 | 7 | 6 | 4 | 4 | 4 | 9 | 8 | 8 | 5 | 4 | 5 | 2 | 11 |
| Conservative | 3 | 3 | 4 | 6 | 6 | 6 | 1 | 1 | 1 | 6 | 7 | 6 | 9 | 0 |
| Liberal Democrat1 | 0 | 0 | 0 | 0 | 0 | 0 | 0 | 1 | 1 | 0 | 0 | 0 | 0 | 0 |
| Total | 10 | 10 | 10 | 10 | 10 | 10 | 10 | 10 | 10 | 11 | 11 | 11 | 11 | 11 |
11974 &1979 - Liberal Party; 1983 & 1987 - SDP-Liberal Alliance
Maps
1885-1910
 1885
1885 1886
1886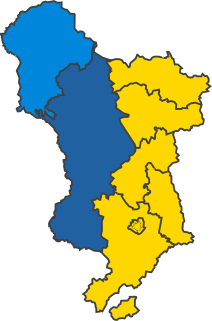 1892
1892 1895
1895 1900
1900 1906
1906 Jan 1910
 Dec 1910


1918-1945
 1918
1918 1922
1922 1923
1923 1924
1924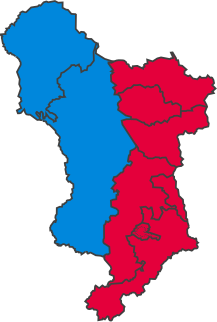 1929
1929 1931
1931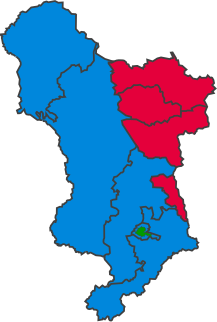 1935
1935 1945
1945


1950-1979
 1950
1950- 1951
 1955
1955 1959
1959- 1964
 1966
1966 1970
1970 1974 Feb
- 1974 Oct
 1979
1979


1983-present
 1983
1983- 1987
- 1992
 1997
1997 2001
2001- 2005
 2010
2010 2015
2015 2017
2017 2019
2019 2024
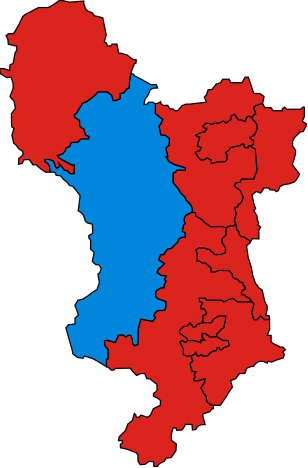
2024


Historical representation by party
Summarize
Perspective
A cell marked → (with a different colour background to the preceding cell) indicates that the previous MP continued to sit under a new party name.
1885 to 1918
Conservative Labour Liberal Liberal-Labour Liberal Unionist
| Constituency | 1885 | 1886 | 87 | 91 | 92 | 1892 | 1895 | 1900 | 04 | 1906 | 07 | 08 | 09 | Jan 1910 | 10 | Dec 1910 | 12 | 13 | 14 | 14 | 15 | 16 |
|---|---|---|---|---|---|---|---|---|---|---|---|---|---|---|---|---|---|---|---|---|---|---|
| Chesterfield | Barnes | → | Bayley | Haslam | → | Kenyon | ||||||||||||||||
| Derby | Roe | Bemrose | Roe | Collins | ||||||||||||||||||
| Vernon-Harcourt | Drage | Bell | → | Thomas | ||||||||||||||||||
| Derbyshire Mid | Jacoby | Hancock | → | |||||||||||||||||||
| Derbyshire North East | Egerton | Bolton | Harvey | → | → | Bowden | ||||||||||||||||
| Derbyshire South | Wardle | Broad | Gretton | Raphael | ||||||||||||||||||
| Derbyshire West | E. Cavendish | → | V. Cavendish | Petty-FitzMaurice | → | |||||||||||||||||
| High Peak | Sidebottom | Partington | Hill-Wood | |||||||||||||||||||
| Ilkeston | Watson | Foster | Seely | |||||||||||||||||||
1918 to 1950
Coalition Liberal (1918-22) / National Liberal (1922-23) Conservative Independent Labour Labour Liberal National Labour
| Constituency | 1918 | 1922 | 1923 | 1924 | 1929 | 31 | 1931 | 33 | 1935 | 36 | 38 | 39 | 42 | 44 | 1945 |
|---|---|---|---|---|---|---|---|---|---|---|---|---|---|---|---|
| Belper | Hancock | Wragg | Lees | Wragg | Brown | ||||||||||
| Chesterfield | Kenyon | Benson | Conant | Benson | |||||||||||
| Clay Cross | Broad | Duncan | Henderson | Holland | Ridley | Neal | |||||||||
| Derby | Thomas | → | Noel-Baker | ||||||||||||
| Green | Roberts | Raynes | Luce | Raynes | Reid | Wilcock | |||||||||
| Derbyshire North East | Holmes | Lee | Whyte | Lee | H. White | ||||||||||
| Derbyshire South | Gregory | Lorimer | Grant | Pole | Emrys-Evans | Champion | |||||||||
| Derbyshire West | C. White | E. W. Cavendish | Hunloke | C. White jnr | → | ||||||||||
| High Peak | Hill-Wood | Law | Molson | ||||||||||||
| Ilkeston | Seely | Oliver | Flint | Oliver | |||||||||||
1950 to 1983
| Constituency | 1950 | 1951 | 1955 | 1959 | 61 | 62 | 1964 | 1966 | 67 | 1970 | Feb 1974 | Oct 1974 | 1979 |
|---|---|---|---|---|---|---|---|---|---|---|---|---|---|
| Belper | Brown | Stewart-Smith | MacFarquhar | Faith | |||||||||
| Bolsover | Neal | Skinner | |||||||||||
| Chesterfield | Benson | Varley | |||||||||||
| Derby North | Wilcock | MacDermot | Whitehead | ||||||||||
| Derby South | Noel-Baker | Johnson | |||||||||||
| Derbyshire North East | White | Swain | Ellis | ||||||||||
| High Peak | Molson | Walder | P. Jackson | Le Marchant | |||||||||
| Ilkeston | Oliver | Fletcher | |||||||||||
| South East Derbyshire | Champion | J. Jackson | Park | Rost | |||||||||
| West Derbyshire | Wakefield | Crawley | Scott-Hopkins | Parris | |||||||||
1983 to present
Conservative Independent Labour Liberal Democrats
| Constituency | 1983 | 84 | 86 | 1987 | 1992 | 1997 | 2001 | 2005 | 2010 | 2015 | 2017 | 19 | 2019 | 2024 |
|---|---|---|---|---|---|---|---|---|---|---|---|---|---|---|
| Amber Valley | Oppenheim | Mallaber | Mills | Farnsworth | ||||||||||
| Bolsover | Skinner | Fletcher | Fleet | |||||||||||
| Chesterfield | Varley | Benn | Holmes | Perkins | ||||||||||
| Derby North | Knight | Laxton | Williamson | Solloway | Williamson | → | Solloway | Atkinson | ||||||
| Derby South | Beckett | Shanker | ||||||||||||
| Erewash | Rost | Knight | Blackman | Lee | Throup | Thompson | ||||||||
| High Peak | Hawkins | Hendry | Levitt | Bingham | George | Largan | Pearce | |||||||
| North East Derbyshire | Ellis | Barnes | Engel | Rowley | Jones | |||||||||
| South Derbyshire | Currie | Todd | Wheeler | Niblett | ||||||||||
| W Derbyshire / D'shire Dales ('10) | Parris | McLoughlin | Dines | Whitby | ||||||||||
| Mid Derbyshire | Latham | Davies | ||||||||||||
See also
Notes
References
Wikiwand - on
Seamless Wikipedia browsing. On steroids.