Top Qs
Timeline
Chat
Perspective
List of busiest airports by passenger traffic
From Wikipedia, the free encyclopedia
Remove ads
Remove ads
Note: For consistency, the Airports Council International's (ACI) annual figures are always used in the final presentation and ranking, even where figures given by airport operators or authorities differ.
This article is about the busiest airports by passenger traffic. For the busiest airports in the world by international passenger traffic, see List of busiest airports by international passenger traffic. For the busiest cities by passenger traffic, see List of busiest city airport systems by passenger traffic.
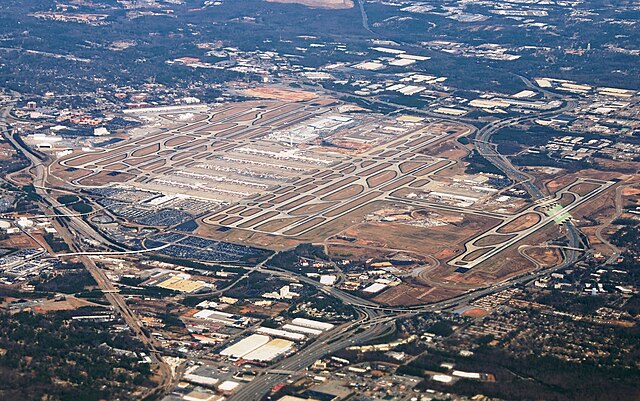
The world's busiest airports by passenger traffic are measured by total passengers provided by the Airports Council International, defined as passengers enplaned plus passengers deplaned plus direct-transit passengers. The world's busiest airport is Hartsfield–Jackson Atlanta International Airport in metropolitan Atlanta, Georgia, which has been the world's busiest airport every year since 1998 with the exception of 2020, when its passenger traffic dipped for a year due to travel restrictions resulting from the COVID-19 pandemic.[1] Atlanta regained the top position in 2021,[2][3] and has held it since. Alternatively, London has the world's busiest city airport system by passenger count.

As of 2024, the United States has the most airports in the top 50 list, with 15 (16 in 2023), following by China having 11 (10 in 2023), while India and Spain have two. In terms of regions, North America has 17 airports in the top 50 (18 in 2023), followed by East Asia with 14 (12 in 2023), Europe with 8 (same as in 2023), Southeast Asia with 5 (6 in 2023), West Asia with three (same as 2023), South Asia with two (same as 2023), and South America with one (same as 2023).
Remove ads
2024 statistics
More information Rank, Airport ...
Close
Remove ads
2023 statistics
Source: 2023 report from the Port Authority of New York and New Jersey[41]
More information Rank, Airport ...
Close
Remove ads
2022 statistics
Summarize
Perspective
Source: 2022 report from the Port Authority of New York and New Jersey[42]
More information Rank, Airport ...
Close
Remove ads
2021 statistics
Summarize
Perspective
Source: 2021 report from the Port Authority of New York and New Jersey[3]
More information Rank, Airport ...
Close
Remove ads
2020 statistics
Summarize
Perspective
Source: 2020 report from the Port Authority of New York and New Jersey.[43]
More information Rank, Airport ...
Close
Remove ads
2019 statistics
Summarize
Perspective
Figures as reported by airports are as follows:[44][45]
More information Rank, Airport ...
Close
Remove ads
2018 statistics
Summarize
Perspective
Figures as reported by airports are as follows:[46][47]
More information Rank, Airport ...
Close
Remove ads
2017 statistics
Summarize
Perspective
Airports Council International's full-year figures are as follows:[48][49][50]
More information Rank, Airport ...
Close
Remove ads
2016 statistics
Summarize
Perspective
Airports Council International's full-year figures are as follows:[51]
More information Rank, Airport ...
Close
2010–2015
2000–2009
See also
References
External links
Wikiwand - on
Seamless Wikipedia browsing. On steroids.
Remove ads
