Gateshead Metropolitan Borough Council elections
Local government elections in Tyne and Wear, England From Wikipedia, the free encyclopedia
Gateshead Metropolitan Borough Council elections are generally held three years out of every four, with a third of the council being elected each time. Gateshead Metropolitan Borough Council (which styles itself "Gateshead Council") is the local authority for the metropolitan borough of Gateshead in Tyne and Wear, England.
Council elections
Summarize
Perspective
Summary of recent election results:
| Year | Labour | Lib Dem | Totals |
|---|---|---|---|
| 2023 | 49 | 17 | 66 |
| 2022 | 51 | 15 | 66 |
| 2019 | 52 | 14 | 66 |
| 2018 | 54 | 12 | 66 |
| 2016 | 54 | 12 | 66 |
| 2015 | 55 | 11 | 66 |
| 2014 | 55 | 11 | 66 |
- 1998 Gateshead Metropolitan Borough Council election
- 1999 Gateshead Metropolitan Borough Council election
- 2000 Gateshead Metropolitan Borough Council election
- 2002 Gateshead Metropolitan Borough Council election
- 2003 Gateshead Metropolitan Borough Council election
- 2004 Gateshead Metropolitan Borough Council election (whole council elected after boundary changes)[1]
- 2006 Gateshead Metropolitan Borough Council election
- 2007 Gateshead Metropolitan Borough Council election
- 2008 Gateshead Metropolitan Borough Council election
- 2010 Gateshead Metropolitan Borough Council election
- 2011 Gateshead Metropolitan Borough Council election
- 2012 Gateshead Metropolitan Borough Council election
- 2014 Gateshead Metropolitan Borough Council election
- 2015 Gateshead Metropolitan Borough Council election
- 2016 Gateshead Metropolitan Borough Council election
- 2018 Gateshead Metropolitan Borough Council election
- 2019 Gateshead Metropolitan Borough Council election
- 2021 Gateshead Metropolitan Borough Council election
- 2022 Gateshead Metropolitan Borough Council election
- 2023 Gateshead Metropolitan Borough Council election
- 2024 Gateshead Metropolitan Borough Council election
Results maps
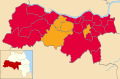 2018 results map
 2019 results map
 2021 results map
 2022 results map
 2023 results map
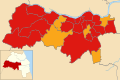 2024 results map


Changes between elections
1998-2002
| Party | Candidate | Votes | % | ±% | |
|---|---|---|---|---|---|
| Liberal Democrats | 1,598 | 83.6 | +13.0 | ||
| Labour | 314 | 16.4 | −7.0 | ||
| Majority | 1,284 | 67.2 | |||
| Turnout | 1,912 | ||||
| Liberal Democrats hold | Swing | ||||
| Party | Candidate | Votes | % | ±% | |
|---|---|---|---|---|---|
| Labour | 780 | 63.9 | −6.4 | ||
| Liberal Democrats | 440 | 36.1 | +19.2 | ||
| Majority | 340 | 27.8 | |||
| Turnout | 1,220 | 21.3 | |||
| Labour hold | Swing | ||||
| Party | Candidate | Votes | % | ±% | |
|---|---|---|---|---|---|
| Labour | Keith Wood | 2,649 | 68.8 | +4.5 | |
| Conservative | Raymnond Swadling | 604 | 15.7 | −4.8 | |
| Liberal Democrats | Glynis Goodwill | 599 | 15.6 | +0.3 | |
| Majority | 2,045 | 53.1 | |||
| Turnout | 3,852 | 56.4 | +28.0 | ||
| Labour hold | Swing | ||||
2002-2006
| Party | Candidate | Votes | % | ±% | |
|---|---|---|---|---|---|
| Labour | Paul McNally | 848 | 69.2 | +6.3 | |
| Liberal Democrats | David Lucas | 208 | 17.0 | +0.2 | |
| BNP | Keith McFarlane | 96 | 7.8 | −2.3 | |
| Conservative | Steve Wraith | 74 | 6.0 | −4.3 | |
| Majority | 640 | 52.1 | |||
| Turnout | 1,226 | 20.3 | |||
| Labour hold | Swing | ||||
2006-2010
| Party | Candidate | Votes | % | ±% | |
|---|---|---|---|---|---|
| Labour | Pauline Dillon | 694 | 54.9 | +0.7 | |
| Liberal Democrats | Michael Ruddy | 269 | 21.3 | +3.6 | |
| BNP | Andrew Swaddle | 226 | 17.9 | +4.6 | |
| Conservative | 76 | 6.0 | −3.0 | ||
| Majority | 425 | 33.6 | |||
| Turnout | 1,265 | 21.1 | |||
| Labour hold | Swing | ||||
| Party | Candidate | Votes | % | ±% | |
|---|---|---|---|---|---|
| Labour | Gary Haley | 793 | 62.1 | +7.7 | |
| Liberal Democrats | 285 | 22.3 | +1.6 | ||
| BNP | 131 | 10.3 | −4.3 | ||
| Conservative | 69 | 5.4 | −5.0 | ||
| Majority | 508 | 39.8 | |||
| Turnout | 1,278 | 20.3 | |||
| Labour hold | Swing | ||||
| Party | Candidate | Votes | % | ±% | |
|---|---|---|---|---|---|
| Liberal Democrats | John McClurey | 1,612 | 72.5 | +4.4 | |
| Labour | Elaine Dobson | 394 | 17.7 | +4.2 | |
| Conservative | John Robertson | 217 | 9.8 | −8.6 | |
| Majority | 1,218 | 54.8 | |||
| Turnout | 2,223 | 32.3 | |||
| Liberal Democrats hold | Swing | ||||
| Party | Candidate | Votes | % | ±% | |
|---|---|---|---|---|---|
| Labour | Lynne Caffrey | 1,221 | 53.2 | −3.9 | |
| Liberal Democrats | Raymond Callender | 898 | 39.1 | +12.5 | |
| Conservative | Bill Thorkildsen | 177 | 7.7 | −8.6 | |
| Majority | 323 | 14.1 | |||
| Turnout | 2,296 | 32.1 | |||
| Labour hold | Swing | ||||
2010-2014
| Party | Candidate | Votes | % | ±% | |
|---|---|---|---|---|---|
| Labour | Eileen McMaster | 1,120 | 69.3 | +15.2 | |
| Liberal Democrats | Michael Ruddy | 298 | 18.4 | −5.0 | |
| BNP | Derrick Robson | 101 | 6.3 | −0.7 | |
| Conservative | Val Bond | 97 | 6.0 | −6.5 | |
| Majority | 822 | 50.9 | |||
| Turnout | 1,616 | ||||
| Labour hold | Swing | ||||
| Party | Candidate | Votes | % | ±% | |
|---|---|---|---|---|---|
| Labour | Denise Robson | 793 | 68.8 | +10.4 | |
| Liberal Democrats | Laura Turner | 196 | 17.0 | −5.2 | |
| Conservative | Alan Bond | 86 | 7.5 | −5.9 | |
| BNP | Janet Robson | 77 | 6.7 | +0.7 | |
| Majority | 597 | 51.8 | |||
| Turnout | 1,152 | ||||
| Labour hold | Swing | ||||
2014-2018
| Party | Candidate | Votes | % | ±% | |
|---|---|---|---|---|---|
| Labour | Dave Bradford | 1,066 | 59.1 | −3.6 | |
| UKIP | Ray Tolley | 282 | 15.6 | +1.2 | |
| Liberal Democrats | Amelia Ord | 221 | 12.3 | +7.9 | |
| Conservative | John Lathan | 156 | 8.6 | −2.3 | |
| Green | Dave Castleton | 79 | 4.4 | −3.2 | |
| Majority | 784 | 43.5 | |||
| Turnout | 1,804 | ||||
| Labour hold | Swing | ||||
2022-2026
| Party | Candidate | Votes | % | ±% | |
|---|---|---|---|---|---|
| Labour | Robert Waugh | 320 | 30.6 | −18.4 | |
| Liberal Democrats | Jonathan Aibi | 255 | 24.4 | +16.8 | |
| Green | Rachel Cabral | 253 | 24.2 | −8.5 | |
| Reform UK | David Ayre | 166 | 15.9 | +15.9 | |
| Conservative | Paul Sterling | 53 | 5.1 | −5.6 | |
| Majority | 65 | 6.2 | |||
| Turnout | 1,047 | ||||
| Labour hold | Swing | ||||
| Party | Candidate | Votes | % | ±% | |
|---|---|---|---|---|---|
| Liberal Democrats | Susan Craig | 902 | 64.6 | +6.7 | |
| Labour | Jeff Bowe | 285 | 20.4 | −6.3 | |
| Conservative | Robert Ableson | 137 | 9.8 | +0.9 | |
| Green | Pat Chanse | 72 | 5.2 | −1.3 | |
| Majority | 617 | 44.2 | |||
| Turnout | 1,396 | ||||
| Liberal Democrats hold | Swing | ||||
References
External links
Wikiwand - on
Seamless Wikipedia browsing. On steroids.