Electoral history of George Wallace
List of elections featuring George Wallace as a candidate From Wikipedia, the free encyclopedia

Electoral history of George Wallace, 45th governor of Alabama (1963–1967, 1971–1979, 1983–1987), 1968 American Independent Party presidential nominee and candidate for 1964, 1972 and 1976 Democratic Party presidential nomination
| Party | Candidate | Votes | % | |
|---|---|---|---|---|
| Democratic | George Wallace | 1,526 | 100% | |
| Party | Candidate | Votes | % | |
|---|---|---|---|---|
| Democratic | John M. Patterson | 196,859 | 31.8% | |
| Democratic | George Wallace | 162,435 | 26.3% | |
| Democratic | Jimmy Faulkner | 91,512 | 14.8% | |
| Democratic | A. W. Todd | 59,240 | 9.6% | |
| Democratic | Laurie C. Battle | 38,955 | 6.3% | |
| Democratic | George Hawkins | 24,332 | 3.9% | |
| None | Others | 45,349 | ||
| Party | Candidate | Votes | % | |
|---|---|---|---|---|
| Democratic | John M. Patterson | 315,353 | 55.7% | |
| Democratic | George Wallace | 250,451 | 44.3% | |
| Party | Candidate | Votes | % | |
|---|---|---|---|---|
| Democratic | George Wallace | 207,062 | 32.5% | |
| Democratic | Ryan DeGraffenried Sr. | 160,704 | 25.2% | |
| Democratic | Jim Folsom | 159,640 | 25.1% | |
| Democratic | MacDonald Gallion | 80,374 | 12.6% | |
| Democratic | Bull Connor | 23,019 | 3.6% | |
| Democratic | J. Bruce Henderson | 3,666 | 0.6% | |
| Democratic | Wayne Jennings | 1,946 | 0.31 | |
| Democratic | Albert Boutwell | 862 | 0.1 | |
| Party | Candidate | Votes | % | |
|---|---|---|---|---|
| Democratic | George Wallace | 340,730 | 55.9% | |
| Democratic | Ryan DeGraffenried Sr. | 269,122 | 44.1% | |
| Party | Candidate | Votes | % | |
|---|---|---|---|---|
| Democratic | George Wallace | 303,987 | 96.27% | |
| Independent | Frank P. Walls | 11,789 | 3.7% | |
1964 California Democratic Party presidential primary:[6]
- Pat Brown – 1,693,813 (27.26%)
- Lyndon B. Johnson (inc.) – 1,106,999 (17.82%)
- Sam Yorty – 798,431 (12.85%)
- George Wallace – 672,984 (10.83%)
- John W. Reynolds – 522,405 (8.41%)
- Albert S. Porter – 493,619 (7.94%)
- Matthew E. Welsch – 376,023 (6.05%)
- Daniel Brewster – 267,106 (4.30%)
- Jennings Randolph – 131,432 (2.12%)
- Unpledged delegates – 81,614 (1.31%)
- Robert F. Kennedy – 36,258 (0.58%)
Total primaries popular vote
1968 Democratic presidential primaries:[7]
- Eugene McCarthy – 2,914,933 (38.73%)
- Robert F. Kennedy – 2,305,148 (30.63%)
- Stephen M. Young – 549,140 (7.30%)
- Lyndon B. Johnson (inc.) – 383,590 (5.10%)
- Thomas C. Lynch – 380,286 (5.05%)
- Roger D. Branigin – 238,700 (3.17%)
- George Smathers – 236,242 (3.14%)
- Hubert Humphrey – 166,463 (2.21%)
- Unpledged delegates – 161,143 (2.14%)
- Scott Kelly – 128,899 (1.71%)
- George Wallace – 34,489 (0.46%)
1968 Democratic National Convention (presidential tally):[8]
- Hubert Humphrey – 1,760 (67.43%)
- Eugene McCarthy – 601 (23.03%)
- George McGovern – 147 (5.63%)
- Channing E. Phillips – 68 (2.61%)
- Daniel K. Moore – 18 (0.69%)
- Ted Kennedy – 13 (0.50%)
- Paul Bryant – 1 (0.04%)
- James H. Gray – 1 (0.04%)
- George Wallace – 1 (0.04%)
| Party | Candidate | Votes | % | |
|---|---|---|---|---|
| Republican | Richard Nixon/ Spiro Agnew | 31,783,783 | 43.4% | |
| Democratic | Hubert Humphrey/Edmund Muskie | 31,271,839 | 42.7% | |
| American Independent | George Wallace/Curtis LeMay | 9,901,118 | 13.5% | |
| Independent | Eugene McCarthy | 25,634 | 0% | |
| None | Others | 243,258 | 0.3% | |
| Party | Candidate | Votes | % | |
|---|---|---|---|---|
| Democratic | Albert Brewer (incumbent) | 428,146 | 42.0% | |
| Democratic | George Wallace | 416,443 | 40.8% | |
| Democratic | Charles Woods | 149,987 | 14.7% | |
| Democratic | Asa Carter | 15,441 | 1.5% | |
| Democratic | Jim Folsom | 4,123 | 0.4% | |
| Democratic | Coleman Brown | 2,836 | 0.3% | |
| Democratic | Ralph "Shorty" Price | 2,804 | 0.3% | |
| Party | Candidate | Votes | % | |
|---|---|---|---|---|
| Democratic | George Wallace | 559,832 | 51.6% | |
| Democratic | Albert Brewer (incumbent) | 525,951 | 48.4% | |
| Party | Candidate | Votes | % | |
|---|---|---|---|---|
| Democratic | George Wallace | 637,046 | 74.5% | |
| National Democratic (Ala.) | John Cashin | 125,491 | 14.7% | |
| Independent | A.C. Walker | 75,679 | 8.9% | |
| Prohibition | Jerome B. Couch | 9,705 | 1.14% | |
| Independent | Menter G. Walker | 3,534 | 0.4% | |
| Whig | John Watts | 3,497 | 0.4% | |
Total primaries popular vote
1972 Democratic Party presidential primaries:[12]
- Hubert Humphrey – 4,121,372 (25.77%)
- George McGovern – 4,053,451 (25.34%)
- George Wallace – 3,755,424 (23.48%)
- Edmund Muskie – 1,840,217 (11.51%)
- Eugene McCarthy – 553,990 (3.46%)
- Henry M. Jackson – 505,198 (3.16%)
- Shirley Chisholm – 430,703 (2.69%)
- Terry Sanford – 331,415 (2.07%)
- John V. Lindsay – 196,406 (1.23%)
- Sam Yorty – 79,446 (0.50%)
- Wilbur Mills – 37,401 (0.23%)
- Walter Fauntroy – 21,217 (0.13%)
- Unpledged delegates – 19,533 (0.12%)
- Ted Kennedy – 16,693 (0.10%)
- Vance Hartke – 11,798 (0.07%)
- Patsy Mink – 8,286 (0.05%)
1972 Democratic National Convention (presidential tally):[13]
- George McGovern – 1,729 (57.37%)
- Henry M. Jackson – 525 (17.42%)
- George Wallace – 382 (12.67%)
- Shirley Chisholm – 152 (5.04%)
- Terry Sanford – 78 (2.59%)
- Hubert Humphrey – 67 (2.22%)
- Wilbur Mills – 34 (1.13%)
- Edmund Muskie – 25 (0.83%)
- Ted Kennedy – 13 (0.43%)
- Wayne L. Hays – 5 (0.17%)
- Eugene McCarthy – 2 (0.07%)
- Ramsey Clark – 1 (0.03%)
- Walter Mondale – 1 (0.03%)
1972 Democratic National Convention (vice presidential tally):[14]
- Thomas Eagleton – 1,742 (59.07%)
- Frances Farenthold – 405 (13.73%)
- Mike Gravel – 226 (7.66%)
- Endicott Peabody – 108 (3.66%)
- Clay Smothers – 74 (2.51%)
- Birch Bayh – 62 (2.10%)
- Peter Rodino – 57 (1.93%)
- Jimmy Carter – 30 (1.02%)
- Shirley Chisholm – 20 (0.68%)
- Moon Landrieu – 19 (0.64%)
- Edward T. Breathitt – 18 (0.61%)
- Ted Kennedy – 15 (0.51%)
- Fred R. Harris – 14 (0.48%)
- Richard G. Hatcher – 11 (0.37%)
- Harold E. Hughes – 10 (0.34%)
- Joseph M. Montoya – 9 (0.31%)
- William L. Guy – 8 (0.27%)
- Adlai Stevenson III – 8 (0.27%)
- Robert Bergland – 5 (0.17%)
- Hodding Carter – 5 (0.17%)
- Cesar Chavez – 5 (0.17%)
- Wilbur Mills – 5 (0.17%)
- Wendell Anderson – 4 (0.14%)
- Stanley Arnold – 4 (0.14%)
- Ron Dellums – 4 (0.14%)
- John J. Houlihan – 4 (0.14%)
- Roberto A. Mondragon – 4 (0.14%)
- Reubin O'Donovan Askew – 3 (0.10%)
- Herman Badillo – 3 (0.10%)
- Eugene McCarthy – 3 (0.10%)
- Claiborne Pell – 3 (0.10%)
- Terry Sanford – 3 (0.10%)
- Ramsey Clark – 2 (0.07%)
- Richard J. Daley – 2 (0.07%)
- John DeCarlo – 2 (0.07%)
- Ernest Gruening – 2 (0.07%)
- Roger Mudd – 2 (0.07%)
- Edmund Muskie – 2 (0.07%)
- Claude Pepper – 2 (0.07%)
- Abraham Ribicoff – 2 (0.07%)
- Pat Taylor – 2 (0.07%)
- Leonard F. Woodcock – 2 (0.07%)
- Bruno Agnoli – 2 (0.07%)
- Ernest Albright – 1 (0.03%)
- William A. Barrett – 1 (0.03%)
- Daniel Berrigan – 1 (0.03%)
- Phillip Berrigan – 1 (0.03%)
- Julian Bond – 1 (0.03%)
- Hargrove Bowles – 1 (0.03%)
- Archibald Burton – 1 (0.03%)
- Phillip Burton – 1 (0.03%)
- William Chappell – 1 (0.03%)
- Lawton Chiles – 1 (0.03%)
- Frank Church – 1 (0.03%)
- Robert Drinan – 1 (0.03%)
- Nick Galifianakis – 1 (0.03%)
- John Goodrich – 1 (0.03%)
- Michael Griffin – 1 (0.03%)
- Martha Griffiths – 1 (0.03%)
- Charles Hamilton – 1 (0.03%)
- Patricia Harris – 1 (0.03%)
- Jim Hunt – 1 (0.03%)
- Daniel Inouye – 1 (0.03%)
- Henry M. Jackson – 1 (0.03%)
- Robery Kariss – 1 (0.03%)
- Allard K. Lowenstein – 1 (0.03%)
- Mao Zedong – 1 (0.03%)
- Eleanor McGovern – 1 (0.03%)
- Martha Mitchell – 1 (0.03%)
- Ralph Nader – 1 (0.03%)
- George Norcross – 1 (0.03%)
- Jerry Rubin – 1 (0.03%)
- Fred Seaman – 1 (0.03%)
- Joe Smith – 1 (0.03%)
- Benjamin Spock – 1 (0.03%)
- Patrick Tavolacci – 1 (0.03%)
- George Wallace – 1 (0.03%)
American Independent Party National Convention, 1972 (presidential tally):[15]
- John G. Schmitz – 330 (71.74%)
- George L. Garfield – 56 (12.17%)
- Allen Grear – 26 (5.65%)
- Thomas J. Anderson – 24 (5.22%)
- Richard B. Kay – 16 (3.48%)
- George Wallace – 8 (1.74%)
| Party | Candidate | Votes | % | |
|---|---|---|---|---|
| Democratic | George Wallace (incumbent) | 536,235 | 64.8% | |
| Democratic | Gene McLain | 249,035 | 30.1% | |
| Democratic | Jim Folsom | 24,821 | 3% | |
| Democratic | Ralph "Shorty" Price | 9,834 | 1.19% | |
| Democratic | Thomas Robinson | 7,726 | 0.9% | |
| Party | Candidate | Votes | % | |
|---|---|---|---|---|
| Democratic | George Wallace (incumbent) | 497,574 | 83.2% | |
| Republican | Elvin McCary | 88,381 | 14.8% | |
| Prohibition | Jim Partain | 12,350 | 2.1% | |
1976 Democratic presidential primaries:[18]
- Jimmy Carter – 6,235,609 (39.19%)
- Jerry Brown – 2,449,374 (15.39%)
- George Wallace – 1,955,388 (12.29%)
- Mo Udall – 1,611,754 (10.13%)
- Henry M. Jackson – 1,134,375 (7.13%)
- Frank Church – 830,818 (5.22%)
- Robert Byrd – 340,309 (2.14%)
- Sargent Shriver – 304,399 (1.91%)
- Unpledged delegates – 283,437 (1.78%)
- Ellen McCormack – 238,027 (1.50%)
- Fred R. Harris – 234,568 (1.47%)
- Milton Shapp – 88,254 (0.56%)
- Birch Bayh – 86,438 (0.54%)
- Hubert Humphrey – 61,992 (0.39%)
- Ted Kennedy – 19,805 (0.12%)
- Arthur O. Blessitt – 8,717 (0.06%)
- Lloyd Bentsen – 4,046 (0.03%)
1976 Democratic National Convention (presidential tally):[19]
- Jimmy Carter – 2,239 (74.48%)
- Mo Udall – 330 (10.98%)
- Jerry Brown – 301 (10.01%)
- George Wallace – 57 (1.90%)
- Ellen McCormack – 22 (0.73%)
- Frank Church – 19 (0.63%)
- Hubert Humphrey – 10 (0.33%)
- Henry M. Jackson – 10 (0.33%)
- Fred R. Harris – 9 (0.30%)
- Milton Shapp – 2 (0.07%)
- Robert Byrd – 1 (0.03%)
- Cesar Chavez – 1 (0.03%)
- Leon Jaworski – 1 (0.03%)
- Barbara Jordan – 1 (0.03%)
- Ted Kennedy – 1 (0.03%)
- Jennings Randolph – 1 (0.03%)
- Fred Stover – 1 (0.03%)
1976 Democratic National Convention (vice presidential tally):[20]
- Walter Mondale – 2,817 (94.28%)
- Carl Albert – 36 (1.21%)
- Barbara Jordan – 25 (0.84%)
- Ron Dellums – 20 (0.67%)
- Henry M. Jackson – 16 (0.54%)
- Gary Benoit – 12 (0.40%)
- Frank Church – 11 (0.37%)
- Fritz Efaw – 11 (0.37%)
- Peter Flaherty – 11 (0.37%)
- George Wallace – 6 (0.20%)
- Allard Lowenstein – 5 (0.17%)
- Edmund Muskie – 4 (0.13%)
- Philip Hart – 2 (0.07%)
- Thomas E. Morgan – 2 (0.07%)
- Mo Udall – 2 (0.07%)
- Wendell Anderson – 1 (0.03%)
- Al Castro – 1 (0.03%)
- Fred R. Harris – 1 (0.03%)
- Ernest Hollings – 1 (0.03%)
- Peter Rodino – 1 (0.03%)
- Daniel Schorr – 1 (0.03%)
- Josephnie Smith – 1 (0.03%)
- Hunter S. Thompson – 1 (0.03%)
Democratic primary for Governor of Alabama, 1982:[21]
- George Wallace – 425,469 (42.53%)
- George McMillan – 296,271 (29.62%)
- Joe McCorquodale – 250,614 (25.05%)
- Jim Folsom – 17,333 (1.73%)
- Reuben McKinley – 10,617 (1.06%)
Democratic primary for Governor of Alabama runoff, 1982:[22]
- George Wallace – 512,203 (51.19%)
- George McMillan – 488,444 (48.81%)
1982 Alabama gubernatorial election:[23]
- George Wallace (D) – 650,538 (57.64%)
- Emory M. Folmar (R) – 440,815 (39.06%)
- Leo Suiter (Alabama Conservative) – 17,936 (1.59%)
- Henry Klingler (LBT) – 7,671 (0.68%)
- John Jackson (Alabama National Democrat) – 4,693 (0.42%)
- John Dyer (Prohibition) – 4,364 (0.39%)
- Martin J. Boyers (Socialist Workers) – 2,578 (0.23%)
Gallery
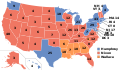 United States presidential election, 1968
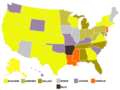 1972 Democratic presidential primaries
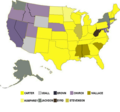 1976 Democratic presidential primaries


References
Wikiwand - on
Seamless Wikipedia browsing. On steroids.