Demographics of Glasgow
Demographics of the most populous city in Scotland From Wikipedia, the free encyclopedia

Glasgow is the most populous city in Scotland and the fourth most populous city in the United Kingdom.

This article contains too many charts, tables, or data that lack context or explanation. (November 2022) |
| Demographics of Glasgow | |
|---|---|
Population pyramid of Glasgow | |
| Population | 593,245 (2011) |
| Density | 3,390/km2 (8,780/sq mi). |

Population
Glasgow's total population, according to the 2011 UK census, was 593,245. The population density was 3,390/km2 (8,780/sq mi).
Ethnicity
Summarize
Perspective
The following table shows the ethnic group of respondents in the previous four censuses in Glasgow alongside two estimates.
A Home Office report officially estimated that the 'coloured' population of Glasgow in 1958 was likely around 3,000 to 5,000, the majority being Asian (2,000 Pakistanis and 2,000 Indians).[1]
| Ethnic Group | 1971 estimations | 1981 estimations[2] | 1991 census[3][4] | 2001 census[5] | 2011 census[6] | 2022 census[7] | ||||||
|---|---|---|---|---|---|---|---|---|---|---|---|---|
| Number | % | Number | % | Number | % | Number | % | Number | % | Number | % | |
| White: Total | – | – | 729,092 | 97.9% | 641,336 | 96.75% | 546,359 | 94.55% | 524,561 | 88.42% | 501,029 | 80.71% |
| White: Scottish | – | – | – | – | – | – | 503,614 | 87.15% | 466,241 | 78.59% | 416,634 | 67.12% |
| White: Other British | – | – | – | – | – | – | 20,934 | 3.62% | 24,154 | 4.07% | 35,011 | 5.64% |
| White: Irish | – | – | – | – | 10,384 | 1.56% | 11,467 | 1.98% | 11,228 | 1.89% | 11,130 | 1.79% |
| White: Gypsy/Traveller[a] | – | – | – | – | – | – | – | – | 407 | 0.07% | 201 | 0.03% |
| White: Polish[a] | – | – | – | – | – | – | – | – | 8,406 | 1.42% | 12,183 | 1.96% |
| White: Other | – | – | – | – | – | – | 10,344 | 1.79% | 14,125 | 2.38% | 25,870 | 4.17% |
| Asian, Asian Scottish or Asian British: Total | 12,000[8] | 1.3% | – | – | 18,242 | 2.75% | 25,636 | 4.44% | 47,758 | 8.05% | 68,793 | 11.08% |
| Asian, Asian Scottish or Asian British: Indian | – | – | – | – | 3,374 | 0.5% | 4,173 | 0.72% | 8,640 | 1.46% | 13,990 | 2.25% |
| Asian, Asian Scottish or Asian British: Pakistani | – | – | – | – | 10,945 | 1.65% | 15,330 | 2.65% | 22,405 | 3.78% | 30,912 | 4.98% |
| Asian, Asian Scottish or Asian British: Bangladeshi | – | – | – | – | 191 | – | 237 | 0.04% | 458 | 0.08% | 954 | 0.15% |
| Asian, Asian Scottish or Asian British: Chinese | – | – | – | – | 2,780 | 0.41% | 3,876 | 0.67% | 10,689 | 1.80% | 14,300 | 2.30% |
| Asian, Asian Scottish or Asian British: Asian Other | – | – | – | – | 952 | 0.14% | 2,020 | 0.35% | 5,566 | 0.94% | 8,640 | 1.39% |
| Black, Black Scottish or Black British[a] | – | – | – | – | – | – | 1,792 | 0.31% | – | – | – | – |
| African: Total | – | – | – | – | 489 | – | – | – | 12,440 | 2.10% | 22,272 | 3.59% |
| African: African, African Scottish or African British | – | – | – | – | 489 | – | – | – | 12,298 | 2.07% | 2,798 | 0.45% |
| African: Other African | – | – | – | – | – | – | – | – | 142 | 0.02% | 19,474 | 3.14% |
| Caribbean or Black: Total | – | – | – | – | 709 | – | – | – | 1,806 | 0.30% | 1,471 | 0.24% |
| Caribbean | – | – | – | – | 220 | – | – | 783 | 0.13% | 335 | 0.05% | |
| Black | – | – | – | – | – | – | – | – | 820 | 0.14% | 96 | 0.02% |
| Caribbean or Black: Other | – | – | – | – | 489 | – | – | 203 | 0.03% | 1,033 | 0.17% | |
| Mixed or multiple ethnic groups: Total | – | – | – | – | – | – | 2,046 | 0.35% | 2,879 | 0.49% | 10,624 | 1.71% |
| Other: Total | – | – | – | – | 1,840 | 0.27% | 2,036 | 0.35% | 3,801 | 0.64% | 16,571 | 2.67% |
| Other: Arab[a] | – | – | – | – | – | – | – | – | 2,631 | 0.44% | 8,671 | 1.40% |
| Other: Any other ethnic group | – | – | – | – | 1,840 | 0.27% | 2,036 | 0.35% | 1,170 | 0.20% | 7,903 | 1.27% |
| Non-White: Total | – | – | 15,286 | 2.1% | 21,517 | 3.25% | 31,510 | 5.45% | 68,684 | 11.58% | 119,726 | 19.29% |
| Total: | – | – | 744,378 | 100% | 662,853 | 100% | 577,869 | 100% | 593,245 | 100% | 620,756 | 100% |
Distribution of ethnic groups in Glasgow according to the 2011 census.
 White
White White-Scottish
 White-Other British
 White-Irish
 White-Polish
 White-Other
 Asian
Asian Asian-Indian
 Asian-Pakistani
 Asian-Bangladeshi
 Asian-Chinese
 African
 Caribbean or Black
 Other-Arab


Country of Birth
Summarize
Perspective
The proportion of people residing in Glasgow born outside the UK was 19.1% in 2022, compared with 12.2% in 2011 and 5.7% in 2001. Below are the fifteen largest overseas-born groups in Glasgow according to the 2022 census, alongside the two previous censuses.[9]
| Country of birth | 2022 | 2011 | 2001 |
|---|---|---|---|
| 12,508 | 9,319 | 5,995 | |
| 10,601 | 7,577 | 281 | |
| 10,212 | 5,789 | 2,364 | |
| 7,857 | 5,513 | 730 | |
| 5,448 | 2,761 | 199 | |
| 3,964 | 1,866 | 1,122 | |
| 3,643 | 4,339 | 5,113 | |
| 3,189 | 1,028 | 674 | |
| 2,647 | 1,136 | 592 | |
| 2,290 | 722 | 367 | |
| 2,262 | 1,948 | 1,379 | |
| 2,095 | 1,430 | 1,406 | |
| 2,029 | 1,191 | 750 | |
| 1,830 | 460 | 43 | |
| 1,688 | 1,077 | 701 | |
| Overall – all overseas-born | 118,819 | 72,607 | 32,690 |
The country of birth of Glasgow for 1981 is as follows;
| Country of Birth | Year | |
|---|---|---|
| 1981[10] | ||
| Number | % | |
| 728,050 | 96.4% | |
| 19,592 | 2.6% | |
| 701,054 | 92.8% | |
| 921 | ||
| – | – | |
| 6,483 | 0.9% | |
| Europe (non-UK) | 12,778 | 1.7% |
| 9,341 | ||
| Other EEC | 2,334 | |
| Other Europe | 1,103 | |
| Asia and Middle East | 8,286 | 1.1% |
| 2,624 | ||
| 3,532 | ||
| 152 | ||
| Far East | 1,978 | |
| Middle East | – | – |
| Africa | 1,227 | 0.2% |
| North America | – | – |
| South America | – | – |
| Oceania | – | – |
| Other: New Commonwealth[n 1] | 356 | |
| Other: Old Commonwealth[n 2] | 1,479 | 0.2% |
| Other: | 3,012 | 0.4% |
| Total | 755,377 | 100% |
- Used as main option for when no other options are given, for example in 1971. This group contains all for Canada, Australia and New Zealand
- Used as a conglomerate for New Commonwealth for when there are no other options as for example in 1971. This group contains all for remenents of the British Empire after 1945 (if not already indicated).
Languages
The languages other than English used at home in Glasgow according to the 2011 census are shown below.[11]
| Language | Usual residents aged 3+ | Proportion |
|---|---|---|
| English only | 496,027 | 86.62% |
| Gaelic | 2,305 | 0.40% |
| Scots | 2,826 | 0.49% |
| British Sign Language | 1,717 | 0.30% |
| Polish | 7,379 | 1.29% |
| Other | 62,379 | 10.89% |
Religion
The following table shows the religion of respondents in the 2001, 2011 and 2022 censuses in Glasgow.
| Current religion | 2001[5] | 2011[12] | 2022[13] | |||
|---|---|---|---|---|---|---|
| Number | % | Number | % | Number | % | |
| Christianity | 374,393 | 64.79% | 322,954 | 54.44% | 240,337 | 38.72% |
| –Roman Catholic | 168,733 | 29.20% | 161,685 | 27.25% | 128,743 | 20.74% |
| –Church of Scotland | 182,172 | 31.52% | 136,889 | 23.07% | 82,585 | 13.30% |
| –Other Christian | 23,488 | 4.06% | 24,380 | 4.11% | 29,009 | 4.67% |
| Islam | 17,792 | 3.08% | 32,117 | 5.41% | 48,766 | 7.86% |
| Hinduism | 1,209 | 0.21% | 4,074 | 0.69% | 8,166 | 1.32% |
| Buddhism | 1,194 | 0.21% | 2,570 | 0.43% | 2,854 | 0.46% |
| Sikhism | 2,374 | 0.41% | 3,149 | 0.53% | 3,456 | 0.56% |
| Judaism | 1,083 | 0.19% | 897 | 0.15% | 973 | 0.16% |
| Paganism[b] | — | — | — | — | 2,001 | 0.32% |
| Other religion | 3,799 | 0.66% | 1,599 | 0.27% | 1,817 | 0.29% |
| No religion | 131,189 | 22.70% | 183,835 | 30.99% | 268,327 | 43.23% |
| Religion not stated | 44,836 | 7.76% | 42,050 | 7.09% | 44,076 | 7.10% |
| No religion/Not stated total | 176,025 | 30.46% | 225,885 | 38.08% | 312,403 | 50.33% |
| Total population | 577,869 | 100.00% | 593,245 | 100.00% | 620,756 | 100.00% |
Distribution of religions in Glasgow according to the 2011 census.
 Christianity
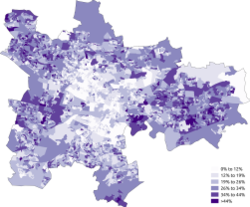 Church of Scotland
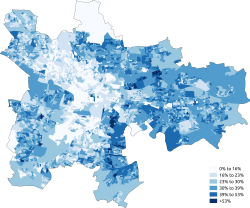 Roman Catholic
 Other Christian
 Islam
Islam Judaism
 Hinduism
 Sikhism
 Buddhism
 Other religion
 No religion


National identity
The 2022 census found that of the 620,756 people residing in Glasgow, 62.3% identified with the Scottish identity only, 11.8% identified with the British identity only and 7.1% identified with both identities. 2.5% identified with other UK identities (including English identity), 12.9% identified with an other identity only and the remaining 0.5% identified with at least one UK identity and an other identity.[14]
See also
Notes
References
Wikiwand - on
Seamless Wikipedia browsing. On steroids.