2018 Ontario general election
Provincial election in Ontario, Canada From Wikipedia, the free encyclopedia

The 2018 Ontario general election was held on June 7, 2018, to elect the 124 members of the 42nd Parliament of Ontario.[2] The Progressive Conservative Party of Ontario, led by Doug Ford, won 76 of the 124 seats in the legislature and formed a majority government. The Ontario New Democratic Party, led by Andrea Horwath, formed the Official Opposition. The Ontario Liberal Party, led by incumbent Premier Kathleen Wynne, lost official party status in recording both the worst result in the party's 161-year history and the worst result for any incumbent governing party in Ontario. The Green Party of Ontario won a seat for the first time in their history, while the Trillium Party of Ontario lost its single seat gained by a floor-crossing during the 41st Parliament.
| |||||||||||||||||||||||||||||||||||||||||||||||||||||||||||||||||||||||||||||||||||
124 seats of the Legislative Assembly of Ontario 63 seats needed for a majority | |||||||||||||||||||||||||||||||||||||||||||||||||||||||||||||||||||||||||||||||||||
|---|---|---|---|---|---|---|---|---|---|---|---|---|---|---|---|---|---|---|---|---|---|---|---|---|---|---|---|---|---|---|---|---|---|---|---|---|---|---|---|---|---|---|---|---|---|---|---|---|---|---|---|---|---|---|---|---|---|---|---|---|---|---|---|---|---|---|---|---|---|---|---|---|---|---|---|---|---|---|---|---|---|---|---|
| Opinion polls | |||||||||||||||||||||||||||||||||||||||||||||||||||||||||||||||||||||||||||||||||||
| Turnout | 56.67% (5.38pp)[1] | ||||||||||||||||||||||||||||||||||||||||||||||||||||||||||||||||||||||||||||||||||
| |||||||||||||||||||||||||||||||||||||||||||||||||||||||||||||||||||||||||||||||||||
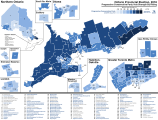
Popular vote by riding. As this is an FPTP election, seat totals are not determined by popular vote, but instead by the result in each riding. Riding names are listed at the bottom. | |||||||||||||||||||||||||||||||||||||||||||||||||||||||||||||||||||||||||||||||||||
| |||||||||||||||||||||||||||||||||||||||||||||||||||||||||||||||||||||||||||||||||||
.jpg)
.jpg)

.jpg)
Background
Summarize
Perspective
Redistribution of seats
The Electoral Boundaries Act, 2015[3] increased the number of electoral districts from 107 to 122, following the boundaries set out by the federal 2013 Representation Order for Ontario, while preserving the special boundaries of the 11 seats in Northern Ontario set out in the 1996 redistribution.
The Far North Electoral Boundaries Commission, appointed in 2016,[4] recommended the creation of the additional districts of Kiiwetinoong and Mushkegowuk—James Bay, carved out from the existing Kenora—Rainy River and Timmins—James Bay ridings, which accordingly raised the total number of seats to 124.[5][6] This was implemented through the Representation Statute Law Amendment Act, 2017.[7]
The new districts have been criticized as undemocratic, as they have a population of around 30,000 people compared with over 120,000 people in some southern Ontario constituencies. National Post columnist Josh Dehaas suggested that the small population sizes of the ridings might violate the Canadian Charter of Rights and Freedoms.[8]
In September 2017, a research firm analyzed the impact of redistribution if the boundaries had been in effect for the previous election.[9]
Change of fixed election date
Under legislation passed in 2005, Ontario elections were to be held on "the first Thursday in October in the fourth calendar year following polling day in the most recent general election", subject to the Lieutenant-Governor of Ontario's power to call an election earlier.[10] As the current government had a majority, the passage of a non-confidence motion was not a likely option for calling an early election, though Premier Kathleen Wynne stated in June 2015 that she would likely advise to dissolve the Legislature in spring 2018 rather than in October of that year in order to avoid any conflict with municipal elections and take advantage of better weather and longer days.[11]
To put this on a statutory footing, in October 2016 Attorney General of Ontario Yasir Naqvi introduced a bill in the Legislative Assembly which, in part, included moving the election date to "the first Thursday in June in the fourth calendar year following polling day in the most recent general election",[2] and it came into effect in December 2016.[12]
Prelude to campaign
The Ontario Liberal Party attempted to win their fifth consecutive general election, dating back to 2003. The Progressive Conservative Party of Ontario won their first election since 1999, and the Ontario New Democratic Party attempted to win their second election (having previously won in 1990). Numerous other extra-parliamentary political parties also vied for votes.
The Liberals under Kathleen Wynne headed into the 2018 campaign trailing far behind the Progressive Conservatives, led by former Toronto City Councillor Doug Ford. The Liberals' standing with voters had been badly hurt when they partially privatized Hydro One in 2015, after campaigning against it in the 2014 election, as well as rising criticism over "ballooning provincial debt, high electricity prices and costly, politically expedient decisions".[13][14] In early April, the CBC published their analysis of aggregate polls showing that Ford and the Progressive Conservatives were ahead of the other parties averaging 42.1% support, compared to 27.2% for the governing Liberals, 23.4% for the NDP and 5.7% for the Greens[15] and with 11 Liberal MPPs announcing they would not be running for re-election or having already resigned their seats in the months leading up to the election.[16]
According to Wynne, voters were offered a "stark choice", between "cutting and removing supports from people" with "billions in cuts", which she alleged the Progressive Conservatives would do if they won the election, and expanding investments in social programs such as prescription drugs and childcare, which the Liberal platform promised.[17]
In March 2018, the Liberals tabled a pre-election budget in the provincial legislature which promised billions of dollars in new spending for free childcare and expanded coverage for dental care but replaced the government's previous balanced budget with a $6.7 billion deficit projected to last until 2024–2025.[18] PC leader Doug Ford called the budget a "spending spree".[19]
Mood of the voters
According to Toronto Star columnist Susan Delacourt, voters were motivated by a desire for change—such desire being more driven by emotion than by ideology—and one researcher estimated that more than half of the electorate was undecided in who they were likely to vote for.[20] The Huffington Post reported that half of voters were basing their vote intentions on how best to block the party they oppose.[21]
In February 2018, Campaign Research conducted a gap analysis on voter intentions in Ontario, and determined the following:
| Liberal | PC | NDP | Highlights | ||||||||||||||||||||||||||||||||||||||||||||||||||||||||||||
|---|---|---|---|---|---|---|---|---|---|---|---|---|---|---|---|---|---|---|---|---|---|---|---|---|---|---|---|---|---|---|---|---|---|---|---|---|---|---|---|---|---|---|---|---|---|---|---|---|---|---|---|---|---|---|---|---|---|---|---|---|---|---|---|
|
|
|
| ||||||||||||||||||||||||||||||||||||||||||||||||||||||||||||
|
= Not voting for party; not considered | |||||||||||||||||||||||||||||||||||||||||||||||||||||||||||||||
Events leading up to the election (2014–2018)
| Date | |
|---|---|
| June 12, 2014 | The Liberal Party under Kathleen Wynne wins a majority government in the 41st Ontario general election. Progressive Conservative leader Tim Hudak announces his intention to step down following the selection of his successor.[23] |
| July 2, 2014 | Tim Hudak resigns as leader of the Progressive Conservatives.[24] Simcoe—Grey MPP Jim Wilson is named interim leader.[25] |
| July 24, 2014 | The Liberals pass their May 1 budget in its final reading. |
| May 9, 2015 | Patrick Brown, the Conservative federal MP for Barrie, is elected leader of the Progressive Conservative Party.[26] |
| September 24, 2015 | Ontario Provincial Police lay charges in relation to the Sudbury by-election scandal.[27] |
| November 1, 2016 | Ontario Provincial Police announce charges under the provincial act against Gerry Lougheed and Patricia Sorbara (CEO and director of the 2018 Liberal campaign) for alleged bribery during a 2015 byelection.[28] Sorbara announced that she will step down from the campaign.[29] |
| January 24, 2018 | CTV News reports that Progressive Conservative Party leader Patrick Brown is accused by two women of committing sexual misconduct. Brown denies the allegations.[30] |
| January 25, 2018 | Patrick Brown resigns as leader of the Progressive Conservative Party.[31][32] |
| January 26, 2018 | Progressive Conservative Party caucus chooses Nipissing MPP Vic Fedeli as interim leader.[33] |
| March 10, 2018 | Doug Ford is elected leader of the Progressive Conservatives on the third ballot of the party's leadership election.[34] Fedeli continues as Leader of the Opposition for legislative purposes until the election due to Ford not having a seat in the Legislature.[35] |
| April 11, 2018 | First Leaders Debate hosted by the Jamaican Canadian Association. Andrea Horwath, Mike Schreiner, and Premier Kathleen Wynne were in attendance.[36] |
| April 16, 2018 | The Ontario NDP release their full election platform.[37] |
| May 7, 2018 | First televised debate hosted by CityNews: Toronto-focused debate with Ford, Horwath and Wynne[38] |
| May 9, 2018 | Electoral Writ issued.[39] |
| May 11, 2018 | Leaders' debate in Parry Sound.[40] |
| May 17, 2018 | Candidate nominations close at 2 PM local time.[41] |
| May 26, 2018 | Advance voting starts at voting locations and returning offices.[42][43] |
| May 27, 2018 | Second televised debate, moderated by Steve Paikin and Farah Nasser, held at the Canadian Broadcasting Centre in Toronto and aired on CBC, CTV, Global, TVO, CPAC, CHCH and other outlets. Attended by Wynne, Ford, and Horwath.[44] |
| May 30, 2018 | Advance voting ends at advance voting locations.[42] |
| June 1, 2018 | Advance voting ends at returning offices.[42] |
| June 2, 2018 | Premier Wynne concedes that the Liberals will not win the election.[45][46] |
| June 6, 2018 | Special ballot voting at returning office or through home visit ends at 6:00 PM EST.[42] |
| June 7, 2018 | Election day. Fixed-date of the 2018 provincial election. |
Campaign period
Contests
| Candidates nominated | Ridings | Party | ||||||||||||||
|---|---|---|---|---|---|---|---|---|---|---|---|---|---|---|---|---|
| PC | NDP | Lib | Green | Ltn | NOTA | Ind | Tr | Mod | Free | Comm | Cons | NO | Oth[a 1] | Totals | ||
| 4 | 2 | 2 | 2 | 2 | 2 | 0 | 0 | 0 | 0 | 0 | 0 | 0 | 0 | 0 | 0 | 8 |
| 5 | 19 | 19 | 19 | 19 | 19 | 15 | 1 | 2 | 0 | 0 | 0 | 0 | 0 | 1 | 0 | 95 |
| 6 | 43 | 43 | 43 | 43 | 43 | 43 | 5 | 5 | 8 | 6 | 2 | 3 | 1 | 6 | 7 | 258 |
| 7 | 33 | 33 | 33 | 33 | 33 | 32 | 21 | 7 | 11 | 5 | 6 | 2 | 4 | 2 | 9 | 231 |
| 8 | 15 | 15 | 15 | 15 | 15 | 15 | 9 | 8 | 3 | 1 | 3 | 6 | 5 | 1 | 9 | 120 |
| 9 | 10 | 10 | 10 | 10 | 10 | 10 | 5 | 9 | 3 | 4 | 3 | 1 | 0 | 0 | 15 | 90 |
| 10 | 1 | 1 | 1 | 1 | 1 | 1 | 0 | 0 | 0 | 0 | 0 | 0 | 0 | 0 | 5 | 10 |
| 11 | 1 | 1 | 1 | 1 | 1 | 1 | 1 | 1 | 0 | 0 | 0 | 0 | 0 | 0 | 4 | 11 |
| Total | 124 | 124 | 124 | 124 | 124 | 117 | 42 | 32 | 25 | 16 | 14 | 12 | 10 | 10 | 49 | 823 |
- Minor political parties fielding fewer than ten candidates are aggregated together.
Issues
| Issue | Liberal | PC | NDP |
|---|---|---|---|
| Budget |
|
|
|
| Child care |
|
|
|
| Education |
|
|
|
| Environment |
|
|
|
| Healthcare |
|
|
|
| Electricity |
|
|
|
| Regulation |
|
|
|
| Taxation |
|
|
|
| Transportation |
|
|
|
Party slogans
Endorsements
| Type | Liberal | PC | NDP | Green | No endorsement |
|---|---|---|---|---|---|
| Media |
|
||||
| Politicians and public figures |
|
||||
| Unions and business associations |
Candidates
Summarize
Perspective
Candidate nominations
In February 2018, the PC leadership overturned the nomination of candidates Karma Macgregor in Ottawa West—Nepean and Thenusha Parani in Scarborough Centre because of irregularities and allegations of ballot stuffing at their nomination meetings.[90] Both candidates denied these claims.[91] The nomination meetings were reorganized, and both candidates lost the nomination at those meetings. However, the PC leadership decided not to overturn the nomination meeting's result in Hamilton West—Ancaster—Dundas, where a similar situation took place, because of an ongoing police investigation on this situation.[92]
In March 2018, the NDP nominated Lyra Evans as their candidate in Ottawa—Vanier. Evans was the first openly transgender candidate nominated by a major party to run in an Ontario general election.[93][94]
Incumbents not running for reelection
Results
Summarize
Perspective
| 76 | 40 | 7 | 1 |
| Progressive Conservative | New Democratic | Liberal | G |
Elections Ontario used electronic vote tabulator machines from Dominion Voting Systems for counting the ballots. Tabulators were deployed at 50 per cent of polling stations at a cost of CA$32,000,000.[109][110] This election was the first time Ontario used vote counting machines for a provincial election, although tabulators have been used in Ontario civic elections for more than 20 years, and also in a 2016 by-election in Whitby-Oshawa. The original paper ballots marked by voters will be kept for a year along with the digital scans of each ballot by the tabulator.[110]
 The percentage of votes cast for the Progressive Conservatives by riding.
 The percentage of votes cast for the NDP by riding.
 The percentage of votes cast for the Liberals by riding.
 Change in Progressive Conservative vote share by riding compared to the 2014 Ontario election.
 Each dot represents five-thousand votes for the party of the associated colour. Data is based on individual riding results. Dots are placed at random positions within the ridings that they belong to.
 A cartogram showing popular vote in each riding.
 The disproportionality of elections to the Legislative Assembly in the 2018 election was 17.96 according to the Gallagher Index, significantly in favour of the PCs.


| Party | Votes | Seats | |||
|---|---|---|---|---|---|
| Progressive Conservative | 2,326,632 | 76 / 124 (61%) | |||
| New Democratic | 1,929,649 | 40 / 124 (32%) | |||
| Liberal | 1,124,218 | 7 / 124 (6%) | |||
| Green | 264,487 | 1 / 124 (0.8%) | |||
Synopsis of results
| Riding | Winning party | Turnout [a 2] |
Votes[a 3] | |||||||||||||||||
|---|---|---|---|---|---|---|---|---|---|---|---|---|---|---|---|---|---|---|---|---|
| 2014 | 1st place | Votes | Share | Margin # |
Margin % |
2nd place | PC | NDP | Lib | Green | Ind | Other | Total | |||||||
| Ajax | Lib | PC | 19,078 | 39.1% | 3,948 | 8.1% | NDP | 54.6% | 19,078 | 15,130 | 12,607 | 1,224 | 220 | 601 | 48,860 | |||||
| Algoma—Manitoulin | NDP | NDP | 17,105 | 58.6% | 9,962 | 34.1% | PC | 53.1% | 7,143 | 17,105 | 2,365 | 1,025 | – | 1,573 | 29,211 | |||||
| Aurora—Oak Ridges—Richmond Hill | New | PC | 25,214 | 56.0% | 15,496 | 34.4% | Lib | 55.4% | 25,214 | 9,718 | 8,116 | 1,195 | – | 755 | 44,998 | |||||
| Barrie—Innisfil | Lib | PC | 22,121 | 50.0% | 9,460 | 21.4% | NDP | 54.3% | 22,121 | 12,661 | 5,543 | 3,190 | – | 757 | 44,272 | |||||
| Barrie—Springwater—Oro-Medonte | New | PC | 20,445 | 44.7% | 7,554 | 16.5% | NDP | 57.0% | 20,445 | 12,891 | 6,210 | 5,354 | 335 | 454 | 45,689 | |||||
| Bay of Quinte | Lib | PC | 24,224 | 48.0% | 8,161 | 16.2% | NDP | 56.5% | 24,224 | 16,063 | 7,511 | 1,730 | 379 | 535 | 50,442 | |||||
| Beaches—East York | Lib | NDP | 24,064 | 48.2% | 10,584 | 21.2% | Lib | 61.2% | 9,202 | 24,064 | 13,480 | 2,128 | 161 | 879 | 49,914 | |||||
| Brampton Centre | New | NDP | 12,892 | 38.4% | 89 | 0.3% | PC | 50.3% | 12,803 | 12,892 | 5,825 | 1,053 | – | 1,025 | 33,598 | |||||
| Brampton East | NDP | NDP | 18,062 | 46.9% | 5,166 | 13.4% | PC | 51.2% | 12,896 | 18,062 | 6,398 | 523 | – | 616 | 38,495 | |||||
| Brampton North | Lib | NDP | 14,877 | 37.5% | 497 | 1.3% | PC | 51.7% | 14,380 | 14,877 | 8,410 | 1,366 | – | 591 | 39,624 | |||||
| Brampton South | New | PC | 15,652 | 41.0% | 2,733 | 7.2% | NDP | 51.6% | 15,652 | 12,919 | 7,212 | 1,472 | – | 914 | 38,169 | |||||
| Brampton West | Lib | PC | 14,951 | 39.4% | 490 | 1.3% | NDP | 49.9% | 14,951 | 14,461 | 7,013 | 999 | – | 537 | 37,961 | |||||
| Brantford—Brant | Lib | PC | 24,437 | 39.4% | 635 | 1.1% | NDP | 47.7% | 24,437 | 23,802 | 5,553 | 2,741 | – | 1,655 | 58,188 | |||||
| Bruce—Grey—Owen Sound | PC | PC | 26,874 | 54.7% | 15,037 | 30.6% | NDP | 57.2% | 26,874 | 11,837 | 6,041 | 2,927 | – | 1,449 | 49,129 | |||||
| Burlington | Lib | PC | 25,504 | 40.4% | 7,451 | 11.8% | NDP | 58.4% | 25,504 | 18,053 | 15,515 | 2,828 | – | 1,155 | 63,055 | |||||
| Cambridge | Lib | PC | 17,793 | 37.0% | 2,154 | 4.5% | NDP | 63.4% | 17,793 | 15,639 | 11,191 | 3,018 | – | 490 | 48,131 | |||||
| Carleton | New | PC | 25,798 | 51.3% | 14,490 | 28.8% | NDP | 55.2% | 25,798 | 11,308 | 9,768 | 1,985 | 91 | 1,308 | 50,258 | |||||
| Chatham-Kent—Leamington | PC | PC | 24,078 | 51.9% | 7,520 | 16.2% | NDP | 62.0% | 24,078 | 16,558 | 3,736 | 1,643 | 358 | – | 46,373 | |||||
| Davenport | Lib | NDP | 27,613 | 60.3% | 19,055 | 41.6% | Lib | 56.8% | 7,370 | 27,613 | 8,558 | 1,624 | 69 | 585 | 45,819 | |||||
| Don Valley East | Lib | Lib | 13,012 | 35.9% | 1,028 | 2.8% | PC | 55.2% | 11,984 | 9,937 | 13,012 | 917 | – | 367 | 36,217 | |||||
| Don Valley North | New | PC | 18,046 | 44.4% | 5,489 | 13.5% | Lib | 53.8% | 18,046 | 8,476 | 12,557 | 1,039 | – | 489 | 40,607 | |||||
| Don Valley West | Lib | Lib | 17,802 | 38.9% | 181 | 0.4% | PC | 61.3% | 17,621 | 8,620 | 17,802 | 1,268 | – | 466 | 45,777 | |||||
| Dufferin—Caledon | PC | PC | 29,704 | 53.1% | 18,323 | 32.7% | NDP | 56.6% | 29,704 | 11,381 | 6,972 | 7,011 | – | 888 | 55,956 | |||||
| Durham | Lib | PC | 28,575 | 47.0% | 9,322 | 15.3% | NDP | 59.9% | 28,575 | 19,253 | 10,237 | 2,360 | – | 382 | 60,807 | |||||
| Eglinton—Lawrence | Lib | PC | 19,999 | 40.4% | 957 | 1.9% | Lib | 60.1% | 19,999 | 8,985 | 19,042 | 1,190 | – | 311 | 49,527 | |||||
| Elgin—Middlesex—London | PC | PC | 29,264 | 55.5% | 12,341 | 23.4% | NDP | 59.4% | 29,264 | 16,923 | 3,857 | 2,029 | – | 694 | 52,767 | |||||
| Essex | NDP | NDP | 26,134 | 47.9% | 2,711 | 5.0% | PC | 56.1% | 23,423 | 26,134 | 3,026 | 1,920 | – | – | 54,503 | |||||
| Etobicoke Centre | Lib | PC | 24,432 | 43.0% | 4,724 | 8.3% | Lib | 61.9% | 24,432 | 10,311 | 19,708 | 1,329 | 162 | 883 | 56,825 | |||||
| Etobicoke—Lakeshore | Lib | PC | 22,626 | 38.3% | 3,225 | 5.5% | NDP | 58.6% | 22,626 | 19,401 | 14,305 | 2,138 | – | 523 | 58,993 | |||||
| Etobicoke North | Lib | PC | 19,055 | 52.5% | 9,845 | 27.1% | NDP | 50.6% | 19,055 | 9,210 | 6,601 | 1,026 | – | 414 | 36,306 | |||||
| Flamborough—Glanbrook | New | PC | 22,454 | 43.5% | 4,824 | 9.4% | NDP | 60.6% | 22,454 | 17,630 | 7,967 | 2,307 | – | 1,230 | 51,588 | |||||
| Glengarry—Prescott—Russell | Lib | PC | 19,952 | 41.0% | 4,543 | 9.3% | Lib | 55.4% | 19,952 | 10,610 | 15,409 | 1,427 | – | 1,292 | 48,690 | |||||
| Guelph | Lib | Grn | 29,082 | 45.0% | 14,998 | 23.4% | PC | 61.1% | 14,084 | 13,929 | 6,537 | 29,082 | – | 945 | 64,577 | |||||
| Haldimand—Norfolk | PC | PC | 28,889 | 57.1% | 15,280 | 30.2% | NDP | 59.2% | 28,889 | 13,609 | 4,656 | 2,095 | – | 1,344 | 50,593 | |||||
| Haliburton—Kawartha Lakes—Brock | PC | PC | 32,406 | 56.7% | 17,264 | 30.2% | NDP | 59.7% | 32,406 | 15,142 | 5,655 | 2,551 | – | 1,389 | 57,143 | |||||
| Hamilton Centre | NDP | NDP | 23,866 | 65.2% | 18,136 | 49.6% | PC | 48.9% | 5,730 | 23,866 | 3,982 | 2,102 | 156 | 739 | 36,575 | |||||
| Hamilton East—Stoney Creek | NDP | NDP | 22,518 | 51.1% | 9,834 | 22.3% | PC | 53.1% | 12,684 | 22,518 | 5,320 | 1,884 | – | 1,614 | 44,020 | |||||
| Hamilton Mountain | NDP | NDP | 24,406 | 54.6% | 11,515 | 25.8% | PC | 56.2% | 12,891 | 24,406 | 4,134 | 2,300 | – | 986 | 44,717 | |||||
| Hamilton West—Ancaster—Dundas | Lib | NDP | 23,921 | 43.2% | 6,732 | 12.2% | PC | 62.3% | 17,189 | 23,921 | 10,960 | 2,302 | 247 | 771 | 55,390 | |||||
| Hastings—Lennox and Addington | New | PC | 22,374 | 50.2% | 7,933 | 17.8% | NDP | 59.1% | 22,374 | 14,441 | 5,180 | 1,924 | – | 602 | 44,521 | |||||
| Humber River—Black Creek | Lib | NDP | 11,573 | 37.4% | 2,206 | 7.1% | PC | 47.3% | 9,367 | 11,573 | 8,642 | 485 | – | 862 | 30,929 | |||||
| Huron—Bruce | PC | PC | 27,646 | 52.4% | 12,320 | 23.3% | NDP | 63.5% | 27,646 | 15,326 | 7,356 | 1,804 | – | 670 | 52,802 | |||||
| Kanata—Carleton | PC | PC | 23,089 | 43.2% | 7,497 | 14.0% | NDP | 62.3% | 23,089 | 15,592 | 9,090 | 2,827 | – | 2,855 | 53,453 | |||||
| Kenora—Rainy River | NDP | PC | 9,748 | 48.6% | 2,255 | 11.2% | NDP | 54.1% | 9,748 | 7,493 | 2,123 | 707 | – | – | 20,071 | |||||
| King—Vaughan | New | PC | 29,136 | 56.6% | 17,124 | 33.3% | Lib | 55.5% | 29,136 | 7,921 | 12,012 | 1,754 | – | 638 | 51,461 | |||||
| Kingston and the Islands | Lib | NDP | 21,788 | 39.2% | 6,476 | 11.6% | Lib | 57.3% | 14,512 | 21,788 | 15,312 | 3,574 | – | 458 | 55,644 | |||||
| Kitchener Centre | Lib | NDP | 20,512 | 43.4% | 7,432 | 15.7% | PC | 58.3% | 13,080 | 20,512 | 9,499 | 3,234 | – | 955 | 47,280 | |||||
| Kitchener—Conestoga | PC | PC | 17,005 | 39.6% | 686 | 1.6% | NDP | 59.9% | 17,005 | 16,319 | 6,035 | 2,853 | – | 762 | 42,974 | |||||
| Kitchener South—Hespeler | New | PC | 16,511 | 38.9% | 770 | 1.8% | NDP | 55.8% | 16,511 | 15,741 | 6,335 | 3,198 | 275 | 423 | 42,483 | |||||
| Lambton—Kent—Middlesex | PC | PC | 27,906 | 58.3% | 11,108 | 22.0% | NDP | 60.8% | 27,906 | 16,800 | 3,143 | 1,660 | – | 915 | 50,424 | |||||
| Lanark—Frontenac—Kingston | PC | PC | 26,194 | 52.0% | 10,855 | 21.6% | NDP | 62.0% | 26,194 | 15,339 | 5,359 | 2,410 | 440 | 601 | 50,343 | |||||
| Leeds—Grenville—Thousand Islands and Rideau Lakes | PC | PC | 30,002 | 61.3% | 20,314 | 41.5% | NDP | 60.2% | 30,002 | 9,688 | 6,543 | 2,347 | – | 389 | 48,969 | |||||
| London—Fanshawe | NDP | NDP | 25,272 | 55.7% | 11,753 | 25.9% | PC | 49.6% | 13,519 | 25,272 | 3,797 | 2,050 | – | 753 | 45,391 | |||||
| London North Centre | Lib | NDP | 25,757 | 47.6% | 9,056 | 16.7% | PC | 54.9% | 16,701 | 25,757 | 8,501 | 2,493 | – | 661 | 54,113 | |||||
| London West | NDP | NDP | 32,644 | 55.3% | 15,511 | 26.3% | PC | 60.6% | 17,133 | 32,644 | 5,847 | 2,211 | – | 1,161 | 58,996 | |||||
| Markham—Stouffville | Lib | PC | 25,912 | 48.1% | 11,905 | 22.1% | Lib | 58.6% | 25,912 | 10,997 | 14,007 | 2,153 | – | 777 | 53,846 | |||||
| Markham—Thornhill | New | PC | 18,943 | 50.4% | 9,783 | 26.0% | Lib | 52.2% | 18,943 | 8,010 | 9,160 | 859 | – | 576 | 37,548 | |||||
| Markham—Unionville | Lib | PC | 29,305 | 62.4% | 20,849 | 44.4% | Lib | 54.7% | 29,305 | 7,778 | 8,456 | 996 | – | 405 | 46,940 | |||||
| Milton | New | PC | 18,249 | 41.7% | 5,185 | 11.8% | Lib | 56.1% | 18,249 | 9,740 | 13,064 | 2,200 | – | 536 | 43,789 | |||||
| Mississauga Centre | New | PC | 17,860 | 40.9% | 5,814 | 13.3% | NDP | 49.8% | 17,860 | 12,046 | 11,102 | 1,149 | – | 1,553 | 43,710 | |||||
| Mississauga East—Cooksville | Lib | PC | 17,862 | 41.1% | 4,739 | 10.9% | Lib | 51.5% | 17,862 | 9,871 | 13,123 | 1,498 | – | 1,051 | 43,405 | |||||
| Mississauga—Erin Mills | Lib | PC | 19,631 | 41.6% | 6,610 | 14.0% | NDP | 55.1% | 19,631 | 13,021 | 11,965 | 1,296 | – | 1,265 | 47,178 | |||||
| Mississauga—Lakeshore | Lib | PC | 22,520 | 42.3% | 3,884 | 14.0% | Lib | 59.3% | 22,520 | 9,735 | 18,636 | 1,572 | – | 736 | 53,199 | |||||
| Mississauga—Malton | Lib | PC | 14,712 | 39.1% | 2,361 | 6.3% | NDP | 48.4% | 14,712 | 12,351 | 7,813 | 674 | 1,187 | 874 | 37,611 | |||||
| Mississauga—Streetsville | Lib | PC | 20,879 | 43.5% | 8,486 | 17.7% | NDP | 55.5% | 20,879 | 12,393 | 12,344 | 1,349 | – | 999 | 47,964 | |||||
| Nepean | PC | PC | 23,899 | 45.1% | 8,789 | 16.6% | NDP | 58.7% | 23,899 | 15,110 | 10,383 | 2,739 | – | 826 | 52,957 | |||||
| Newmarket—Aurora | Lib | PC | 24,813 | 47.7% | 12,408 | 23.9% | NDP | 59.0% | 24,813 | 12,405 | 11,840 | 1,859 | 447 | 649 | 52,013 | |||||
| Niagara Centre | NDP | NDP | 21,618 | 44.2% | 3,285 | 6.7% | PC | 56.1% | 18,333 | 21,618 | 5,779 | 1,803 | 217 | 1,124 | 48,874 | |||||
| Niagara Falls | NDP | NDP | 30,161 | 50.8% | 9,035 | 15.2% | PC | 54.6% | 21,126 | 30,161 | 5,554 | 2,057 | – | 483 | 59,381 | |||||
| Niagara West | PC | PC | 24,394 | 52.8% | 10,625 | 23.0% | NDP | 63.3% | 24,394 | 13,769 | 4,859 | 2,590 | – | 578 | 46,190 | |||||
| Nickel Belt | NDP | NDP | 23,157 | 63.5% | 15,139 | 41.5% | PC | 55.4% | 8,018 | 23,157 | 3,182 | 1,137 | – | 973 | 36,467 | |||||
| Nipissing | PC | PC | 17,598 | 49.9% | 4,604 | 13.1% | NDP | 58.2% | 17,598 | 12,994 | 2,794 | 997 | – | 860 | 35,243 | |||||
| Northumberland—Peterborough South | Lib | PC | 27,386 | 45.3% | 12,582 | 20.8% | NDP | 64.6% | 27,386 | 14,804 | 14,603 | 2,740 | – | 890 | 60,423 | |||||
| Oakville | Lib | PC | 24,837 | 43.7% | 4,510 | 7.9% | Lib | 62.5% | 24,837 | 9,424 | 20,327 | 1,986 | – | 297 | 56,871 | |||||
| Oakville North—Burlington | Lib | PC | 25,691 | 46.4% | 12,195 | 22.0% | NDP | 60.2% | 25,691 | 13,496 | 13,487 | 2,052 | – | 625 | 55,351 | |||||
| Orléans | Lib | Lib | 24,972 | 39.0% | 2,463 | 3.8% | PC | 62.8% | 22,509 | 14,033 | 24,972 | 1,603 | 435 | 398 | 63,950 | |||||
| Oshawa | NDP | NDP | 24,301 | 44.9% | 1,707 | 3.2% | PC | 54.6% | 22,594 | 24,301 | 4,278 | 1,957 | – | 1,013 | 54,143 | |||||
| Ottawa Centre | Lib | NDP | 29,675 | 46.1% | 8,564 | 13.3% | Lib | 61.2% | 10,327 | 29,675 | 21,111 | 2,266 | – | 1,024 | 64,403 | |||||
| Ottawa South | Lib | Lib | 20,773 | 39.6% | 5,454 | 10.4% | PC | 56.9% | 15,319 | 14,250 | 20,773 | 1,618 | – | 456 | 52,416 | |||||
| Ottawa—Vanier | Lib | Lib | 20,555 | 42.9% | 6,323 | 13.2% | NDP | 51.5% | 10,252 | 14,232 | 20,555 | 1,955 | – | 964 | 47,958 | |||||
| Ottawa West—Nepean | Lib | PC | 16,590 | 32.8% | 175 | 0.3% | NDP | 57.0% | 16,590 | 16,415 | 14,810 | 1,937 | – | 793 | 50,545 | |||||
| Oxford | PC | PC | 29,152 | 55.7% | 13,235 | 25.3% | NDP | 59.2% | 29,152 | 15,917 | 3,620 | 2,254 | 335 | 1,033 | 52,311 | |||||
| Parkdale—High Park | NDP | NDP | 32,407 | 59.4% | 22,586 | 41.4% | PC | 62.4% | 9,821 | 32,407 | 9,271 | 2,544 | – | 506 | 54,549 | |||||
| Parry Sound—Muskoka | PC | PC | 22,662 | 48.1% | 12,277 | 26.0% | NDP | 59.2% | 22,662 | 10,385 | 4,071 | 9,438 | 219 | 368 | 47,143 | |||||
| Perth—Wellington | PC | PC | 23,736 | 50.7% | 9,351 | 20.0% | NDP | 60.3% | 23,736 | 14,385 | 5,062 | 2,746 | – | 914 | 46,843 | |||||
| Peterborough—Kawartha | PC | PC | 22,904 | 37.7% | 2,386 | 3.9% | NDP | 62.7% | 22,904 | 20,518 | 14,946 | 2,024 | – | 398 | 60,790 | |||||
| Pickering—Uxbridge | Lib | PC | 22,447 | 42.2% | 5,414 | 10.2% | NDP | 58.9% | 22,447 | 17,033 | 10,851 | 2,105 | 373 | 384 | 53,193 | |||||
| Renfrew—Nipissing—Pembroke | PC | PC | 33,350 | 69.2% | 25,284 | 52.5% | NDP | 59.7% | 33,350 | 8,066 | 4,701 | 1,436 | – | 646 | 48,199 | |||||
| Richmond Hill | Lib | PC | 22,224 | 51.2% | 10,116 | 23.3% | Lib | 52.2% | 22,224 | 7,490 | 12,108 | 1,248 | – | 301 | 43,371 | |||||
| St. Catharines | Lib | NDP | 18,911 | 36.6% | 1,558 | 3.0% | PC | 58.1% | 17,353 | 18,911 | 12,671 | 1,923 | – | 792 | 51,650 | |||||
| Sarnia—Lambton | PC | PC | 26,811 | 52.7% | 7,816 | 15.4% | NDP | 60.9% | 26,811 | 18,995 | 2,246 | 1,856 | 71 | 851 | 50,830 | |||||
| Sault Ste. Marie | Lib | PC | 13,498 | 42.0% | 414 | 1.3% | NDP | 54.5% | 13,498 | 13,084 | 3,199 | 1,044 | – | 1,292 | 32,117 | |||||
| Scarborough—Agincourt | Lib | PC | 18,582 | 50.4% | 8,153 | 22.1% | Lib | 51.3% | 18,582 | 6,434 | 10,429 | 635 | 189 | 602 | 36,871 | |||||
| Scarborough Centre | Lib | PC | 15,266 | 38.4% | 2,019 | 5.1% | NDP | 53.2% | 15,266 | 13,247 | 8,791 | 919 | – | 1,481 | 39,704 | |||||
| Scarborough—Guildwood | Lib | Lib | 11,972 | 33.3% | 74 | 0.2% | PC | 52.9% | 11,898 | 9,917 | 11,972 | 878 | 66 | 1,174 | 35,905 | |||||
| Scarborough North | Lib | PC | 17,413 | 51.0% | 9,093 | 26.7% | NDP | 50.8% | 17,413 | 8,320 | 7,519 | 543 | – | 318 | 34,113 | |||||
| Scarborough—Rouge Park | New | PC | 16,224 | 38.6% | 963 | 2.3% | NDP | 55.5% | 16,224 | 15,261 | 8,785 | 1,014 | – | 731 | 42,015 | |||||
| Scarborough Southwest | Lib | NDP | 19,835 | 45.7% | 6,270 | 14.4% | PC | 56.0% | 13,565 | 19,835 | 8,228 | 1,174 | – | 641 | 43,443 | |||||
| Simcoe—Grey | PC | PC | 34,094 | 55.9% | 20,650 | 33.9% | NDP | 57.1% | 34,094 | 13,444 | 8,780 | 4,192 | – | 453 | 60,963 | |||||
| Simcoe North | PC | PC | 25,236 | 46.9% | 10,158 | 18.9% | NDP | 58.9% | 25,236 | 15,078 | 9,523 | 3,632 | – | 320 | 53,789 | |||||
| Spadina—Fort York | Lib | NDP | 24,677 | 49.6% | 12,907 | 26.0% | Lib | 53.4% | 10,834 | 24,677 | 11,770 | 1,815 | – | 635 | 49,731 | |||||
| Stormont—Dundas—South Glengarry | PC | PC | 26,780 | 61.5% | 17,364 | 39.9% | NDP | 54.1% | 26,780 | 9,416 | 5,386 | 1,596 | – | 360 | 43,538 | |||||
| Sudbury | NDP | NDP | 17,386 | 48.1% | 8,981 | 24.8% | PC | 54.2% | 8,405 | 17,386 | 8,108 | 1,504 | 82 | 682 | 36,167 | |||||
| Thornhill | PC | PC | 28,889 | 61.1% | 19,755 | 41.8% | NDP | 56.2% | 28,889 | 9,134 | 6,985 | 1,043 | – | 1,208 | 47,259 | |||||
| Thunder Bay—Atikokan | Lib | NDP | 11,793 | 36.3% | 81 | 0.3% | Lib | 54.7% | 7,555 | 11,793 | 11,712 | 880 | – | 585 | 32,525 | |||||
| Thunder Bay—Superior North | Lib | Lib | 11,973 | 39.9% | 813 | 2.7% | NDP | 53.8% | 5,395 | 11,160 | 11,973 | 838 | – | 669 | 30,035 | |||||
| Timiskaming—Cochrane | NDP | NDP | 16,806 | 61.2% | 10,646 | 38.8% | PC | 53.1% | 6,160 | 16,806 | 2,476 | 723 | – | 1,296 | 27,461 | |||||
| Timmins | NDP | NDP | 8,978 | 57.4% | 4,344 | 27.8% | PC | 48.1% | 4,634 | 8,978 | 1,378 | 273 | – | 370 | 15,633 | |||||
| Toronto Centre | Lib | NDP | 23,688 | 53.7% | 11,702 | 26.5% | Lib | 54.3% | 6,234 | 23,688 | 11,986 | 1,377 | – | 863 | 44,148 | |||||
| Toronto—Danforth | NDP | NDP | 32,938 | 64.2% | 24,807 | 48.4% | PC | 61.6% | 8,131 | 32,938 | 7,216 | 2,248 | 228 | 508 | 51,269 | |||||
| Toronto—St. Paul's | Lib | NDP | 18,843 | 36.0% | 1,345 | 2.6% | Lib | 60.7% | 13,780 | 18,843 | 17,498 | 1,690 | – | 591 | 52,402 | |||||
| University—Rosedale | New | NDP | 24,537 | 49.7% | 13,639 | 27.6% | Lib | 56.6% | 10,431 | 24,537 | 10,898 | 2,652 | 220 | 674 | 49,412 | |||||
| Vaughan—Woodbridge | Lib | PC | 21,687 | 50.5% | 7,945 | 18.5% | Lib | 56.0% | 21,687 | 6,254 | 13,742 | 972 | – | 291 | 42,946 | |||||
| Waterloo | NDP | NDP | 27,315 | 50.5% | 10,342 | 19.1% | PC | 61.8% | 16,973 | 27,315 | 6,577 | 2,613 | – | 566 | 54,044 | |||||
| Wellington—Halton Hills | PC | PC | 31,659 | 54.0% | 17,572 | 30.0% | NDP | 61.1% | 31,659 | 14,087 | 7,492 | 5,066 | – | 320 | 58,624 | |||||
| Whitby | PC | PC | 26,471 | 45.8% | 5,313 | 9.2% | NDP | 60.3% | 26,471 | 21,158 | 7,441 | 1,958 | – | 768 | 57,796 | |||||
| Willowdale | Lib | PC | 17,732 | 43.6% | 6,917 | 17.0% | Lib | 50.5% | 17,732 | 10,481 | 10,815 | 932 | 233 | 453 | 40,646 | |||||
| Windsor—Tecumseh | NDP | NDP | 25,221 | 58.4% | 13,544 | 31.4% | PC | 47.8% | 11,677 | 25,221 | 3,513 | 1,909 | 863 | – | 43,183 | |||||
| Windsor West | NDP | NDP | 20,276 | 52.1% | 9,203 | 23.7% | PC | 43.3% | 11,073 | 20,276 | 5,722 | 1,393 | – | 435 | 38,899 | |||||
| York Centre | Lib | PC | 18,434 | 50.1% | 9,817 | 26.7% | NDP | 52.9% | 18,434 | 8,617 | 7,865 | 843 | – | 1,002 | 36,761 | |||||
| York—Simcoe | PC | PC | 26,050 | 57.3% | 15,395 | 33.8% | NDP | 54.9% | 26,050 | 10,655 | 6,182 | 2,195 | – | 409 | 45,491 | |||||
| York South—Weston | Lib | NDP | 13,455 | 36.1% | 1,165 | 3.1% | PC | 49.2% | 12,290 | 13,455 | 10,379 | 946 | – | 228 | 37,298 | |||||
| Kiiwetinoong | New | NDP | 3,232 | 49.9% | 1,467 | 22.7% | PC | 45.8% | 1,765 | 3,232 | 983 | 406 | – | 91 | 6,477 | |||||
| Mushkegowuk—James Bay | New | NDP | 4,827 | 51.8% | 2,032 | 21.8% | PC | 54.0% | 2,795 | 4,827 | 1,332 | 167 | – | 203 | 9,324 | |||||
- "Summary of Valid Votes Cast for Each Candidate: 2018 General Election". elections.on.ca. Archived from the original on December 3, 2019. Retrieved December 3, 2019.; "Statistical Summary by Electoral District: 2018 General Election". elections.on.ca. Archived from the original on December 3, 2019. Retrieved December 3, 2019.
- including spoilt ballots
- minor political parties receiving less than 1% of the popular vote are aggregated under "Other"; independent candidates are aggregated separately
Comparative analysis for ridings (2018 vs 2014)
| Riding and winning party | Turnout | Vote share | ||||||||
|---|---|---|---|---|---|---|---|---|---|---|
| % | Change (pp) | % | Change (pp) | |||||||
| Ajax | PC | Gain | 54.63 | 4.45 | 39.05 | 9.88 | ||||
| Algoma—Manitoulin | NDP | Hold | 53.08 | 3.70 | 58.56 | 5.15 | ||||
| Aurora—Oak Ridges—Richmond Hill | PC | New | 55.43 | New | 56.03 | New | ||||
| Barrie—Innisfil | PC | Gain | 54.27 | 5.09 | 49.97 | 13.87 | ||||
| Barrie—Springwater—Oro-Medonte | PC | New | 57.05 | New | 44.75 | New | ||||
| Bay of Quinte | PC | Gain | 56.46 | 4.85 | 48.02 | 6.31 | ||||
| Beaches—East York | NDP | Gain | 61.16 | 5.02 | 48.21 | 9.24 | ||||
| Brampton Centre | NDP | New | 50.35 | New | 38.37 | New | ||||
| Brampton East | NDP | Hold | 51.67 | 6.64 | 46.92 | 2.61 | ||||
| Brampton North | NDP | Gain | 51.58 | 6.24 | 37.55 | 5.56 | ||||
| Brampton South | PC | New | 49.95 | New | 41.01 | New | ||||
| Brampton West | PC | Gain | 47.67 | 5.17 | 39.39 | 15.05 | ||||
| Brantford—Brant | PC | Gain | 57.17 | 4.66 | 42.00 | 12.03 | ||||
| Bruce—Grey—Owen Sound | PC | Hold | 58.39 | 4.45 | 54.70 | 7.15 | ||||
| Burlington | PC | Gain | 63.45 | 5.72 | 40.45 | 3.46 | ||||
| Cambridge | PC | Gain | 55.17 | 6.22 | 36.97 | 4.41 | ||||
| Carleton | PC | New | 62.00 | New | 51.33 | New | ||||
| Chatham-Kent—Leamington | PC | Hold | 56.79 | 5.46 | 51.92 | 14.09 | ||||
| Davenport | NDP | Gain | 55.82 | 6.26 | 60.27 | 20.12 | ||||
| Don Valley East | Lib | Hold | 55.22 | 7.38 | 35.93 | -19.79 | ||||
| Don Valley North | PC | New | 53.81 | New | 44.44 | New | ||||
| Don Valley West | Lib | Hold | 61.27 | 7.37 | 38.89 | -18.13 | ||||
| Dufferin—Caledon | PC | Hold | 56.57 | 5.09 | 53.08 | 13.23 | ||||
| Durham | PC | Gain | 59.94 | 4.23 | 46.99 | 12.71 | ||||
| Eglinton—Lawrence | PC | Gain | 60.11 | 6.12 | 40.38 | 6.62 | ||||
| Elgin—Middlesex—London | PC | Hold | 59.45 | 5.47 | 55.46 | 9.10 | ||||
| Essex | NDP | Hold | 56.12 | 5.92 | 47.95 | -12.39 | ||||
| Etobicoke Centre | PC | Gain | 61.91 | 5.43 | 43.00 | 10.27 | ||||
| Etobicoke—Lakeshore | PC | Gain | 58.61 | 4.88 | 38.35 | 4.00 | ||||
| Etobicoke North | PC | Gain | 50.58 | 7.87 | 52.48 | 29.74 | ||||
| Flamborough—Glanbrook | PC | New | 60.58 | New | 43.53 | New | ||||
| Glengarry—Prescott—Russell | PC | Gain | 55.42 | 2.06 | 40.98 | 8.41 | ||||
| Guelph | Green | Gain | 61.12 | 5.65 | 45.03 | 25.74 | ||||
| Haldimand—Norfolk | PC | Hold | 59.20 | 5.23 | 57.10 | 4.88 | ||||
| Haliburton—Kawartha Lakes—Brock | PC | Hold | 59.66 | 3.68 | 56.71 | 15.75 | ||||
| Hamilton Centre | NDP | Hold | 48.91 | 4.15 | 65.25 | 13.24 | ||||
| Hamilton East—Stoney Creek | NDP | Hold | 53.06 | 4.22 | 51.15 | 4.34 | ||||
| Hamilton Mountain | NDP | Hold | 56.16 | 3.32 | 54.58 | 7.68 | ||||
| Hamilton West—Ancaster—Dundas | NDP | Gain | 62.26 | 3.23 | 43.19 | 27.59 | ||||
| Hastings—Lennox and Addington | PC | New | 59.10 | New | 50.25 | New | ||||
| Humber River—Black Creek | NDP | Gain | 47.26 | 5.01 | 37.42 | -1.80 | ||||
| Huron—Bruce | PC | Hold | 63.51 | 3.55 | 52.36 | 13.35 | ||||
| Kanata—Carleton | PC | Hold | 62.32 | 6.23 | 43.19 | -4.29 | ||||
| Kenora—Rainy River | PC | Gain | 54.12 | 7.40 | 48.57 | 23.07 | ||||
| King—Vaughan | PC | New | 55.52 | New | 56.62 | New | ||||
| Kingston and the Islands | NDP | Gain | 57.29 | 5.15 | 39.16 | 9.60 | ||||
| Kitchener Centre | NDP | Gain | 58.27 | 5.99 | 43.38 | 20.58 | ||||
| Kitchener—Conestoga | PC | Hold | 59.93 | 9.60 | 39.57 | 3.21 | ||||
| Kitchener South—Hespeler | PC | New | 55.82 | New | 38.86 | New | ||||
| Lambton—Kent—Middlesex | PC | Hold | 60.77 | 3.84 | 55.34 | 10.17 | ||||
| Lanark—Frontenac—Kingston | PC | Hold | 62.03 | 8.08 | 52.03 | 8.51 | ||||
| Leeds—Grenville—Thousand Islands and Rideau Lakes | PC | Hold | 60.22 | 7.36 | 61.27 | 5.20 | ||||
| London—Fanshawe | NDP | Hold | 49.65 | 3.23 | 55.68 | 5.26 | ||||
| London North Centre | NDP | Gain | 54.95 | 4.73 | 47.60 | 17.16 | ||||
| London West | NDP | Hold | 60.56 | 4.52 | 55.33 | 14.97 | ||||
| Markham—Stouffville | PC | Gain | 58.85 | 12.64 | 48.12 | 10.66 | ||||
| Markham—Thornhill | PC | New | 52.21 | New | 50.45 | New | ||||
| Markham—Unionville | PC | Gain | 54.74 | 10.20 | 62.43 | 28.46 | ||||
| Milton | PC | New | 56.11 | New | 41.67 | New | ||||
| Mississauga Centre | PC | New | 49.79 | New | 40.86 | New | ||||
| Mississauga East—Cooksville | PC | Gain | 51.48 | 7.58 | 41.15 | 14.96 | ||||
| Mississauga—Erin Mills | PC | Gain | 55.13 | 8.23 | 41.61 | 11.72 | ||||
| Mississauga—Lakeshore | PC | Gain | 59.33 | 5.78 | 42.33 | 9.13 | ||||
| Mississauga—Malton | PC | Gain | 48.37 | 6.90 | 39.12 | 11.89 | ||||
| Mississauga—Streetsville | PC | Gain | 55.53 | 8.77 | 43.53 | 15.46 | ||||
| Nepean | PC | Hold | 58.73 | 3.34 | 45.13 | -1.64 | ||||
| Newmarket—Aurora | PC | Gain | 58.97 | 5.57 | 47.71 | 10.28 | ||||
| Niagara Centre | NDP | Hold | 56.13 | 2.92 | 44.23 | -2.48 | ||||
| Niagara Falls | NDP | Hold | 54.56 | 3.35 | 50.79 | 3.41 | ||||
| Niagara West | PC | Hold | 63.28 | 4.68 | 52.81 | 10.99 | ||||
| Nickel Belt | NDP | Hold | 55.42 | 5.42 | 63.50 | 0.89 | ||||
| Nipissing | PC | Hold | 58.24 | 5.76 | 49.93 | 8.12 | ||||
| Northumberland—Peterborough South | PC | Gain | 64.64 | 8.83 | 45.32 | 9.39 | ||||
| Oakville | PC | Gain | 62.46 | 6.34 | 43.67 | 5.86 | ||||
| Oakville North—Burlington | PC | Gain | 60.20 | 9.30 | 46.41 | 9.31 | ||||
| Orléans | Lib | Hold | 62.77 | 3.43 | 39.05 | -14.45 | ||||
| Oshawa | NDP | Hold | 54.58 | 4.39 | 44.88 | -1.82 | ||||
| Ottawa Centre | NDP | Gain | 61.20 | 4.36 | 46.08 | 25.61 | ||||
| Ottawa South | Lib | Hold | 56.92 | 3.21 | 39.63 | -10.33 | ||||
| Ottawa—Vanier | Lib | Hold | 51.47 | 2.61 | 42.86 | -12.69 | ||||
| Ottawa West—Nepean | PC | Gain | 57.04 | 1.10 | 32.82 | -1.06 | ||||
| Oxford | PC | Hold | 59.25 | 7.32 | 55.73 | 9.49 | ||||
| Parkdale—High Park | NDP | Hold | 62.43 | 5.55 | 59.41 | 18.64 | ||||
| Parry Sound—Muskoka | PC | Hold | 59.22 | 7.10 | 48.07 | 7.34 | ||||
| Perth—Wellington | PC | Hold | 60.35 | 4.69 | 50.67 | 11.71 | ||||
| Peterborough—Kawartha | PC | Hold | 62.74 | 5.45 | 37.68 | 7.85 | ||||
| Pickering—Uxbridge | PC | Gain | 58.90 | 4.12 | 42.20 | 13.90 | ||||
| Renfrew—Nipissing—Pembroke | PC | Hold | 59.74 | 5.42 | 69.19 | 8.13 | ||||
| Richmond Hill | PC | Gain | 52.18 | 6.49 | 51.24 | 14.70 | ||||
| St. Catharines | NDP | Gain | 58.06 | 3.25 | 36.61 | 12.21 | ||||
| Sarnia—Lambton | PC | Hold | 60.89 | 3.54 | 52.75 | 11.73 | ||||
| Sault Ste. Marie | PC | Gain | 54.49 | 3.72 | 42.03 | 29.63 | ||||
| Scarborough—Agincourt | PC | Gain | 51.35 | 5.31 | 50.40 | 15.77 | ||||
| Scarborough Centre | PC | Gain | 53.19 | 5.10 | 38.45 | 16.87 | ||||
| Scarborough—Guildwood | Lib | Hold | 52.93 | 3.69 | 33.34 | -16.55 | ||||
| Scarborough North | PC | Gain | 50.76 | 3.28 | 51.05 | 23.89 | ||||
| Scarborough—Rouge Park | PC | New | 55.54 | New | 38.61 | New | ||||
| Scarborough Southwest | NDP | Gain | 56.04 | 6.12 | 45.66 | 22.01 | ||||
| Simcoe—Grey | PC | Hold | 57.08 | 5.08 | 55.93 | 8.81 | ||||
| Simcoe North | PC | Hold | 58.88 | 5.55 | 46.92 | 2.96 | ||||
| Spadina—Fort York | NDP | Gain | 53.56 | 4.23 | 49.62 | 19.25 | ||||
| Stormont—Dundas—South Glengarry | PC | Hold | 54.10 | 2.08 | 61.51 | 9.79 | ||||
| Sudbury | NDP | Hold | 54.22 | 2.30 | 48.07 | 5.83 | ||||
| Thornhill | PC | Hold | 56.16 | 8.33 | 61.13 | 17.14 | ||||
| Thunder Bay—Atikokan | NDP | Gain | 54.74 | 5.72 | 36.26 | 8.15 | ||||
| Thunder Bay—Superior North | Lib | Hold | 53.84 | 3.43 | 39.86 | -16.11 | ||||
| Timiskaming—Cochrane | NDP | Hold | 53.08 | 2.41 | 61.20 | 5.72 | ||||
| Timmins | NDP | Hold | 48.12 | 2.96 | 57.43 | 6.25 | ||||
| Toronto Centre | NDP | Gain | 54.30 | 3.45 | 53.66 | 37.76 | ||||
| Toronto—Danforth | NDP | Hold | 61.58 | 6.28 | 64.25 | 19.64 | ||||
| Toronto—St. Paul's | NDP | Gain | 60.71 | 3.60 | 35.96 | 25.90 | ||||
| University—Rosedale | NDP | New | 56.63 | New | 49.66 | New | ||||
| Vaughan—Woodbridge | PC | Gain | 55.96 | 11.27 | 50.50 | 22.33 | ||||
| Waterloo | NDP | Hold | 61.80 | 6.85 | 50.54 | 13.11 | ||||
| Wellington—Halton Hills | PC | Hold | 61.11 | 5.50 | 54.00 | 7.39 | ||||
| Whitby | PC | Hold | 60.32 | 5.97 | 45.80 | 5.15 | ||||
| Willowdale | PC | Gain | 50.52 | 3.64 | 43.63 | 10.16 | ||||
| Windsor—Tecumseh | NDP | Hold | 47.83 | 5.06 | 58.40 | -3.75 | ||||
| Windsor West | NDP | Hold | 43.30 | 0.60 | 52.12 | 10.72 | ||||
| York Centre | PC | Gain | 52.92 | 6.18 | 50.15 | 18.68 | ||||
| York—Simcoe | PC | Hold | 54.92 | 7.39 | 57.26 | 16.86 | ||||
| York South—Weston | NDP | Gain | 49.17 | 3.03 | 36.07 | -1.18 | ||||
| Kiiwetinoong | NDP | New | 45.80 | New | 49.90 | New | ||||
| Mushkegowuk—James Bay | NDP | New | 54.05 | New | 51.77 | New | ||||
Detailed results and analysis
| Political party | Party leader | MPPs | Votes | |||||||
|---|---|---|---|---|---|---|---|---|---|---|
| Candidates | 2014 | Dissol. | 2018 | ± | # | % | ± (pp) | |||
| Progressive Conservative | Doug Ford | 124 | 28 | 27 | 76 | 48 |
2,326,523 | 40.19% | 9.08 | |
| New Democratic | Andrea Horwath | 124 | 21 | 18 | 40 | 19 |
1,929,966 | 33.34% | 9.68 | |
| Liberal | Kathleen Wynne | 124 | 58 | 55 | 7 | 51 |
1,124,346 | 19.42% | 19.10 | |
| Green | Mike Schreiner | 124 | – | – | 1 | 1 |
264,519 | 4.57% | 0.31 | |
| Libertarian | Allen Small | 117 | – | – | – | – | 42,822 | 0.74% | 0.04 | |
| None of the Above | Greg Vezina | 42 | – | – | – | – | 16,146 | 0.28% | 0.20 | |
| Independents and no affiliation | 32 | – | 2 | – | – | 8,226 | 0.14% | 0.06 | ||
| Trillium | Bob Yaciuk | 26 | – | 1 | – | – | 8,091 | 0.14% | 0.13 | |
| Northern Ontario | Trevor Holliday | 10 | – | – | – | – | 5,912 | 0.10% | 0.08 | |
| Consensus Ontario | Brad Harness | 10 | – | – | – | – | 2,682 | 0.05% | New | |
| Freedom | Paul McKeever | 14 | – | – | – | – | 2,565 | 0.04% | 0.20 | |
| Ontario Party | Jason Tysick | 5 | – | – | – | – | 2,316 | 0.04% | New | |
| Moderate | Yuri Duboisky | 16 | – | – | – | – | 2,199 | 0.04% | 0.03 | |
| Communist | Dave McKee | 12 | – | – | – | – | 1,471 | 0.03% | 0.01 | |
| Canadians' Choice Party | Bahman Yazdanfar | 5 | – | – | – | – | 1,239 | 0.02% | 0.01 | |
| Stop the New Sex-Ed Agenda | Queenie Yu | 3 | – | – | – | – | 1,078 | 0.02% | New | |
| Ontario Alliance | Joshua E. Eriksen | 3 | – | – | – | – | 802 | 0.01% | New | |
| New People's Choice Party | Daryl Christoff | 3 | – | – | – | – | 634 | 0.01% | New | |
| Special Needs | Hilton Milan | 5 | – | – | – | – | 631 | 0.01% | ||
| People's Political Party | Kevin Clarke | 6 | – | – | – | – | 628 | 0.01% | 0.01 | |
| Confederation of Regions | vacant | 2 | – | – | – | – | 386 | 0.01% | ||
| Stop Climate Change | Ken Ranney | 2 | – | – | – | – | 340 | 0.01% | New | |
| Canadian Economic Party | Patrick Knight | 2 | – | – | – | – | 321 | 0.01% | New | |
| Go Vegan | Paul Figueiras | 2 | – | – | – | – | 256 | – | 0.02 | |
| Cultural Action Party | Arthur Smitherman | 3 | – | – | – | – | 215 | – | New | |
| Multicultural Party of Ontario | Wasyl Luczkiw | 2 | – | – | – | – | 191 | – | New | |
| Party of Objective Truth | Derrick Matthews | 2 | – | – | – | – | 176 | – | New | |
| Pauper | John Turmel | 2 | – | – | – | – | 112 | – | ||
| Social Reform Party | Abu Alam | 2 | – | – | – | – | 67 | – | New | |
| Vacant | 4 | |||||||||
| Declined ballots | 22,684 | |||||||||
| Blank and invalid ballots | 38,742 | |||||||||
| Total | 825 | 107 | 107 | 124 | 5,806,286 | 100.00% | ||||
| Registered voters / turnout | 10,246,066 | 56.67% | 5.38 | |||||||
Incumbents MPPs who lost their seats [114]
38 incumbent Liberal MPPs lost their re-election races, as well as a one Trillium party MPP.
- ‡ means that the Incumbent was originally from a different riding
- "b.e." is a short term for "By-election"
| Parties | Seats | |
|---|---|---|
| █ Progressive Conservative | █ New Democratic | 90 |
| █ Progressive Conservative | █ Liberal | 22 |
| █ Progressive Conservative | █ Green | 1 |
| █ New Democratic | █ Liberal | 11 |
| Total | 124 | |
| Parties | 1st | 2nd | 3rd | 4th | 5th | Total |
|---|---|---|---|---|---|---|
| █ Progressive Conservative | 76 | 37 | 11 | 124 | ||
| █ New Democratic | 40 | 61 | 23 | 124 | ||
| █ Liberal | 7 | 26 | 88 | 3 | 124 | |
| █ Green | 1 | 2 | 117 | 4 | 124 | |
| █ Libertarian | 1 | 77 | 78 | |||
| █ None of the Above | 20 | 20 | ||||
| █ Northern Ontario | 2 | 10 | 12 | |||
| █ Independent | 1 | 10 | 11 | |||
| █ Trillium | 8 | 8 | ||||
| █ Ontario Party | 5 | 5 |
Regional analysis
| Party | Toronto | 905 Belt | Ham/Niagara | Central | East | Midwest | Southwest | North | Total | |
|---|---|---|---|---|---|---|---|---|---|---|
| Progressive Conservative | 11 | 21 | 6 | 10 | 11 | 9 | 4 | 4 | 76 | |
| New Democratic | 11 | 4 | 7 | 2 | 2 | 6 | 8 | 40 | ||
| Liberal | 3 | 3 | 1 | 7 | ||||||
| Green | 1 | 1 | ||||||||
| Total | 25 | 25 | 13 | 10 | 16 | 12 | 10 | 13 | 124 | |
Most marginal 2-way and 3-way contests
| Riding | 1st | 2nd | 1st vs 2nd | ||
|---|---|---|---|---|---|
| Scarborough—Guildwood | 33.3% | 33.1% | 0.2% | ||
| Thunder Bay—Atikokan | 36.2% | 36.0% | 0.2% | ||
| Brampton Centre | 38.4% | 38.1% | 0.3% | ||
| Ottawa West—Nepean | 32.8% | 32.5% | 0.3% | ||
| Don Valley West | 38.9% | 38.5% | 0.4% | ||
| Brantford—Brant | 42.0% | 40.9% | 1.1% | ||
| Brampton North | 37.5% | 36.3% | 1.2% | ||
| Sault Ste. Marie | 42.0% | 40.7% | 1.3% | ||
| Brampton West | 39.4% | 38.1% | 1.3% | ||
| Kitchener—Conestoga | 39.6% | 38.0% | 1.6% | ||
| Riding | 1st | 2nd | 3rd | 1st vs 3rd | |||
|---|---|---|---|---|---|---|---|
| Ottawa West—Nepean | 32.8% | 32.5% | 29.3% | 3.5% | |||
| Scarborough—Guildwood | 33.3% | 33.1% | 27.6% | 5.7% | |||
| York South—Weston | 36.1% | 33.0% | 27.8% | 8.3% | |||
| Don Valley East | 35.9% | 33.1% | 27.4% | 8.5% | |||
| Humber River—Black Creek | 37.4% | 30.3% | 27.9% | 9.5% | |||
| Toronto—St. Paul's | 36.0% | 33.4% | 26.3% | 9.7% | |||
| St. Catharines | 36.6% | 33.6% | 24.5% | 12.1% | |||
| Ottawa South | 39.6% | 29.2% | 27.2% | 12.4% | |||
| Thunder Bay—Atikokan | 36.2% | 36.0% | 23.2% | 13.0% | |||
| Kingston and the Islands | 39.2% | 27.5% | 26.1% | 13.1% | |||
Significant results among independent and minor party candidates
Those candidates not belonging to a major party, receiving more than 1,000 votes in the election, are listed below:
| Riding | Party | Candidates | Votes | Placed |
|---|---|---|---|---|
| Algoma—Manitoulin | █ N.Ont. Heritage | Tommy Lee | 1,366 | 4th |
| Kanata—Carleton | █ Trillium | Jack MacLaren | 1,947 | 5th |
| Mississauga—Malton | █ Independent | Caroline Roach | 1,187 | 4th |
| Scarborough Centre | █ Libertarian | Matthew Dougherty | 1,040 | 4th |
| Timiskaming—Cochrane | █ N.Ont. Heritage | Shawn Poirier | 1,105 | 4th |
Opinion polls
Summarize
Perspective
Campaign period

| Polling firm | Last date of polling |
Link | Liberal | Progressive Conservative | New Democrat | Green | Other | Margin of error |
Sample size |
Polling method | Lead |
|---|---|---|---|---|---|---|---|---|---|---|---|
| Election | June 7, 2018 | Archive | 19.6 | 40.5 | 33.6 | 4.6 | 1.7 | 6.9 | |||
| Forum Research | June 6, 2018 | 21 | 39 | 34 | 5 | 1 | ±3 pp | 2,178 | IVR | 5 | |
| Research Co. | June 6, 2018 | HTML | 20 | 39 | 37 | 4 | 1 | ±3.8 pp | 661 | Online | 2 |
| EKOS | June 6, 2018 | 18.9 | 39.1 | 35.1 | 4.5 | 2.4 | ±2.8 pp | 1,230 | IVR | 4.0 | |
| Pollara | June 5, 2018 | 17 | 38 | 38 | 6 | 2 | ±3.3 pp | 906 (1/3) | Online/telephone (rolling) | 0 | |
| Ipsos | June 5, 2018 | HTML Archived October 8, 2018, at the Wayback Machine | 19 | 39 | 36 | 6* | ±3.1 pp | 1,501 | Online/telephone | 3 | |
| Mainstreet Research | June 4, 2018 | HTML | 20.2 | 39.0 | 34.3 | 4.9 | 1.7 | ±1.7 pp | 3,320 | IVR | 4.7 |
| Leger | June 4, 2018 | HTML | 18 | 39 | 38 | 5* | N/A | 1,008 | Online | 1 | |
| Pollara | June 4, 2018 | 17 | 39 | 37 | 6 | 1 | ±3.0 pp | 1,083 (1/4) | Online/telephone (rolling) | 2 | |
| Pollara | June 3, 2018 | 20 | 38 | 37 | 5 | 1 | ±2.7 pp | 1,275 (1/4) | Online/telephone (rolling) | 1 | |
| Forum Research | June 2, 2018 | 18 | 38 | 37 | 5 | 2 | ±3 pp | 2,349 | IVR | 1 | |
| Abacus Data | June 2, 2018 | HTML Archived August 4, 2018, at the Wayback Machine | 23 | 33 | 37 | 5 | 2 | ±1.9 pp | 2,646 | Online | 4 |
| Pollara | June 2, 2018 | 20 | 37 | 37 | 5 | 1 | ±2.6 pp | 1,447 | Online/telephone | 0 | |
| EKOS | May 31, 2018 | 19.3 | 38.6 | 34.9 | 5.9 | 1.2 | ±3.1 pp | 990 (2/3) | IVR (rolling) | 3.7 | |
| Research Co. | May 31, 2018 | HTML | 18 | 38 | 39 | 4 | 1 | ±3.7 pp | 701 | Online | 1 |
| Forum Research | May 29, 2018 | 19 | 39 | 35 | 5 | 2 | ±2 pp | 2,602 | IVR | 4 | |
| H+K Strategies | May 29, 2018 | HTML | 19 | 37 | 39 | 6 | ±2.5 pp | 1,500 | Online | 2 | |
| EKOS | May 29, 2018 | 19.1 | 37.9 | 38.4 | 3.3 | 1.3 | ±3.2 pp | 945 | IVR | 0.5 | |
| Angus Reid | May 29, 2018 | 17 | 37 | 39 | 5 | 2 | ±3.5 pp | 773 | Online | 2 | |
| Innovative Research | May 29, 2018 | 22 | 34 | 36 | 6 | 2 | N/A | 958 | Online | 2 | |
| Innovative Research | May 29, 2018 | 21 | 34 | 37 | 6 | 1 | ±4.0 pp | 611 | Telephone | 3 | |
| Pollara | May 28, 2018 | 17 | 32 | 43 | 5 | 2 | ±3.5 pp | 800 | Online | 11 | |
| Media consortium leaders' debate in Toronto (May 27, 2018)[116] | |||||||||||
| Mainstreet Research | May 27, 2018 | HTML | 16.0 | 37.9 | 39.3 | 4.5 | 2.4 | ±2.39 pp | 1,682 | IVR | 1.4 |
| Ipsos | May 27, 2018 | HTML Archived May 29, 2018, at the Wayback Machine | 22 | 37 | 34 | 7* | ±3.2 pp | 1,241 | Online/telephone | 3 | |
| Abacus Data | May 26, 2018 | HTML Archived July 12, 2019, at the Wayback Machine | 23 | 33 | 37 | 4 | 2 | ±3.5 pp | 800 | Online | 4 |
| EKOS | May 24, 2018 | 20.4 | 34.9 | 35.6 | 7.0 | 2.1 | ±3.1 pp | 1,021 | IVR | 0.7 | |
| Forum Research | May 23, 2018 | 14 | 33 | 47 | 4 | 2 | ±3 pp | 906 | IVR | 14 | |
| Innovative Research | May 23, 2018 | 26 | 36 | 31 | 6 | 1 | N/A | 1,074 | Online | 5 | |
| Pollara | May 22, 2018 | HTML | 18 | 37 | 38 | 5 | 2 | ±3.3 pp | 870 | Online | 1 |
| Leger | May 22, 2018 | 21 | 37 | 37 | 5* | ±3.09 pp | 1,008 | Online | 0 | ||
| Ipsos | May 21, 2018 | HTML Archived May 23, 2018, at the Wayback Machine | 23 | 36 | 37 | 4* | ±3.5 pp | 1,000 | Online | 1 | |
| Abacus Data | May 18, 2018 | HTML Archived August 4, 2018, at the Wayback Machine | 24 | 35 | 34 | 5 | 2 | ±1.9 pp | 2,824 | Online | 1 |
| Mainstreet Research | May 18, 2018 | HTML | 22.3 | 41.9 | 29.3 | 5.0 | 1.4 | ±2.02 pp | 2,350 | IVR | 12.6 |
| EKOS | May 17, 2018 | 23.3 | 39.1 | 29.8 | 5.4 | 2.3 | ±2.9 pp | 1,124 | IVR | 9.3 | |
| H+K Strategies | May 15, 2018 | HTML | 23 | 38 | 32 | 7* | ±2.5 pp | 1,500 | Online | 6 | |
| Ipsos | May 14, 2018 | HTML Archived May 16, 2018, at the Wayback Machine | 22 | 40 | 35 | 3* | ±3.5 pp | 1,000 | Online | 5 | |
| Innovative Research | May 12, 2018 | 27 | 35 | 31 | 6 | 1 | N/A | 1,529 | Online | 4 | |
| Leaders' debate in Parry Sound (May 11, 2018) | |||||||||||
| Mainstreet Research | May 11, 2018 | HTML | 22.1 | 42.3 | 28.4 | 5.4 | 1.8 | ±1.95 pp | 2,534 | IVR | 13.9 |
| Forum Research | May 9, 2018 | 22 | 40 | 33 | 4 | 2 | ±4 pp | 777 | IVR | 7 | |
| Innovative Research | May 9, 2018 | PDF Archived May 16, 2018, at the Wayback Machine | 28 | 38 | 28 | 6 | 1 | N/A | 915 | Online | 10 |
| City Toronto leaders' debate (May 7, 2018)[117] | |||||||||||
*Includes support for the Green Party
Best Premier and Party Leader Approval Ratings
| Date | Firm | Best Premier ratings | Approval ratings | |||||||
|---|---|---|---|---|---|---|---|---|---|---|
| Ford | Horwath | Wynne | ||||||||
| Ford | Horwath | Wynne | Approve | Disapprove | Approve | Disapprove | Approve | Disapprove | ||
| June 6, 2018 | Research Co. | 36% | 55% | 54% | 34% | 29% | 64% | |||
| June 2, 2018 | Forum Research | 27% | 31% | 17% | 27% | 55% | 41% | 34% | 23% | 65% |
| June 2, 2018 | Abacus Data | 25% | 48% | 42% | 20% | 21% | 56% | |||
| May 31, 2018 | Research Co. | 23% | 28% | 15% | 33% | 56% | 52% | 34% | 27% | 64% |
| May 29, 2018 | Forum Research | 29% | 30% | 16% | 30% | 53% | 40% | 32% | 23% | 65% |
| May 29, 2018 | Angus Reid | 25% | 34% | 15% | ||||||
| May 29, 2018 | Innovative Research | 23% | 30% | 14% | 30% | 54% | 48% | 23% | 25% | 59% |
| May 26, 2018 | Abacus Data | 27% | 45% | 44% | 15% | 19% | 60% | |||
| May 23, 2018 | Forum Research | 30% | 33% | 15% | 32% | 51% | 43% | 26% | 19% | 69% |
| May 23, 2018 | Innovative Research | 24% | 26% | 19% | 27% | 57% | 46% | 20% | 24% | 61% |
| May 22, 2018 | Leger | 23% | 28% | 12% | ||||||
| May 18, 2018 | Abacus Data | 26% | 46% | 42% | 13% | 17% | 60% | |||
| May 12, 2018 | Innovative Research | 24% | 26% | 16% | 31% | 52% | 44% | 17% | 21% | 62% |
| May 9, 2018 | Forum Research | 34% | 49% | 42% | 25% | 20% | 71% | |||
Major Regional Polls – Toronto
| Polling firm | Last date of polling |
Link | Lib | PC | NDP | Gre | Oth | Margin of error |
Sample size |
Polling method | Lead |
|---|---|---|---|---|---|---|---|---|---|---|---|
| Campaign Research | May 16, 2018 | HTML Archived May 21, 2018, at the Wayback Machine | 27 | 35 | 32 | 5 | 2 | ±2.3 pp | 1,871 | Online | 3 |
| Leaders' debate in Parry Sound (May 11, 2018) | |||||||||||
| Mainstreet Research | May 7, 2018 | 31.1 | 36.6 | 23.1 | 5.9 | 3.4 | ±2.19 pp | 2,000 | IVR | 5.5 | |
| CityTV Toronto leaders' debate (May 7, 2018)[117] | |||||||||||
Pre-campaign period

| Polling organisation | Last date of polling | Source | Lib | PC | NDP | Gr | Oth | Polling type | Sample size | Margin of error |
|---|---|---|---|---|---|---|---|---|---|---|
| Ipsos | May 7, 2018 | HTML | 26 | 40 | 29 | – | 5 | Online/telephone | 1,197 | ±3.2% |
| EKOS Research | May 6, 2018 | 24.4 | 41.1 | 25.6 | 6.5 | 2 | IVR | 2,018 | ±2.2% | |
| Abacus Data | May 6, 2018 | HTML Archived May 8, 2018, at the Wayback Machine | 29 | 35 | 29 | 5 | 2 | Online | 1,755 | ±2.4% |
| Nanos Research | May 6, 2018 | 28.5 | 41.1 | 24.3 | 5.9 | Telephone | 500 | ±4.4% | ||
| Pollara | May 4, 2018 | HTML | 23 | 40 | 30 | 6 | 1 | Online | 1,010 | ±3.1% |
| Leger | April 23, 2018 | HTML | 26 | 43 | 26 | – | Online | 1,000+ | ||
| Nanos Research | April 22, 2018 | 30.6 | 42.2 | 21.4 | 5.3 | Telephone | 2,098 | ±2.1% | ||
| Forum Research | April 18, 2018 | 21 | 46 | 27 | 4 | 2 | IVR | 1,126 | ±3% | |
| Mainstreet Research | April 18, 2018 | HTML | 28.2 | 44.9 | 21.3 | 4.0 | 1.6 | IVR | 1,763 | ±2.33% |
| Ipsos | April 9, 2018 | HTML | 27 | 40 | 28 | – | 5 | Online | 800 | ±4.0% |
| Innovative Research | April 9, 2018 | HTML | 29.9 | 42.5 | 20.7 | 6.9 | 1.1 | Online | 600 | ±4.0% |
| Abacus Data | April 8, 2018 | HTML Archived April 13, 2018, at the Wayback Machine | 28 | 40 | 24 | 6 | 2 | Online | 4,177 | ±1.5% |
| EKOS Research | April 5, 2018 | 29.3 | 43.0 | 20.7 | 5.2 | 1.8 | IVR | 1,067 | ±3.0% | |
| Mainstreet Research | April 4, 2018 | HTML | 23.9 | 50.3 | 18.3 | 5.2 | 2.4 | IVR | 1,969 | ±2.21% |
| Forum Research | March 29, 2018 | 29 | 36 | 26 | 7 | 2 | IVR | 728 | ±4% | |
| Innovative Research | March 20, 2018 | 26 | 44 | 22 | 7 | 1 | Telephone | 603 | ±4.0% | |
| Mainstreet Research | March 18, 2018 | HTML | 26.2 | 47.0 | 18.6 | 6.4 | 1.8 | IVR | 2,003 | ±2.23% |
| Campaign Research | March 14, 2018 | HTML | 27 | 43 | 23 | 5 | 1 | Online | 1,637 | ±2.4% |
| Leger | March 14, 2018 | 26 | 42 | 24 | – | 8 | Online | 1,008 | ±3.087% | |
| Ipsos | March 14, 2018 | HTML | 32 | 39 | 25 | – | 3 | Online | 803 | ±4.0% |
| Forum Research | March 11, 2018 | 23 | 44 | 27 | 5 | 2 | IVR | 923 | ±3% | |
| 10 March 2018 | Doug Ford is elected leader of the Progressive Conservative Party | |||||||||
| Angus Reid | March 7, 2018 | 24 | 50 | 22 | – | 4 | Online | 807 | ±3.4% | |
| DART | February 27, 2018 | 19 | 44 | 24 | – | 13 | Online | 962 | ±3.6% | |
| Nanos Research | February 26, 2018 | 30.5 | 43.5 | 23.2 | 2.8 | Telephone | 502 | ±4.4% | ||
| Forum Research | February 23, 2018 | 21 | 46 | 24 | 7 | 2 | IVR | 1,005 | ±3% | |
| Ipsos | February 19, 2018 | HTML | 29 | 38 | 26 | – | 7 | Online | 802 | ±4.0% |
| Forum Research | February 17, 2018 | 24 | 49 | 19 | 7 | 2 | IVR | 949 | ±3% | |
| Campaign Research | February 11, 2018 | HTML | 28 | 43 | 20 | 8 | 1 | Online | 1,426 | ±2.5% |
| Leger | January 2018 | HTML | 33 | 36 | 26 | Online | 996 | ±3.1% | ||
| Innovative Research | January 29, 2018 | 32 | 36 | 21 | 9 | 2 | Online | 1,027 | ||
| 26 January 2018 | Vic Fedeli is appointed as interim leader of the Ontario PC Party | |||||||||
| Forum Research | January 25, 2018 | 27 | 42 | 23 | 6 | 2 | IVR | 751 | ±4% | |
| 25 January 2018 | Patrick Brown resigns as Ontario PC leader | |||||||||
| Innovative Research | January 17, 2018 | 35 | 38 | 18 | 8 | 1 | Online | 1,040 | ||
| Forum Research | January 13, 2018 | 24 | 43 | 24 | 7 | 2 | IVR | 1,022 | ±3% | |
| Campaign Research | January 11, 2018 | HTML | 34 | 35 | 23 | 6 | 2 | Online | 1,544 | ±2.5% |
| Mainstreet Research | January 6, 2018 | 32 | 43 | 18 | 7 | IVR | 2,375 | ±2.01% | ||
| Nanos Research | December 18, 2017 | 33.5 | 41.4 | 20.5 | 4.0 | Telephone | 500 | ±4.4% | ||
| Ipsos | December 14, 2017 | HTML | 28 | 36 | 28 | – | 9 | Online | 829 | ±4.0% |
| Campaign Research | December 6, 2017 | HTML | 35 | 34 | 22 | 7 | 2 | Online | 1,495 | ±2.5% |
| Forum Research | November 30, 2017 | 24 | 40 | 26 | 8 | 2 | IVR | 861 | ±3% | |
| Innovative Research | November 17, 2017 | 31 | 41 | 19 | 8 | 1 | Telephone | 607 | ±4.0% | |
| Campaign Research | November 9, 2017 | HTML | 32 | 35 | 23 | 9 | 1 | Online | 1,263 | ±2.8% |
| Nanos Research | October 29, 2017 | 29.2 | 38.3 | 26.0 | 6.4 | Telephone | 500 | ±4.4% | ||
| Forum Research | October 25, 2017 | 24 | 45 | 22 | 7 | 2 | IVR | 946 | ±3% | |
| Campaign Research | October 11, 2017 | HTML | 32 | 36 | 25 | 7 | 1 | Online | 1,347 | ±2.7% |
| Forum Research | September 27, 2017 | 22 | 44 | 27 | 5 | 2 | IVR | 801 | ±3% | |
| Innovative Research | September 18, 2017 | 35 | 40 | 18 | 5 | 1 | Telephone | 608 | ±4.0% | |
| Campaign Research | September 11, 2017 | HTML | 33 | 38 | 23 | 6 | 0 | Online | 1,133 | ±2.9% |
| Ipsos | September 11, 2017 | HTML | 32 | 39 | 22 | – | 7 | Online | 800 | ±4.0% |
| Forum Research | August 24, 2017 | 25 | 40 | 27 | 6 | 2 | IVR | 981 | ±3% | |
| Nanos Research | August 17, 2017 | 31.2 | 42.2 | 19.5 | 6.7 | Telephone | 500 | ±4.4% | ||
| Innovative Research | July 19, 2017 | HTML | 36 | 40 | 17 | 6 | 1 | Telephone | 605 | ±4.0% |
| Campaign Research | July 10, 2017 | HTML | 31 | 38 | 23 | 6 | 1 | Online | 943 | ±3% |
| Innovative Research | June 27, 2017 | HTML | 35 | 39 | 20 | 5 | 1 | Telephone | 600 | ±4.0% |
| Forum Research | June 14, 2017 | 23 | 44 | 24 | 7 | 2 | IVR | 1,003 | ±3% | |
| Campaign Research | June 12, 2017 | HTML | 30 | 38 | 24 | 7 | 1 | Online | 1,118 | ±3% |
| Mainstreet Research | May 25, 2017 | HTML | 29 | 43 | 24 | 5 | – | IVR | 2,000 | ±2.19% |
| Campaign Research | May 13, 2017 | HTML | 37 | 34 | 22 | 6 | 1 | Online | 864 | ±4% |
| Forum Research | May 10, 2017 | 28 | 41 | 23 | 6 | 3 | IVR | 1,103 | ±3% | |
| Campaign Research | April 11, 2017 | HTML | 31 | 36 | 25 | Online | 979 | ±3% | ||
| Innovative Research | April 5, 2017 | 29 | 40 | 23 | 6 | 2 | Online | 779 | ||
| Forum Research | March 30, 2017 | 19 | 43 | 28 | 8 | 2 | IVR | 884 | ±3.3% | |
| Mainstreet Research | March 12, 2017 | HTML | 30 | 40 | 24 | 6 | – | IVR | 2,531 | ±1.95% |
| Forum Research | February 16, 2017 | 24 | 44 | 25 | 6 | 2 | IVR | 1,120 | ±3% | |
| Mainstreet Research | February 12, 2017 | HTML | 29 | 39 | 27 | 4 | – | IVR | 2,524 | ±1.95% |
| Campaign Research | January 29, 2017 | HTML | 28 | 50 | 15 | 5 | 2 | IVR | 676 | ±4% |
| Forum Research | November 21, 2016 | 24 | 43 | 24 | 8 | 2 | IVR | 1,184 | ±3% | |
| Nanos Research | November 19, 2016 | 31.9 | 39.9 | 22.2 | 5.2 | 0.8 | Telephone | 500 | ±4.4% | |
| Mainstreet Research | November 2, 2016 | HTML | 25 | 43 | 27 | 6 | – | IVR | 2,524 | ±1.95% |
| Forum Research | October 18, 2016 | 24 | 43 | 23 | 8 | 2 | IVR | 1,124 | ±3% | |
| Innovative Research | September 24, 2016 | 33 | 38 | 20 | 8 | – | Telephone | 600 | ±4.0% | |
| Ipsos | September 22, 2016 | HTML | 40 | 35 | 20 | 5 | – | Online | 800 | ±4% |
| Mainstreet Research | September 18, 2016 | HTML | 28 | 43 | 23 | 6 | – | IVR | 2,562 | ±1.94% |
| Forum Research | September 13, 2016 | 25 | 45 | 23 | 6 | 2 | IVR | 1,154 | ±3% | |
| Ipsos | September 9, 2016 | HTML | 35 | 37 | 23 | 5 | – | Online | 800 | ±4% |
| 8 September 2016 | Premier Kathleen Wynne prorogues the legislature | |||||||||
| Forum Research | August 15, 2016 | 28 | 41 | 23 | 6 | 2 | IVR | 1,097 | ±3% | |
| Forum Research | July 12, 2016 | 35 | 42 | 17 | 5 | 2 | IVR | 1,183 | ±3% | |
| Forum Research | June 21, 2016 | 30 | 40 | 21 | 8 | 2 | IVR | 1,173 | ±3% | |
| Forum Research | May 31, 2016 | 30 | 40 | 21 | 7 | 2 | IVR | 1,172 | ±3% | |
| Mainstreet Research | May 18, 2016 | HTML | 36 | 38 | 20 | 5 | – | IVR | 2,537 | ±1.95% |
| Forum Research | April 25, 2016 | 34 | 39 | 21 | 5 | 2 | IVR | 1,157 | ±3% | |
| Forum Research | March 23, 2016 | 30 | 40 | 24 | 5 | 2 | IVR | 1,225 | ±3% | |
| Forum Research | February 29, 2016 | 27 | 44 | 22 | 6 | 2 | IVR | 1,148 | ±3% | |
| Mainstreet Research | February 16, 2016 | HTML | 33 | 36 | 26 | 5 | – | IVR | 2,623 | ±1.91% |
| Forum Research | December 20, 2015 | 31 | 34 | 26 | 7 | 2 | IVR | 1,003 | ±3% | |
| Ipsos | November 9, 2015 | HTML | 44 | 31 | 20 | 4 | – | Online | 1,002 | ±3.5% |
| Forum Research | November 4, 2015 | 30 | 36 | 26 | 6 | 1 | IVR | 1,158 | ±3% | |
| Mainstreet Research | November 1, 2015 | HTML | 28 | 40 | 25 | 7 | – | IVR | 2,506 | ±1.96% |
| Mainstreet Research | September 21, 2015 | HTML | 30 | 40 | 24 | 7 | – | IVR | 4,610 | ±1.5% |
| Forum Research | August 13, 2015 | 26 | 35 | 33 | 4 | 2 | IVR | 1,001 | ±3% | |
| Forum Research | July 5, 2015 | 26 | 32 | 35 | 5 | 2 | IVR | 678 | ±4% | |
| Ipsos | May 20, 2015 | HTML | 34.13 | 32.37 | 25.19 | 8.31 | – | Online | 1,002 | ±3.5% |
| Innovative Research | May 19, 2015 | 34 | 35 | 24 | 6 | – | Telephone | 606 | ±4.0% | |
| Forum Research | May 11, 2015 | 24 | 33 | 36 | 5 | 2 | IVR | 1,001 | ±3% | |
| 9 May 2015 | Patrick Brown is elected leader of the Ontario PC Party | |||||||||
| Forum Research | April 30, 2015 | 29 | 36 | 24 | 9 | 2 | IVR | 912 | ±3% | |
| Innovative Research | April 26, 2015 | 40 | 33 | 18 | 8 | 1 | Online | 1,017 | ||
| Forum Research | March 26, 2015 | 29 | 34 | 27 | 8 | 2 | IVR | 881 | ±3% | |
| Environics | March 25, 2015 | HTML | 32 | 33 | 27 | 7 | – | Telephone | 989 | ±3.1% |
| Forum Research | February 27, 2015 | 32 | 39 | 21 | 6 | 2 | IVR | 996 | ±3% | |
| Forum Research | January 30, 2015 | 37 | 36 | 19 | 6 | 2 | IVR | 1,028 | ±3% | |
| Forum Research | December 20, 2014 | 35 | 36 | 20 | 7 | 2 | IVR | 1,058 | ±3% | |
| Forum Research | November 29, 2014 | 37 | 37 | 17 | 7 | 2 | IVR | 1,054 | ±3% | |
| Forum Research | November 1, 2014 | 40 | 35 | 19 | 4 | 2 | IVR | 1,104 | ±3% | |
| Forum Research | October 1, 2014 | 36 | 34 | 23 | 6 | 1 | IVR | 1,079 | ±3% | |
| Forum Research | August 21, 2014 | 39 | 32 | 19 | 8 | 2 | IVR | 1,229 | ±3% | |
| 2 July 2014 | Jim Wilson becomes interim leader of the Ontario PC Party | |||||||||
| 2 July 2014 | Tim Hudak resigns as leader of the Ontario PC Party | |||||||||
| 2014 election | June 12, 2014 | HTML | 38.65 | 31.25 | 23.75 | 4.84 | 1.51 | |||
Notes
- Summarized from "Data Explorer". Elections Ontario. Archived from the original on March 30, 2022. Retrieved December 15, 2022.
References
Further reading
External links
Wikiwand - on
Seamless Wikipedia browsing. On steroids.