Curve fitting
process of constructing a curve, or mathematical function, that has the best fit to a series of data points From Wikipedia, the free encyclopedia
Curve fitting is constructing a mathematical function which best fits a set of data points.[1][2][3]

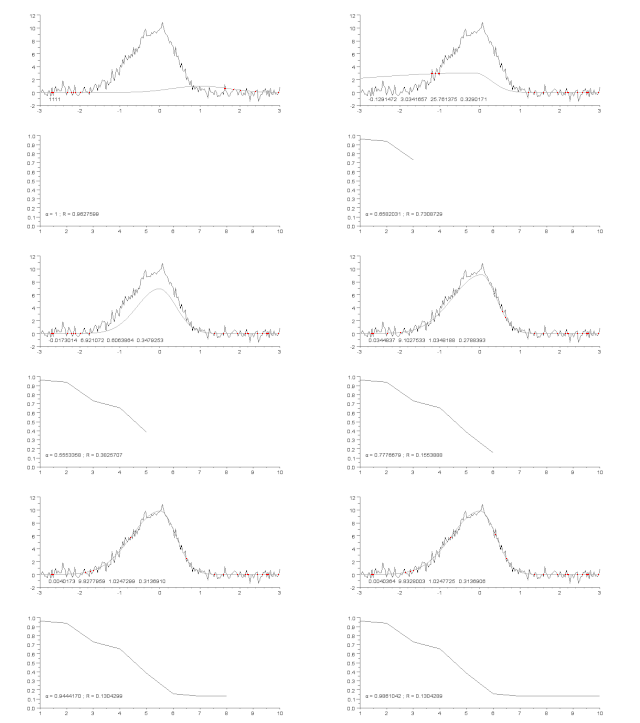
Top: raw data and model.
Bottom: evolution of the normalised sum of the squares of the errors.
Curve fitting may involve either interpolation[4] or smoothing.[5] Using interpolation requires an exact fit to the data. With smoothing, a "smooth" function is constructed, that fit the data approximately. A related topic is regression analysis,[6][7] which focuses more on questions of statistical inference such as how much uncertainty is present in a curve that is fit to data observed with random errors.
Fitted curves can be used to help data visualization,[8][9] to guess values of a function where no data is available,[10] and to summarize the relationships among two or more variables.[11] Extrapolation refers to the use of a fitted curve beyond the range of the observed data.[12] This is subject to a degree of uncertainty,[13] since it may reflect the method used to construct the curve as much as it reflects the observed data.
References
Wikiwand - on
Seamless Wikipedia browsing. On steroids.
