Wiggers diagram
Teaching aid in cardiac physiology From Wikipedia, the free encyclopedia

A Wiggers diagram, named after its developer, Carl Wiggers, is a unique diagram that has been used in teaching cardiac physiology for more than a century.[1][2] In the Wiggers diagram, the X-axis is used to plot time subdivided into the cardiac phases, while the Y-axis typically contains the following on a single grid:
- Blood pressure
- Aortic pressure
- Ventricular pressure
- Atrial pressure
- Ventricular volume
- Electrocardiogram
- Arterial flow (optional)
- Heart sounds (optional)
The Wiggers diagram clearly illustrates the coordinated variation of these values as the heart beats, assisting one in understanding the entire cardiac cycle.[1]
Events
| Phase | EKG | Heart sounds | Semilunar valves | Atrioventricular valves | |
| A | Atrial systole | P | S4* | closed | open |
| B | Ventricular systole – Isovolumetric/isovolumic contraction | QRS | S1 ("lub") | closed | closed |
| C1 | Ventricular systole – Ejection 1 | ST | open | closed | |
| C2 | Ventricular systole – Ejection 2 | T | open | closed | |
| D | Ventricular diastole – Isovolumetric/isovolumic relaxation | – | S2 ("dub") | closed | closed |
| E1 | Ventricular diastole – Ventricular filling 1 | – | S3* | closed | open |
| E2 | Ventricular diastole – Ventricular filling 2 | – | closed | open |
Note that during isovolumetric/isovolumic contraction and relaxation, all the heart valves are closed; at no time are all the heart valves open.[1] *S3 and S4 heart sounds are associated with pathologies and are not routinely heard.
Additional images
 Ventricular systole
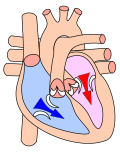 Cardiac diastole
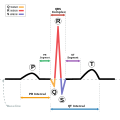 The EKG complex. P=P wave, PR=PR interval, QRS=QRS complex, QT=QT interval, ST=ST segment, T=T wave
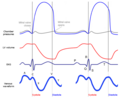 Wiggers with jugular venous waveform
 Wiggers diagram with mechanical (echo), electrical (ECG), and aortic pressure (catheter) waveforms, together with an in-ear dynamic pressure waveform measured using a novel infrasonic hemodynography technology, for a patient with severe aortic stenosis. Modified from [3]


See also
References
Wikiwand - on
Seamless Wikipedia browsing. On steroids.