Top Qs
Timeline
Chat
Perspective
West Island, Cocos (Keeling) Islands
Capital of the Cocos (Keeling) Islands From Wikipedia, the free encyclopedia
Remove ads
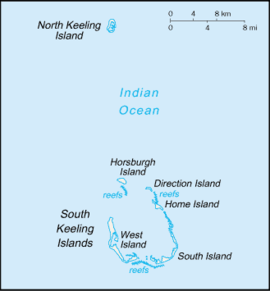
West Island (Malay: Pulau Panjang, Cocos Islands Malay: Pulu Panjang), part of the South Keeling Islands, is the capital of the Cocos (Keeling) Islands, an Australian external territory in the Indian Ocean. The population is roughly 120, making it the third smallest capital in the world, and consists mainly of Europeans. It is less populous than Home Island, the only other inhabited island.
Remove ads
West Island was part of the Clunies-Ross plantation and an airstrip was built here during World War II. As well as all the government buildings, it contains the airport, a general store and tourist accommodation. In November 2013 it was revealed that the Australian Signals Directorate operates a listening station on West Island.[1]
Remove ads
Education
Cocos Islands District High School operates a primary and secondary campus on West Island. Most of the students of that campus originate from the Australian continent.[2]
Heritage listings
West Island contains a number of heritage-listed sites, including:
- Morea Close: Administration Building Forecourt[3]
- Air Force Road: Direction Island Houses[4]
- Qantas Close: Government House[5]
- Sydney Highway: Qantas Huts[6]
- RAAF Memorial[7]
- Air Force Road: Type 2 Residences[8]
- William Keeling Crescent: Type T Houses Precinct[9]
- Orion Close: West Island Elevated Houses[10]
- Air Force Road: West Island Housing Precinct[11]
- Alexander Street: West Island Mosque[12]
Remove ads
Climate
Summarize
Perspective
West Island experiences a tropical rainforest climate (Köppen: Af, Trewartha: Aral), with hot and humid conditions experiences year round. The islands experience two seasons that often overlap: the trade wind season from May/June to September/October, and the calmer doldrum season from November through to May.[13] Precipitation is moderate to high year round, thanks to its position at the southern edge of the equatorial low pressure belt. North-west monsoons deliver rain during the doldrum, while the southeastern trade winds also give rain for much of the year.[14] Cyclones have the potential to seriously effect the flora and fauna on the island. The 1989-90 South-West Indian Ocean cyclone season caused damage to the islands, with Tropical Cyclone Walter hitting the island around 13 March 1990.[15] Extreme temperatures, however, are subdued by the influence of the Indian Ocean. Extremes only range from 32.8 °C (91.0 °F) on 23 February 2017 to 20.4 °C (68.7 °F) on 27 December 2018.
Remove ads
See also
References
Wikiwand - on
Seamless Wikipedia browsing. On steroids.
Remove ads


