Venecia, Antioquia
Municipality and town in Antioquia Department, Colombia From Wikipedia, the free encyclopedia
Venecia is a town and municipality in southwest region of the Antioquia Department, Colombia. According to the 2018 census, the population comprised 10,280 people. The town includes Cerro Tusa, a pyramid-shaped mountain, and another mountain known as Cerro Bravo.
Venecia, Antioquia | |
|---|---|
Municipality and town | |
 | |
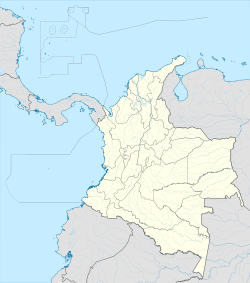
 Location of the municipality and town of Venecia, Antioquia in the Antioquia Department of Colombia | |
| Coordinates: 5°57′39″N 75°44′1″W | |
| Country | Colombia |
| Department | Antioquia Department |
| Subregion | Southwestern |
| Area | |
• Total | 141 km2 (54 sq mi) |
| Population (Census 2018[2]) | |
• Total | 10,280 |
| • Density | 73/km2 (190/sq mi) |
| Time zone | UTC-5 (Colombia Standard Time) |
The town was named after Venice, Italy because the area originally contained a large lagoon.
History
The settlement, from which later became the town, was founded on the 13 of January 1898. Venecia Municipality was isolated in a separate administrative unit in 1909.
Climate
| Climate data for Venecia (Rosario El), elevation 1,600 m (5,200 ft), (1981–2010) | |||||||||||||
|---|---|---|---|---|---|---|---|---|---|---|---|---|---|
| Month | Jan | Feb | Mar | Apr | May | Jun | Jul | Aug | Sep | Oct | Nov | Dec | Year |
| Mean daily maximum °C (°F) | 25.0 (77.0) |
25.6 (78.1) |
26.1 (79.0) |
24.9 (76.8) |
24.5 (76.1) |
25.0 (77.0) |
25.4 (77.7) |
25.2 (77.4) |
24.6 (76.3) |
23.6 (74.5) |
23.8 (74.8) |
24.4 (75.9) |
24.8 (76.6) |
| Daily mean °C (°F) | 20.3 (68.5) |
20.7 (69.3) |
21.0 (69.8) |
20.3 (68.5) |
20.1 (68.2) |
20.5 (68.9) |
20.8 (69.4) |
20.6 (69.1) |
19.9 (67.8) |
19.1 (66.4) |
19.4 (66.9) |
19.9 (67.8) |
20.2 (68.4) |
| Mean daily minimum °C (°F) | 16.0 (60.8) |
16.3 (61.3) |
16.5 (61.7) |
16.3 (61.3) |
16.1 (61.0) |
16.2 (61.2) |
16.0 (60.8) |
16.0 (60.8) |
15.6 (60.1) |
15.4 (59.7) |
15.8 (60.4) |
16.1 (61.0) |
16.0 (60.8) |
| Average precipitation mm (inches) | 92.1 (3.63) |
105.6 (4.16) |
168.6 (6.64) |
253.9 (10.00) |
345.9 (13.62) |
248.6 (9.79) |
188.1 (7.41) |
237.9 (9.37) |
297.9 (11.73) |
310.8 (12.24) |
259.0 (10.20) |
166.3 (6.55) |
2,674.7 (105.30) |
| Average precipitation days (≥ 1.0 mm) | 14 | 15 | 16 | 22 | 23 | 17 | 15 | 18 | 21 | 25 | 22 | 17 | 224 |
| Average relative humidity (%) | 72 | 70 | 69 | 76 | 78 | 74 | 69 | 70 | 75 | 80 | 80 | 76 | 74 |
| Mean monthly sunshine hours | 176.7 | 160.9 | 167.4 | 138.0 | 148.8 | 186.0 | 217.0 | 198.4 | 156.0 | 124.0 | 132.0 | 176.7 | 1,981.9 |
| Mean daily sunshine hours | 5.7 | 5.7 | 5.4 | 4.6 | 4.8 | 6.2 | 7.0 | 6.4 | 5.2 | 4.0 | 4.4 | 5.7 | 5.4 |
| Source: Instituto de Hidrologia Meteorologia y Estudios Ambientales[3] | |||||||||||||
References
Wikiwand - on
Seamless Wikipedia browsing. On steroids.


