Top Qs
Timeline
Chat
Perspective
Demographics of South Africa
From Wikipedia, the free encyclopedia

Remove ads
According to the 2022 census, the population of South Africa is about 62 million people of diverse origins, cultures, languages, and religions. With a majority being Black Africans.[3] The South African National Census of 2022 was the most recent census held; the next will be in 2032.[4]
Remove ads
.svg)
In 2011, Statistics South Africa counted 2.1 million foreigners in total.[5] Reports[specify] suggest that is an underestimation. The real figure may be as high as five million,[6] including some three million Zimbabweans.[7]
Remove ads
History

The earliest creatures that can be identified as human ancestors in South Africa are australopithecines. The first evidence of this was a child's skull found in the Taung quarry site. This was in the modern day North-West province. More fossils australopithecines were found in limestone caves Sterkfontein, Swartkrans, and Kromdaai. [8]
This section needs expansion. You can help by adding to it. (January 2022) |
Remove ads
Population
Summarize
Perspective
Earlier Censuses, 1904 to 2011
1904 Census
South African population figures for the 1904 Census.[9]
1960 Census
Sources: Statesman's Year-Book 1967–1968;[10] Europa Year Book 1969[11]
1904–85 national census numbers
Bantustan demographics were removed from South African census data during Apartheid and for this reason official figures on the national population of the country during that period will be inaccurate.[12]
1996 Census
Source: The People of South Africa: Population Census, 1996[13]

2001 Census
Source: Statistics South Africa: Census 2001[14]
2011 Census
Source: Census 2011: Census in Brief[15]
Graphs are unavailable due to technical issues. Updates on reimplementing the Graph extension, which will be known as the Chart extension, can be found on Phabricator and on MediaWiki.org. |
2022 Census
Source: Census 2022 Statistical Release[16]
Graphs are unavailable due to technical issues. Updates on reimplementing the Graph extension, which will be known as the Chart extension, can be found on Phabricator and on MediaWiki.org. |
Historical and projected population for the years 1 to 2022
UN Age and population estimates: 1950 to 2030
According to the 2019 revision of the United Nations Secretariat's World Population Prospects, South Africa's total population was 55,386,000 in 2015, compared to only 13,628,000 in 1950. In 2015, 29.3% of the people were children under the age of 15, 65.7% were between 15 and 64 years of age, and 5.0% were 65 or older.[23] All population estimates are rounded to the nearest thousand.
UN population projections: 2019 to 2100
Remove ads
Vital statistics
Summarize
Perspective
Vital statistics
The following statistics are obtained from the mid-year population estimates published by Statistics South Africa:[1]
Graphs are unavailable due to technical issues. Updates on reimplementing the Graph extension, which will be known as the Chart extension, can be found on Phabricator and on MediaWiki.org. |
Population estimates for South Africa 2002-2020
Total fertility rates by province
United Nations Population Estimates
The Population Department of the United Nations prepared the following estimates.[23] (Natural increase or decrease over a time period is the difference between that period's live births and deaths, before accounting for inward or outward migration.)
Age and sex distribution

Age and race distribution
Age distribution within each racial group
By generation
Racial composition of each age group in 2015 (estimates)
By five-year cohorts
Racial composition of each age group in 2020 (estimates)
Source:[25]
Demographic and Health Surveys
Fertility rate (TFR) (Wanted Fertility Rate) and CBR (Crude Birth Rate):[26]
Fertility rate (TFR) (Wanted Fertility Rate) by ethnic group.
Life expectancy
Life expectancy at birth from 1950 to 2020 (UN World Population Prospects):[27]

Life expectancy in South Africa 1950–2020 (per 5 yr clusters)
Graphs are unavailable due to technical issues. Updates on reimplementing the Graph extension, which will be known as the Chart extension, can be found on Phabricator and on MediaWiki.org. |
Life expectancy in South Africa 1950–2021 (per 5 yr clusters)
[28]Graphs are unavailable due to technical issues. Updates on reimplementing the Graph extension, which will be known as the Chart extension, can be found on Phabricator and on MediaWiki.org. |
Remove ads
Ethnic groups
Summarize
Perspective
.svg)
African
Coloured
Indian or other Asian
White
None dominant
Little or no population
Ethnic groups South Africa (1911)
- Black African (67%)
- White (21%)
- Coloured (9%)
- Indian (3%)
Racial groups South Africa (2022)
- Black African (81.4%)
- White (7.3%)
- Coloured (8.2%)
- Indian (2.7%)
- Other (0.4%)
Statistics South Africa asks people to describe themselves in the census in terms of five racial population groups.[29] The 2011 census figures for these groups were African at 80.2%, White at 8.4%, Coloured at 8.8%, Indian/Asian at 2.5%, and Other/Unspecified at 0.5%.[30]
The white percentage of the population has sharply declined. The first census in South Africa in 1911 showed that whites made up 22% of the population. This declined to 16% in 1980,[31] 8.9% in 2011 and 7.65% in 2022.[32]: 21 Coloured South Africans replaced Whites as the largest minority group around 2010.


Remove ads
Languages
Summarize
Perspective
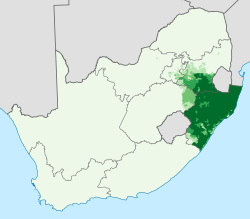
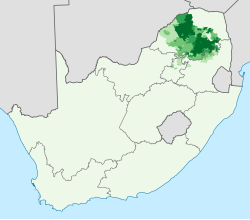
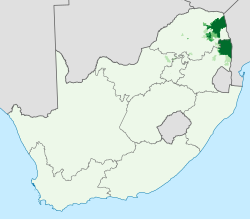
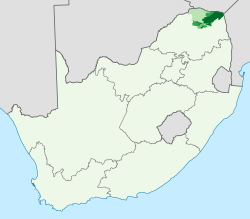
South Africa has twelve official languages:[33] isiZulu[30] 24.4%, isiXhosa[30] 16.3%, Afrikaans[30] 10.6%, English[30] 8.7%, Sepedi[30] 10.0%, Setswana[30] 8.3%, Sesotho[30] 7.8%, Xitsonga[30] 4.7%, siSwati[30] 2.8%, Tshivenda[30] 2.5%, isiNdebele[30] 1.7% and South African Sign Language.[34]
In this regard, it is third only to Bolivia and India in number. While all the languages are formally equal, some languages are spoken more than others. According to the 2022 census, the three most spoken languages in the household are Zulu (24.4%), Xhosa (16.3%), and Afrikaans (10.6%).[3]
Between 1996 and 2022, the proportion of Afrikaans speakers declined from 14.5% to 10.6% and English held steady at 8.7%, whle isiZulu grew from 22.8% to 24.4%, and Xhosa declined from 17.9% to 16.3%[35]
The country also recognises several unofficial languages, including Sekholokoe, Fanagalo, Khwe, Lobedu, Nama, Northern Ndebele, Phuthi and San.[36] These unofficial languages may be used in certain official uses in limited areas where it has been determined that these languages are prevalent. Nevertheless, their populations are not such that they require nationwide recognition.
Many of the "unofficial languages" of the San and Khoikhoi people contain regional dialects stretching northwards into Namibia and Botswana, and elsewhere. These people, who are a physically distinct population from other Africans, have their own cultural identity based on their hunter-gatherer societies. They have been marginalised to a great extent, and many of their languages are in danger of becoming extinct.
Many white South Africans also speak other European languages, such as Portuguese (also spoken by black Angolans and Mozambicans), German, Serbian and Greek, while some Indians and other Asians in South Africa speak South Asian languages, such as Bhojpuri, Tamil, Hindi, Gujarati, Urdu and Telugu. Although many South Africans are of Huguenot (French) origin, South African French is spoken by fewer than 10,000 individuals country-wide. Congolese French is also spoken in South Africa by migrants.
The primary sign language of deaf South Africans is South African Sign Language. Other sign languages among indigenous peoples are also used.
- Language maps in South Africa


By ethnicity
In 2011, the first language was Zulu for 28.1% of Black South African residents, Xhosa for 19.8%, Sepedi for 11.2%, Tswana for 9.7%, Sesotho for 9.3%, Tsonga for 5.5%, siSwati for 3.1%, Venda for 2.9%, English for 2.8%, Southern Ndebele for 2.6%, Afrikaans for 1.5%, while 3.4% had another first language.[37]
Among whites, Afrikaans was the first language for 59.1% of the population, compared to 35.0% for English. Other languages accounted for the remaining 5.9%.[37]
Remove ads
Religion
Summarize
Perspective
This section needs to be updated. (September 2020) |
Religion in South Africa (2022 census)[38]
- Christianity (85.3%)
- Traditional African religions (7.8%)
- Islam (1.6%)
- Hinduism (1.1%)
- Judaism (0.1%)
- Atheism (0.1%)
- Agnosticism (0.1%)
- Other (1%)
- No religious affiliation (2.9%)
According to the 2022 national census, Christians accounted for 85.3% of the population.[3] This includes[when?] Protestant (36.6%), Zionist Christian (11.1%), Pentecostal/Charismatic (8.2%), Roman Catholic (7.1%), Methodist (6.8%), Dutch Reformed (6.7%), Anglican (3.8%); members of other Christian churches accounted for another 36% of the population. Muslims accounted for 1.5% of the population, Other 2.3%, and 1.4% were Unspecified and None 15.1%.[citation needed]
Muslims are largely found among the Coloured and Indian ethnic groups. They have been joined by black or white South African converts as well as immigrants from other parts of Africa.[39] South African Muslims claim that their faith is the fastest-growing religion of conversion in the country, with the number of black Muslims growing sixfold, from 12,000 in 1991 to 74,700 in 2004.[39][40]
The Hindu population has its roots in the British colonial period, but later waves of immigration from India have also contributed to it. Most Hindus are of South Asian origin, but there are many who come from mixed racial stock. Some are converts due to the efforts of ISKCON.
Other minority religions in South Africa are Sikhism, Jainism, Baháʼí Faith and Judaism.[41]
By ethnicity
86.0% of black residents are Christian, 3.0% have no religion, 0.3% are Muslim, 0.0% are Jewish, 0.0% are Hindu, 9.5% Traditional African and 1.2% have other or undetermined beliefs (2022 Census).
90.1% of white residents are Christian, 4.9% have no religion, 0.3% are Muslim, 0.7% are Jewish, and 0.1% are Hindu. 3.9% have other or undetermined beliefs (2022 Census).
Remove ads
Other demographic statistics
Summarize
Perspective

The following demographics are from the CIA World Factbook[42] unless otherwise indicated.
Population
- 57,516,665 (2022 est.)
- 55,380,210 (July 2018 est.)
Age structure
- 0-14 years: 27.94% (male 7,894,742/female 7,883,266)
- 15-24 years: 16.8% (male 4,680,587/female 4,804,337)
- 25-54 years: 42.37% (male 12,099,441/female 11,825,193)
- 55-64 years: 6.8% (male 1,782,902/female 2,056,988)
- 65 years and over: 6.09% (2020 est.) (male 1,443,956/female 1,992,205)
- 0-14 years: 28.18% (male 7,815,651 /female 7,793,261)
- 15-24 years: 17.24% (male 4,711,480 /female 4,837,897)
- 25-54 years: 42.05% (male 11,782,848 /female 11,503,831)
- 55-64 years: 6.71% (male 1,725,034 /female 1,992,035)
- 65 years and over: 5.81% (male 1,351,991 /female 1,866,182) (2018 est.)
Birth rate
- 18.56 births/1,000 population (2022 est.) Country comparison to the world: 77th
- 19.9 births/1,000 population (2018 est.) Country comparison to the world: 78th
Death rate
- 9.26 deaths/1,000 population (2022 est.) Country comparison to the world: 52nd
- 9.3 deaths/1,000 population (2018 est.) Country comparison to the world: 57th
Total fertility rate
- 2.18 children born/woman (2022 est.) Country comparison to the world: 90th
- 2.26 children born/woman (2018 est.) Country comparison to the world: 91st
Population growth rate
- 0.93% (2022 est.) Country comparison to the world: 103rd
- 0.97% (2018 est.) Country comparison to the world: 114th
Median age
- Total: 28 years. Country comparison to the world: 142nd
- Male: 27.9 years
- Female: 28.1 years (2020 est.)
- Total: 27.4 years. Country comparison to the world: 144th
- Male: 27.2 years
- Female: 27.6 years (2018 est.)
Contraceptive prevalence rate
- 54.6% (2016)
Net migration rate
- 0 migrant(s)/1,000 population (2022 est.) Country comparison to the world: 98th
- -0.9 migrant(s)/1,000 population (2018 est.) Country comparison to the world: 138th
Dependency ratios
- Total dependency ratio: 52.5 (2015 est.)
- Youth dependency ratio: 44.8 (2015 est.)
- Elderly dependency ratio: 7.7 (2015 est.)
- Potential support ratio: 12.9 (2015 est.)
Urbanization
- Urban population: 68.3% of total population (2022)
- Rate of urbanization: 1.72% annual rate of change (2020-25 est.)
- Urban population: 66.4% of total population (2018)
- Rate of urbanization: 1.97% annual rate of change (2015-20 est.)
Life expectancy at birth
- Total population: 65.32 years. Country comparison to the world: 202nd
- Male: 63.99 years
- Female: 66.68 years (2022 est.)
- Total population: 64.1 years (2018 est.)
Major infectious diseases
- Degree of risk: intermediate (2020)
- Food or waterborne diseases: bacterial diarrhea, hepatitis A, and typhoid fever
- Water contact diseases: schistosomiasis
note: widespread ongoing transmission of a respiratory illness caused by the novel coronavirus (COVID-19) is occurring throughout South Africa; as of 6 June 2022, South Africa has reported a total of 3,968,205 cases of COVID-19 or 6,690.7 cumulative cases of COVID-19 per 100,000 population with a total of 101,317 cumulative deaths or a rate of 170.83 cumulative deaths per 100,000 population; as of 6 June 2022, 36.33% of the population has received at least one dose of COVID-19 vaccine
Ethnic groups
- Black African 80.9%, coloured 8.8%, white 7.8%, Indian/Asian 2.6% (2021 est.)
Languages

- isiZulu (official) 24.7%, isiXhosa (official) 15.6%, Afrikaans (official) 12.1%, Sepedi (official) 9.8%, Setswana (official) 8.9%, English (official) 8.4%, Sesotho (official) 8%, Xitsonga (official) 4%, siSwati (official) 2.6%, Tshivenda (official) 2.5%, Khoi, Nama, and San languages 1.9% isiNdebele (official) 1.6% (2017 est.)
- note: data represent language spoken most often at home
Education expenditures
- 6.8% of GDP (2020) Country comparison to the world: 22nd
- 6.1% of GDP (2017) Country comparison to the world: 34th
Literacy
Definition: age 15 and over can read and write (2015 est.)
- Total population: 95%
- Male: 95.5%
- Female: 94.5% (2019)
- Total population: 94.4%
- Male: 95.4%
- Female: 95.4% (2015 est.)
School life expectancy (primary to tertiary education)
- Total: 14 years
- Male: 13 years
- Female: 14 years (2019)
Unemployment, youth ages 15-24
- Total: 59.4%
- Male: 55.4%
- Female: 64.1% (2020 est.)
Remove ads
Immigration
Summarize
Perspective

South Africa hosts a sizeable refugee and asylum seeker population. According to the World Refugee Survey 2008, published by the U.S. Committee for Refugees and Immigrants, this population numbered approximately 144,700 in 2007.[43] Groups of refugees and asylum seekers numbering over 10,000 included people from Zimbabwe (48,400), the Democratic Republic of the Congo (24,800), and Somalia (12,900).[43] These populations mainly lived in Johannesburg, Pretoria, Durban, Cape Town, and Port Elizabeth.[43] Many refugees have now also started to work and live in rural areas in provinces such as Mpumalanga and KwaZulu-Natal.
Statistics SA assumes in some of their calculations that there are fewer than 2 million immigrants in South Africa.[44] Other institutions, like the police and Médecins Sans Frontières place estimate the figure at 4 million.[45][46][47][48]
Immigration figures
Main countries of immigration in South Africa according to the 2011 Census and 2022 Census:
Immigration assumptions by Statistics South Africa to South Africa based on race. Negative numbers represent net migration from South Africa to other countries.[50]
Graphs are unavailable due to technical issues. Updates on reimplementing the Graph extension, which will be known as the Chart extension, can be found on Phabricator and on MediaWiki.org. |
Immigration to SA by Race
(Negative values indicate net migration from SA elsewhere)
(Negative values indicate net migration from SA elsewhere)
Remove ads
Urbanisation
"Urban areas contain about two-thirds of the population; many of these consist of huge informal or squatter settlements."[51]
Graphs and maps
 Population pyramid by population group, 2011
 Black population
 White population
 Coloured population
 Indian population

See also
References
Further reading
External links
Wikiwand - on
Seamless Wikipedia browsing. On steroids.
Remove ads