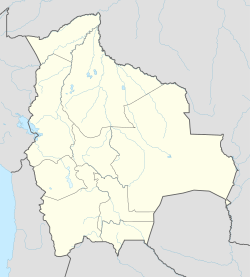
Punata
Place in Cochabamba Department, Bolivia From Wikipedia, the free encyclopedia
Punata is the capital of Punata Province and Punata Municipality in Cochabamba Department, Bolivia. At the time of census 2012 it had a population of 19,559 inhabitants [1] and at the census 2012 the populations rose to 28.707 inhabitants. People from Punata and surrounding areas used to be called “Vallunos” meaning coming from the valleys of Punata and other surrounding small towns. Punata is renowned for its wonderful agricultural market held every Tuesday where people from surrounding towns and rural villages come to sell and buy.
Punata | |
|---|---|
 John the Baptist (San Juan Bautista) church in Punata and Plaza 18 de mayo | |
| Coordinates: 17°33′S 65°50′W | |
| Country | Bolivia |
| Department | Cochabamba Department |
| Province | Punata Province |
| Municipality | Punata Municipality |
| Canton | Punata Canton |
| Elevation | 8,373 ft (2,552 m) |
| Population (2012) | |
• Total | 19,559 |
| Time zone | UTC-4 (BOT) |
Climate
| Climate data for Punata (San Benito), elevation 2,710 m (8,890 ft) | |||||||||||||
|---|---|---|---|---|---|---|---|---|---|---|---|---|---|
| Month | Jan | Feb | Mar | Apr | May | Jun | Jul | Aug | Sep | Oct | Nov | Dec | Year |
| Record high °C (°F) | 35.3 (95.5) |
33.0 (91.4) |
34.0 (93.2) |
34.0 (93.2) |
33.0 (91.4) |
32.0 (89.6) |
31.0 (87.8) |
33.0 (91.4) |
31.4 (88.5) |
33.0 (91.4) |
35.4 (95.7) |
35.2 (95.4) |
35.4 (95.7) |
| Mean daily maximum °C (°F) | 24.0 (75.2) |
23.9 (75.0) |
24.5 (76.1) |
25.4 (77.7) |
25.4 (77.7) |
24.5 (76.1) |
24.2 (75.6) |
24.7 (76.5) |
25.0 (77.0) |
26.0 (78.8) |
26.3 (79.3) |
25.4 (77.7) |
24.9 (76.9) |
| Daily mean °C (°F) | 17.0 (62.6) |
16.8 (62.2) |
16.5 (61.7) |
15.5 (59.9) |
13.3 (55.9) |
11.6 (52.9) |
11.7 (53.1) |
13.1 (55.6) |
14.9 (58.8) |
16.6 (61.9) |
17.6 (63.7) |
17.6 (63.7) |
15.2 (59.3) |
| Mean daily minimum °C (°F) | 10.0 (50.0) |
9.6 (49.3) |
8.4 (47.1) |
5.6 (42.1) |
1.2 (34.2) |
−1.2 (29.8) |
−0.8 (30.6) |
1.6 (34.9) |
4.8 (40.6) |
7.2 (45.0) |
8.9 (48.0) |
9.9 (49.8) |
5.4 (41.8) |
| Record low °C (°F) | 0.0 (32.0) |
1.7 (35.1) |
−2.0 (28.4) |
−3.5 (25.7) |
−9.0 (15.8) |
−10.0 (14.0) |
−9.0 (15.8) |
−7.0 (19.4) |
−7.0 (19.4) |
−1.5 (29.3) |
−2.0 (28.4) |
1.5 (34.7) |
−10.0 (14.0) |
| Average precipitation mm (inches) | 98.6 (3.88) |
70.0 (2.76) |
51.8 (2.04) |
17.5 (0.69) |
5.2 (0.20) |
1.5 (0.06) |
1.5 (0.06) |
4.3 (0.17) |
9.4 (0.37) |
18.1 (0.71) |
40.1 (1.58) |
74.1 (2.92) |
392.1 (15.44) |
| Average precipitation days | 13.2 | 10.5 | 8.8 | 3.7 | 1.0 | 0.5 | 0.5 | 1.5 | 2.5 | 4.0 | 6.5 | 10.6 | 63.3 |
| Average relative humidity (%) | 66.0 | 68.8 | 67.8 | 63.1 | 58.3 | 57.5 | 58.0 | 59.3 | 53.2 | 54.7 | 55.3 | 61.2 | 60.3 |
| Source: Servicio Nacional de Meteorología e Hidrología de Bolivia[2][3] | |||||||||||||
See also
- Irrigation in alluvial fans including the alluvial fan of Punata
References
External links
Wikiwand - on
Seamless Wikipedia browsing. On steroids.


