Mount Grant (Nevada)
Mountain in Nevada, United States From Wikipedia, the free encyclopedia
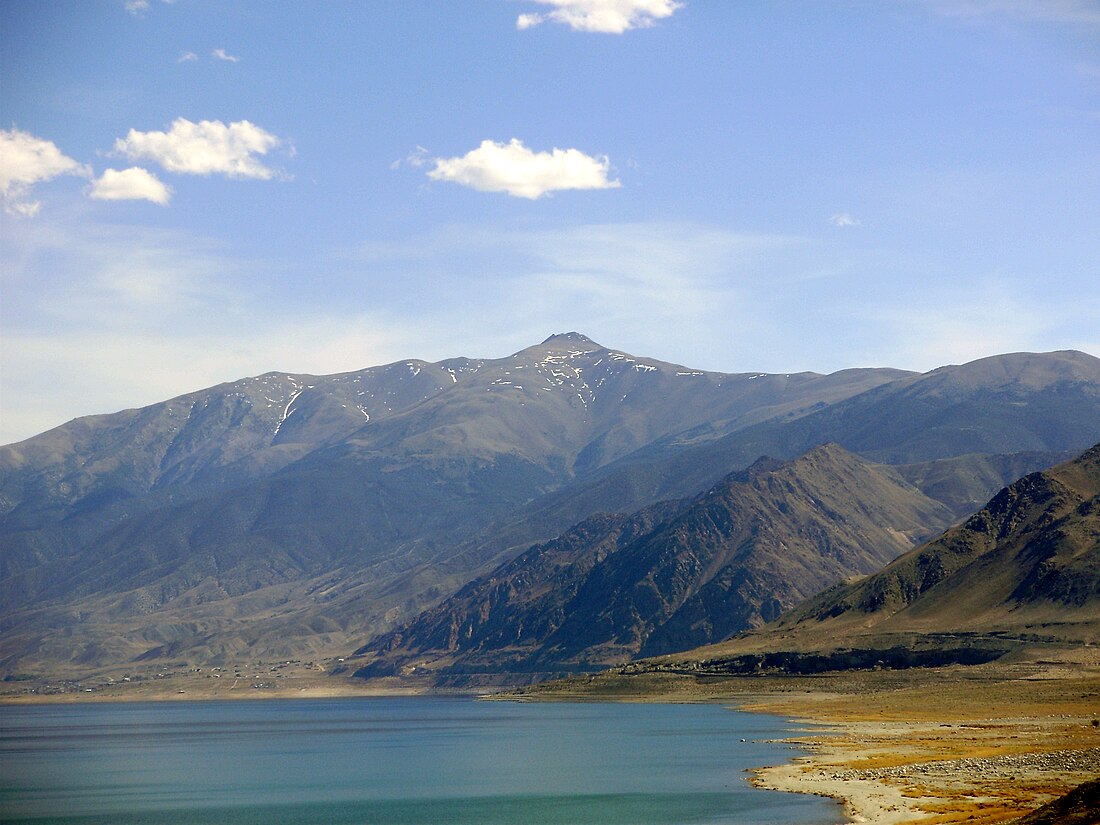
Mount Grant is both the highest and most topographically prominent mountain in both the Wassuk Range and Mineral County in Nevada, United States. It ranks thirteenth among the most topographically prominent peaks in the state.[3] The peak is located within the Hawthorne Army Depot, resulting in very limited public access.[4]
| Mount Grant | |
|---|---|
 Mount Grant, with Walker Lake in the foreground | |
| Highest point | |
| Elevation | 11,285 ft (3,440 m) NAVD 88[1] |
| Prominence | 3,920 ft (1,195 m)[1] |
| Listing | Nevada County High Points 7th[2] |
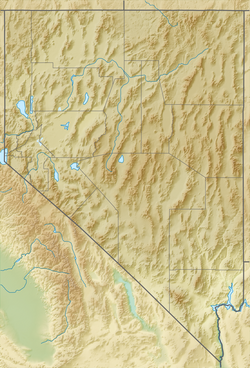
| Coordinates | 38°34′06″N 118°47′28″W[1] |
| Geography | |
| Location | Mineral County, Nevada, U.S. |
| Parent range | Wassuk Range |
| Topo map | USGS MOUNT GRANT |
Mount Grant was named after Ulysses S. Grant (1822–1885), general of the Union during the American Civil War and afterward 18th President of the United States.[5]
Mount Grant (Northern Paiute: Kurangwa), plays a major role in the creation story of the groups of Northern Paiute people whose ancestors periodically lived near the mountain during their seasonal migrations. Kurangwa is a sacred being to them and is responsible for the creation of the Walker Lake (Agai Pah).[6]
Climate
| Climate data for Mount Grant (NV) 38.5686 N, 118.7908 W, Elevation: 10,938 ft (3,334 m) (1991–2020 normals) | |||||||||||||
|---|---|---|---|---|---|---|---|---|---|---|---|---|---|
| Month | Jan | Feb | Mar | Apr | May | Jun | Jul | Aug | Sep | Oct | Nov | Dec | Year |
| Mean daily maximum °F (°C) | 31.1 (−0.5) |
29.3 (−1.5) |
32.1 (0.1) |
36.7 (2.6) |
45.3 (7.4) |
55.9 (13.3) |
64.9 (18.3) |
64.1 (17.8) |
57.6 (14.2) |
47.4 (8.6) |
36.9 (2.7) |
30.4 (−0.9) |
44.3 (6.8) |
| Daily mean °F (°C) | 22.3 (−5.4) |
20.3 (−6.5) |
22.7 (−5.2) |
26.2 (−3.2) |
33.4 (0.8) |
42.9 (6.1) |
51.0 (10.6) |
50.1 (10.1) |
44.8 (7.1) |
36.2 (2.3) |
28.0 (−2.2) |
22.2 (−5.4) |
33.3 (0.8) |
| Mean daily minimum °F (°C) | 13.5 (−10.3) |
11.4 (−11.4) |
13.2 (−10.4) |
15.7 (−9.1) |
21.5 (−5.8) |
29.9 (−1.2) |
37.0 (2.8) |
36.1 (2.3) |
31.9 (−0.1) |
25.0 (−3.9) |
19.2 (−7.1) |
14.0 (−10.0) |
22.4 (−5.4) |
| Average precipitation inches (mm) | 3.30 (84) |
2.96 (75) |
2.98 (76) |
1.92 (49) |
1.53 (39) |
0.82 (21) |
0.92 (23) |
0.71 (18) |
0.70 (18) |
1.35 (34) |
1.88 (48) |
2.97 (75) |
22.04 (560) |
| Source: PRISM Climate Group[7] | |||||||||||||
See also
References
Wikiwand - on
Seamless Wikipedia browsing. On steroids.

