Mariscal Estigarribia
Town in Boquerón, Paraguay From Wikipedia, the free encyclopedia
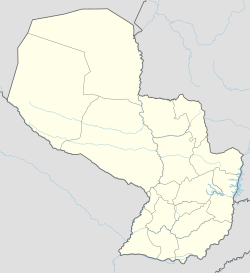
Mariscal Estigarribia (Spanish pronunciation: [maɾisˈkal estiɣaˈriβja]) is a town in the Boquerón Department, Paraguay.
Mariscal Estigarribia | |
|---|---|
 Old cathedral of Mariscal Estigarribia | |
| Coordinates: 22°2′0″S 60°38′0″W | |
| Country | Paraguay |
| Department | Boquerón |
| Climate | Aw/BSh |
Strategic importance
Summarize
Perspective
Mariscal Estigarribia is home to Dr. Luis María Argaña International Airport (IATA code: ESG),[1]. Some media reports[who?] claim it is a US military base set up to provide access to the strategic Triple Frontera region.
400 US troops arrived in Paraguay in July 2005, shortly after the Paraguayan Senate granted US troops diplomatic immunity. Hundreds of US military personnel are rotated through Paraguay each year, though the military has stated that the total number in the country will not exceed 10–20 at any time.[2]
The Clarín newspaper reports that Mariscal Estigarribia would be a strategic location for a military base because of its proximity to the Triple Frontera between Paraguay, Brazil and Argentina; the Guarani aquifer; and Bolivia (less than 200 km at a time when "Washington's magnifying glass goes on the Altiplano and points toward Venezuelan Hugo Chávez—the regional demon according to Bush's administration—as the instigator of the instability in the region".)[3]
The US and Paraguayan governments deny that the US military is establishing a base at Mariscal Estigarribia. The US government said "...limited, short-term deployments of U.S. military personnel are scheduled to take place for a series of joint exercises with the Paraguayan military between July 2005 and December 2006. Most personnel deployed will not remain in Paraguay for more than 45 days."[4]
A Brazilian weekly news magazine, CartaCapital, published an investigative article on 25 April 2008, that dismisses what it calls a conspiracy theory about the base.[citation needed]
Climate
Summarize
Perspective
Mariscal Estigarribia lies right on the boundary of a tropical savanna climate (Köppen Aw) and a hot semi-arid climate (BSh). It is characterised by sweltering summers with occasional heavy thunderstorms, and dry winters with very warm afternoons and usually pleasant mornings. The minimum temperature of 34.0 °C (93.2 °F) recorded on November 13, 2023 in Mariscal José Félix Estigarribia, is considered the highest minimum temperature recorded in South America.[5]
| Climate data for Mariscal Estigarribia (1991-2020, extremes 1961-present) | |||||||||||||
|---|---|---|---|---|---|---|---|---|---|---|---|---|---|
| Month | Jan | Feb | Mar | Apr | May | Jun | Jul | Aug | Sep | Oct | Nov | Dec | Year |
| Record high °C (°F) | 46.4 (115.5) |
42.6 (108.7) |
43.0 (109.4) |
39.0 (102.2) |
37.2 (99.0) |
36.2 (97.2) |
37.8 (100.0) |
40.6 (105.1) |
43.6 (110.5) |
44.5 (112.1) |
44.5 (112.1) |
44.2 (111.6) |
46.4 (115.5) |
| Mean daily maximum °C (°F) | 36.1 (97.0) |
34.8 (94.6) |
33.6 (92.5) |
30.9 (87.6) |
27.1 (80.8) |
26.0 (78.8) |
26.7 (80.1) |
30.2 (86.4) |
32.7 (90.9) |
34.8 (94.6) |
35.1 (95.2) |
35.7 (96.3) |
32.0 (89.6) |
| Daily mean °C (°F) | 28.5 (83.3) |
27.5 (81.5) |
26.3 (79.3) |
23.9 (75.0) |
20.3 (68.5) |
19.2 (66.6) |
18.7 (65.7) |
21.3 (70.3) |
24.0 (75.2) |
26.7 (80.1) |
27.3 (81.1) |
28.2 (82.8) |
24.3 (75.7) |
| Mean daily minimum °C (°F) | 23.1 (73.6) |
22.7 (72.9) |
21.5 (70.7) |
19.0 (66.2) |
15.5 (59.9) |
14.0 (57.2) |
12.6 (54.7) |
14.6 (58.3) |
17.3 (63.1) |
20.8 (69.4) |
21.6 (70.9) |
22.9 (73.2) |
18.8 (65.8) |
| Record low °C (°F) | 13.0 (55.4) |
10.6 (51.1) |
9.2 (48.6) |
6.0 (42.8) |
−0.5 (31.1) |
−2.0 (28.4) |
−5.1 (22.8) |
−4.0 (24.8) |
3.4 (38.1) |
8.6 (47.5) |
8.4 (47.1) |
12.2 (54.0) |
−5.1 (22.8) |
| Average precipitation mm (inches) | 119.2 (4.69) |
119.2 (4.69) |
107.2 (4.22) |
70.2 (2.76) |
38.4 (1.51) |
20.7 (0.81) |
6.8 (0.27) |
7.5 (0.30) |
15.5 (0.61) |
52.9 (2.08) |
88.1 (3.47) |
112.8 (4.44) |
759.6 (29.91) |
| Average precipitation days (≥ 0.1 mm) | 9 | 7 | 8 | 8 | 6 | 4 | 3 | 3 | 3 | 5 | 7 | 8 | 71 |
| Average relative humidity (%) | 63 | 65 | 67 | 70 | 70 | 69 | 62 | 56 | 52 | 53 | 58 | 62 | 62 |
| Mean monthly sunshine hours | 244.3 | 254.8 | 209.3 | 224.3 | 187.7 | 150.4 | 180.0 | 227.0 | 232.6 | 205.7 | 239.0 | 223.6 | 2,580.5 |
| Source 1: NOAA (extremes, precipitation days, humidity 1961-1990)[6][7][8] | |||||||||||||
| Source 2: Meteo Climat (sun, 1991-2020),[9] Ogimet[10][11][12][13][14][15] | |||||||||||||
References
External links
Wikiwand - on
Seamless Wikipedia browsing. On steroids.

