Parliamentary constituencies in Cornwall
From Wikipedia, the free encyclopedia
The ceremonial county of Cornwall, which includes the Isles of Scilly, is divided into six parliamentary constituencies. They are all county constituencies.
Parliamentary history of Cornwall
Summarize
Perspective
Four of the six Cornish parliamentary seats are currently held by Labour, a party that had no seats in Cornwall between the 2005 and 2024 general elections. Two are held by the Liberal Democrats since the 2024 election, after previously winning all the Cornish constituencies in 2005 then losing three to the Conservatives in 2010, and losing the remaining three to the Conservatives in 2015. The Conservatives, who had won no Cornish seats in 1997, 2001 and 2005, held three from 2010 and all six from 2015 to 2024. In 2017, several previous Liberal Democrat candidates, including previous MPs Andrew George and Steve Gilbert stood in their old seats, but failed to be re-elected. In all six seats, the Labour vote surged, pushing the Liberal Democrats into third place in four of the six seats. In the 2019 election, Labour retained their position as the second-placed party in most of the Cornish seats, with their vote holding up far better in the region than elsewhere in the country.
In the 2024 election, the Conservatives lost all six seats, four of them going to Labour and the other two going to the Liberal Democrats, with Andrew George (MP for St Ives 1997–2015) retaking his St Ives seat for the first time since 2015 – George has stood in his St Ives constituency in every election since 1992, winning in six out of nine elections. This marked the first time since 2005 that the Conservatives held no seats in Cornwall, the first time since 2015 that the Liberal Democrats held any seats, and the first time since 2005 that the Labour Party held any seats. It is also the first time in history that the Labour Party has held a majority of Cornish seats, as well as the most seats they have ever gained there, previously only holding one seat in a number of elections, and thus is their best result in Cornwall ever. Reform UK failed to win any seats in Cornwall but came third in five out of six seats and fourth in the remaining seat, while the Green Party came fifth in all six seats and increased their vote share in all seats.
Constituencies
Summarize
Perspective
Labour † Conservative ‡ Liberal Democrat ¤
| Constituency | Electorate[1] | Majority[1][nb 1] | Member of Parliament[1] | Nearest opposition[1] | Current electoral wards[2][3] | Map | ||
|---|---|---|---|---|---|---|---|---|
| Camborne and Redruth | 74,382 | 7,806 | Perran Moon † | Connor Donnithorne ‡ |
|
 | ||
| North Cornwall | 76,741 | 10,767 | Ben Maguire ¤ | Scott Mann ‡ |
|
 | ||
| South East Cornwall | 72,654 | 1,911 | Anna Gelderd † | Sheryll Murray ‡ |
|
 | ||
| St Austell and Newquay | 76,076 | 2,470 | Noah Law † | Steve Double ‡ |
|
 | ||
| St Ives | 69,978 | 13,786 | Andrew George ¤ | Derek Thomas ‡ |
Isles of Scilly |
 | ||
| Truro and Falmouth | 72,982 | 8,151 | Jayne Kirkham † | Cherilyn Mackrory ‡ |
|
 | ||
Boundary changes
Summarize
Perspective
2024
See 2023 Periodic Review of Westminster constituencies for further details.
| Name | Boundaries 2010–2024 | Name | Boundaries 2024–present |
|---|---|---|---|
 |
 | ||
For the 2023 Periodic Review of Westminster constituencies, which redrew the constituency map ahead of the 2024 United Kingdom general election, the Boundary Commission for England retained the six existing parliamentary constituencies in Cornwall with the same names and relatively minor alterations compared to other parts of the country.[4]
2010
Under the Fifth Periodic Review of Westminster constituencies, the Boundary Commission for England decided to increase the number of seats which covered Cornwall from 5 to 6. Falmouth and Camborne, and Truro and St Austell were abolished and replaced by Camborne and Redruth, St Austell and Newquay, and Truro and Falmouth.
| Name (1997-2010) | Boundaries 1997–2010 | Name (2010-2024) | Boundaries 2010–2024 |
|---|---|---|---|
 |
| ||
Results history
Summarize
Perspective
Primary data source: House of Commons research briefing – General election results from 1918 to 2019[5]
Vote breakdown
| Year | Labour | Conservative | Liberal Democrats | Reform | Green | UKIP | Mebyon Kernow | Others | Notes | |||||||||||||||
|---|---|---|---|---|---|---|---|---|---|---|---|---|---|---|---|---|---|---|---|---|---|---|---|---|
| Votes | % | -/+ | Votes | % | -/+ | Votes | % | -/+ | Votes | % | -/+ | Votes | % | -/+ | Votes | % | -/+ | Votes | % | -/+ | Votes | % | ||
| 2024 | 77,517 | 26.4 | +3.3 | 76,817 | 26.2 | -27.6 | 72,881 | 24.8 | +5.5 | 48,574 | 16.6 | +16.6 | 13,778 | 4.7 | +2.5 | 111 | 0.0 | +0.0 | did not contest | 3,629 | 1.3 | |||
| 2019 | 74,392 | 23.1 | -3.6 | 173,027 | 53.8 | +5.4 | 62,165 | 19.3 | -4.2 | did not contest | 7,129 | 2.2 | +1.1 | did not contest | 1,660 | 0.5 | +0.5 | 3,602 | 1.1 | |||||
| 2017 | 83,968 | 26.7 | +14.4 | 152,428 | 48.4 | +5.3 | 73,875 | 23.5 | +1.1 | did not exist | 3,218 | 1.0 | -4.8 | 897 | 0.3 | -13.5 | did not contest | 323 | 0.1 | |||||
| 2015 | 36,235 | 12.3 | +3.7 | 127,079 | 43.1 | +2.2 | 66,056 | 22.4 | -19.4 | 17,241 | 5.8 | +4.5 | 40,785 | 13.8 | +8.9 | 5,675 | 1.9 | 1,757 | 0.6 | |||||
| 2010 | 24,257 | 8.6 | -7.0 | 115,016 | 40.9 | +9.1 | 117,307 | 41.8 | -2.6 | 3,573 | 1.3 | +0.6 | 13,763 | 4.9 | -0.1 | 5,379 | 1.9 | +0.5 | 1,586 | 0.6 | ||||
| 2005 | 41,140 | 15.6 | -1.7 | 82,543 | 31.8 | -0.8 | 115,241 | 44.4 | -0.4 | 1,738 | 0.7 | +0.7 | 12,863 | 5.0 | +1.3 | 3,552 | 1.4 | +0.1 | 2,356 | 0.9 | ||||
| 2001 | 43,674 | 17.3 | +0.2 | 82,227 | 32.6 | +2.2 | 113,000 | 44.8 | +0.9 | did not contest | 9,290 | 3.7 | +2.7 | 3,199 | 1.3 | +0.6 | 727 | 0.3 | ||||||
| 1997 | 47,913 | 17.1 | +3.2 | 85,077 | 30.4 | -12.3 | 123,124 | 43.9 | +2.2 | 482 | 0.2 | -0.1 | 2,926 | 1.0 | +1.0 | 1,906 | 0.7 | +0.7 | 18,779 | 6.7 | ||||
| 1992 | 41,593 | 13.9 | +1.3 | 127,678 | 42.7 | -4.6 | 124,553 | 41.7 | +1.7 | 1,035 | 0.3 | +0.3 | did not exist | did not contest | 4,098 | 1.4 | ||||||||
| 1987 | 34,994 | 12.6 | +3.7 | 131,194 | 47.3 | -2.0 | 111,064 | 40.0 | -0.8 | did not contest | did not contest | 373 | 0.1 | |||||||||||
| 1983 | 22,838 | 8.9 | -3.7 | 126,182 | 49.3 | -1.3 | 104,365 | 40.8 | +6.6 | 776 | 0.3 | -0.2 | 1,151 | 0.5 | -1.1 | 677 | 0.3 | |||||||
Percentage votes
| Election year | 1923 | 1924 | 1929 | 1945 | 1950 | 1951 | 1955 | 1959 | 1964 | 1966 | 1970 | 1974
(Feb) |
1974
(Oct) |
1979 | 1983 | 1987 | 1992 | 1997 | 2001 | 2005 | 2010 | 2015 | 2017 | 2019 | 2024 |
|---|---|---|---|---|---|---|---|---|---|---|---|---|---|---|---|---|---|---|---|---|---|---|---|---|---|
| Labour | 2.3 | 9.7 | 18.1 | 25.4 | 29.6 | 33.3 | 30.7 | 27.5 | 25.9 | 27.6 | 24.6 | 19.6 | 20.0 | 12.6 | 8.9 | 12.6 | 13.9 | 17.1 | 17.3 | 15.9 | 8.6 | 12.3 | 26.7 | 23.1 | 26.4 |
| Conservative1 | 35.0 | 48.6 | 38.4 | 42.0 | 44.2 | 50.5 | 48.5 | 43.8 | 41.1 | 41.1 | 47.9 | 41.8 | 43.6 | 50.6 | 49.3 | 47.3 | 42.7 | 30.4 | 32.6 | 31.8 | 40.9 | 43.1 | 48.4 | 53.8 | 26.2 |
| Liberal Democrat2 | 52.6 | 41.7 | 42.4 | 32.6 | 26.2 | 16.2 | 20.8 | 28.7 | 32.8 | 30.6 | 27.0 | 38.2 | 35.2 | 34.2 | 40.8 | 40.0 | 41.7 | 44.0 | 44.8 | 44.4 | 41.8 | 22.4 | 23.5 | 19.3 | 24.8 |
| Reform | – | – | – | – | – | – | – | – | – | – | – | – | – | – | – | – | – | – | – | – | – | – | – | – | 16.6 |
| Green Party | – | – | – | – | – | – | – | – | – | – | – | – | – | – | – | * | * | * | * | * | 1.3 | 5.8 | 1.0 | 2.2 | 4.7 |
| UKIP | – | – | – | – | – | – | – | – | – | – | – | – | – | – | – | – | – | * | * | * | 4.9 | 13.8 | 0.3 | – | 0.0 |
| Other | 10.0 | – | 1.2 | 0.4 | – | – | – | – | 0.1 | 0.7 | 0.4 | 0.4 | 1.2 | 2.6 | 1.0 | 0.1 | 1.7 | 8.6 | 5.2 | 7.9 | 2.5 | 2.5 | 0.1 | 1.6 | 1.3 |
1Includes Constitutionalist in 1924 and National Liberal Party up to 1966
21950–1979 – Liberal; 1983 & 1987 – SDP-Liberal Alliance
Meaningful vote percentages are not applicable for the elections of 1918, 1922, 1931 and 1935 since one or more seats were gained unopposed.
Seats
| Election year | 1918 | 1922 | 1923 | 1924 | 1929 | 1931 | 1935 | 1945 | 1950 | 1951 | 1955 | 1959 | 1964 | 1966 | 1970 | 1974
(Feb) |
1974
(Oct) |
1979 | 1983 | 1987 | 1992 | 1997 | 2001 | 2005 | 2010 | 2015 | 2017 | 2019 | 2024 |
|---|---|---|---|---|---|---|---|---|---|---|---|---|---|---|---|---|---|---|---|---|---|---|---|---|---|---|---|---|---|
| Labour | 0 | 0 | 0 | 0 | 0 | 0 | 0 | 1 | 1 | 1 | 1 | 1 | 1 | 1 | 0 | 0 | 0 | 0 | 0 | 0 | 0 | 1 | 1 | 0 | 0 | 0 | 0 | 0 | 4 |
| Liberal Democrat2 | 2 | 1 | 4 | 0 | 5 | 2 | 1 | 1 | 0 | 0 | 0 | 0 | 1 | 2 | 1 | 2 | 2 | 1 | 1 | 1 | 2 | 4 | 4 | 5 | 3 | 0 | 0 | 0 | 2 |
| Conservative1 | 2 | 2 | 0 | 5 | 0 | 3 | 4 | 3 | 4 | 4 | 4 | 4 | 3 | 2 | 4 | 3 | 3 | 4 | 4 | 4 | 3 | 0 | 0 | 0 | 3 | 6 | 6 | 6 | 0 |
| National Liberal | 1 | 2 | 0 | 0 | 0 | 0 | 0 | 0 | 0 | 0 | 0 | 0 | 0 | 0 | 0 | 0 | 0 | 0 | 0 | 0 | 0 | 0 | 0 | 0 | 0 | 0 | 0 | 0 | 0 |
| Independent Liberal | 0 | 0 | 1 | 0 | 0 | 0 | 0 | 0 | 0 | 0 | 0 | 0 | 0 | 0 | 0 | 0 | 0 | 0 | 0 | 0 | 0 | 0 | 0 | 0 | 0 | 0 | 0 | 0 | 0 |
| Total | 5 | 5 | 5 | 5 | 5 | 5 | 5 | 5 | 5 | 5 | 5 | 5 | 5 | 5 | 5 | 5 | 5 | 5 | 5 | 5 | 5 | 5 | 5 | 5 | 6 | 6 | 6 | 6 | 6 |
1Includes Constitutionalist in 1924 and National Liberal Party up to 1966
2pre-1979 – Liberal; 1983 & 1987 – SDP-Liberal Alliance
Maps
1885–1910
 1885
1885 1886
1886- 1892
 1895
1895 1900
1900 1906
1906 Jan 1910
 Dec 1910


1918–1945
 1918
1918 1922
1922 1923
1923 1924
1924 1929
1929 1931
1931 1935
1935 1945
1945


1950–present
 1950
1950- 1951
 1955
1955- 1959
 1964
1964 1966
1966 1970
1970 1974 Feb
 1974 Oct
 1979
1979 1983
1983- 1987
 1992
1992 1997
1997- 2001
 2005
2005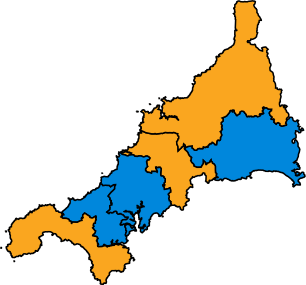 2010
2010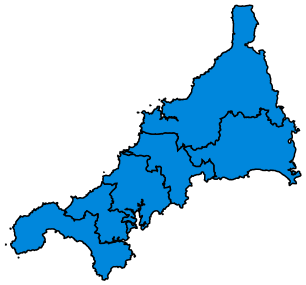 2015
2015- 2017
- 2019
 2024
2024


Historical representation by party
Summarize
Perspective
A cell marked → (with a different colour background to the preceding cell) indicates that the previous MP continued to sit under a new party name.
1832 to 1847 (14 MPs)
1847 to 1868 (14 MPs)
Conservative Independent Liberal Liberal Peelite Radical Whig
| Constituency | 1847 | 49 | 1852 | 53 | 54 | 1857 | 58 | 1859 | 59 | 65 | 1865 | 66 | 68 |
|---|---|---|---|---|---|---|---|---|---|---|---|---|---|
| Bodmin | Wyld | Michell | J. C. Vivian | Leveson-Gower | |||||||||
| Lacy | Graves-Sawle | Wyld | Michell | Wyld | |||||||||
| Cornwall Eastern | T. J. Agar-Robartes | → | |||||||||||
| Pole-Carew | Kendall | ||||||||||||
| Cornwall Western | Wynne-Pendarves | Williams | St Aubyn | → | |||||||||
| Lemon | Davey | → | |||||||||||
| Helston | R. Vyvyan | Trueman | Rogers | Young | W. Brett | ||||||||
| Launceston | Bowles | Percy | Haliburton | Campbell | Lopes | ||||||||
| Liskeard | C. Buller | Crowder | Grey | Osborne | A. Buller | ||||||||
| Penryn & Falmouth | Gwyn | Baring | → | Smith | |||||||||
| Mowatt | Freshfield | Gurney | |||||||||||
| St Ives | Powlett | Laffan | Paull | ||||||||||
| Truro | J. E. Vivian | A. Smith | → | J. C. Vivian | |||||||||
| Turner | H. Willyams | H. Vivian | E. Willyams | M. Smith | F. Williams | ||||||||
1868 to 1885 (13 MPs)
1885 to 1906 (7 MPs)
Conservative Independent Liberal Liberal Liberal Unionist
| Constituency | 1885 | 1886 | 87 | 1892 | 1895 | 98 | 99 | 1900 | 03 | 04 |
|---|---|---|---|---|---|---|---|---|---|---|
| Bodmin | Courtney | → | → | Molesworth | ||||||
| Camborne | Conybeare | → | Strauss | Caine | Lawson | |||||
| Launceston | C. Dyke-Acland | Owen | Moulton | |||||||
| Penryn and Falmouth | Jenkins | Cavendish-Bentinck | Horniman | |||||||
| St Austell | Borlase | McArthur | ||||||||
| St Ives | St Aubyn | → | Bolitho | Hain | → | |||||
| Truro | Bickford-Smith | → | Williams | Durning-Lawrence | ||||||
1906 to 1918 (7 MPs)
Conservative Liberal Liberal Unionist
| Constituency | 1906 | 06 | 08 | Jan 1910 | Dec 1910 | 12 | 15 | 16 |
|---|---|---|---|---|---|---|---|---|
| Bodmin | Agar-Robartes | Freeman-Thomas | Grenfell | Pole-Carew | → | Hanson | ||
| Camborne | Dunn | F. Dyke Acland | ||||||
| Launceston | Marks | |||||||
| Penryn and Falmouth | Barker | Goldman | ||||||
| St Austell | McArthur | Agar-Robartes | Layland-Barratt | |||||
| St Ives | Cory | |||||||
| Truro | Morgan | |||||||
1918 to 1931 (5 MPs)
Coalition Liberal (1918–22) / National Liberal (1922–23) Conservative Constitutionalist Independent Liberal Liberal National Liberal (1931–68)
1931 to 1950 (5 MPs)
Conservative Independent Labour Liberal National Liberal (1931–68)
| Constituency | 1931 | 32 | 1935 | 37 | 39 | 41 | 1945 | 46 | 47 |
|---|---|---|---|---|---|---|---|---|---|
| Bodmin | Foot | Rathbone | B. Rathbone | Marshall | |||||
| Camborne | Agnew | ||||||||
| Cornwall North | Maclean | Dyke Acland | Horabin | → | → | ||||
| Penryn and Falmouth | Petherick | King | |||||||
| St Ives | W. Runciman | Beechman | |||||||
1950 to 1983 (5 MPs)
Conservative Labour Liberal Liberal Democrats National Liberal (1931–68)
1983 to 2010 (5 MPs)
Conservative Labour Liberal Liberal Democrats National Liberal (1931–68)
| Constituency | 1983 | 87 | 1987 | 88 | 1992 | 1997 | 2001 | 2005 |
|---|---|---|---|---|---|---|---|---|
| Cornwall North | Neale | Tyler | Rogerson | |||||
| Cornwall South East | Hicks | Breed | ||||||
| Falmouth and Camborne | Mudd | Coe | Atherton | Goldsworthy | ||||
| St Ives | Harris | George | ||||||
| Truro / Truro & St Austell ('97) | Penhaligon | Taylor | → | |||||
2010 to present (6 MPs)
Conservative Labour Liberal Democrats
| Constituency | 2010 | 2015 | 2017 | 2019 | 2024 |
|---|---|---|---|---|---|
| Camborne and Redruth | Eustice | Moon | |||
| North Cornwall | Rogerson | Mann | Maguire | ||
| South East Cornwall | Murray | Gelderd | |||
| St Austell and Newquay | Gilbert | Double | Law | ||
| St Ives | George | Thomas | George | ||
| Truro and Falmouth | Newton | Mackrory | Kirkham | ||
See also
Notes
- The majority is the number of votes the winning candidate receives more than their nearest rival.
References
Wikiwand - on
Seamless Wikipedia browsing. On steroids.