Hilltop Lakes, Texas
Census-designated place in Texas, United States From Wikipedia, the free encyclopedia
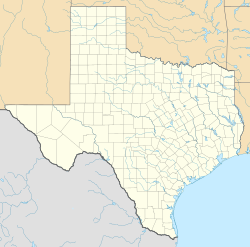
Hilltop Lakes is a census-designated place and unincorporated community in Leon County, Texas, United States. As of the 2010 census, the population was 1,101.[3]
Hilltop Lakes, Texas | |
|---|---|
| Coordinates: 31°04′32″N 96°11′29″W | |
| Country | United States |
| State | Texas |
| County | Leon |
| Area | |
• Total | 8.7 sq mi (22.6 km2) |
| • Land | 8.5 sq mi (22.1 km2) |
| • Water | 0.2 sq mi (0.5 km2) |
| Elevation | 433 ft (132 m) |
| Population | |
• Total | 1,101 |
| • Density | 129/sq mi (49.8/km2) |
| Time zone | UTC-6 (Central (CST)) |
| • Summer (DST) | UTC-5 (CDT) |
| ZIP code | 77871 |
| Area code(s) | 903, 430 |
| FIPS code | 48-34136[1] |
| GNIS feature ID | 2586936[2] |
Geography
Hilltop Lakes is in southwestern Leon County, 27 miles (43 km) southwest of Centerville, the county seat. The community is built around several artificial lakes, including Mirror Lake, Swan Lake, Kickapoo Lake, Cherokee Lake, and Lake Tonkawa. The lakes are built on Running Creek or a tributary, with Running Creek flowing south to the Navasota River.
According to the U.S. Census Bureau, the Hilltop Lakes CDP has a total area of 8.7 square miles (22.6 km2), of which 8.5 square miles (22.1 km2) are land and 0.2 square miles (0.5 km2), or 2.37%, are water.[1]
Demographics
Summarize
Perspective
Hilltop Lakes first appeared as a census designated place in the 2010 U.S. Census.[16]
| Race / Ethnicity (NH = Non-Hispanic) | Pop 2010[18] | Pop 2020[17] | % 2010 | % 2020 |
|---|---|---|---|---|
| White alone (NH) | 1,058 | 1,216 | 96.09% | 87.80% |
| Black or African American alone (NH) | 8 | 21 | 0.73% | 1.52% |
| Native American or Alaska Native alone (NH) | 3 | 9 | 0.27% | 0.65% |
| Asian alone (NH) | 5 | 5 | 0.45% | 0.36% |
| Pacific Islander alone (NH) | 0 | 0 | 0.00% | 0.00% |
| Other race alone (NH) | 0 | 2 | 0.00% | 0.14% |
| Mixed race or Multiracial (NH) | 13 | 56 | 1.18% | 4.04% |
| Hispanic or Latino (any race) | 14 | 76 | 1.27% | 5.49% |
| Total | 1,101 | 1,385 | 100.00% | 100.00% |
References
External links
Wikiwand - on
Seamless Wikipedia browsing. On steroids.

