Ethnic groups in Russia
From Wikipedia, the free encyclopedia
Russia, as the largest country in the world, has great ethnic diversity. It is a multinational state and home to over 190 ethnic groups countrywide. According to the population census at the end of 2021, more than 147.1 million people lived in Russia, which is 4.3 million more than in the 2010 census, or 3.03%. At the same time, only 130.587 million census participants indicated their nationality. The top ten largest nations besides Russians included in descending order: Tatars, Chechens, Bashkirs, Chuvash, Avars, Armenians, Ukrainians, Dargins and Kazakhs. Population censuses in Russia allow citizens to report their nationality according not only to their ancestry, but also to self-identification.[1] The 83 (or 85) federal subjects which together constitute the Russian Federation include:
- 21 national republics (self-governing regions organized along ethnic lines)
- 4 autonomous okrugs (usually with substantial or predominant ethnic minority)
- 1 autonomous oblast
Ethnic groups of Russia, 1926–2021
1926–1979
| Ethnic group[2] |
Year | |||||||||
|---|---|---|---|---|---|---|---|---|---|---|
| 1926 Census | 1939 Census | 1959 Census | 1970 Census | 1979 Census | ||||||
| Number | % | Number | % | Number | % | Number | % | Number | % | |
| Russians | 71,374,283 | 78.1% | 89,747,795 | 82.9% | 97,863,579 | 83.3% | 107,747,630 | 82.8% | 113,521,881 | 82.6% |
| Tatars | 3,926,053 | 3.2% | 3,682,956 | 3.4% | 4,074,253 | 3.5% | 4,577,061 | 3.5% | 5,055,757 | 3.6% |
| Chechens | 318,361 | 0.34% | 400,325 | 0.37% | 261,311 | 0.22% | 572,220 | 0.44% | 712,161 | 0.52% |
| Bashkir | 738,861 | 0.80% | 824,537 | 0.76% | 953,801 | 0.81% | 1,180,913 | 0.91% | 1,290,994 | 0.94% |
| Chuvashs | 1,112,478 | 1.20% | 1,346,232 | 1.24% | 1,436,218 | 1.22% | 1,637,028 | 1.26% | 1,689,847 | 1.23% |
| Avars | 178,263 | 0.19% | 235,715 | 0.22% | 249,529 | 0.21% | 361,613 | 0.28% | 438,306 | 0.32% |
| Armenians | 183,785 | 0.20% | 205,233 | 0.19% | 255,978 | 0.22% | 298,718 | 0.23% | 364,570 | 0.27% |
| Ukrainians | 6,870,976 | 7.9% | 3,205,061 | 3.0% | 3,359,083 | 2.9% | 3,345,885 | 2.6% | 3,657,647 | 2.7% |
| Dargins | 125,759 | 0.14% | 152,007 | 0.14% | 152,563 | 0.13% | 224,172 | 0.17% | 280,444 | 0.20% |
| Kazakhs | 136,501 | 0.15% | 356,500 | 0.33% | 382,431 | 0.33% | 477,820 | 0.37% | 518,060 | 0.38% |
| Kumyks | 94,509 | 0.10% | 110,299 | 0.10% | 132,896 | 0.11% | 186,690 | 0.14% | 225,800 | 0.16% |
| Kabardins | 139,864 | 0.15% | 161,216 | 0.15% | 200,634 | 0.17% | 277,435 | 0.21% | 318,822 | 0.23% |
| Ingush | 72,137 | 0.08% | 90,980 | 0.08% | 55,799 | 0.05% | 137,380 | 0.11% | 165,997 | 0.12% |
| Lezgins | 92,937 | 0.10% | 100,328 | 0.09% | 114,210 | 0.10% | 170,494 | 0.13% | 202,854 | 0.15% |
| Ossetians | 157,280 | 0.17% | 195,624 | 0.18% | 247,834 | 0.21% | 313,458 | 0.24% | 352,080 | 0.26% |
| Mordvins | 1,306,798 | 1.41% | 1,375,558 | 1.27% | 1,211,105 | 1.03% | 1,177,492 | 0.91% | 1,111,075 | 0.81% |
| Yakuts[a] | 240,682 | 0.26% | 241,870 | 0.22% | 236,125 | 0.20% | 295,223 | 0.23% | 326,531 | 0.24% |
| Azerbaijanis | 24,335 | 0.03% | 43,014 | 0.04% | 70,947 | 0.06% | 95,689 | 0.07% | 152,421 | 0.11% |
| Buryats[b] | 237,490 | 0.26% | 220,618 | 0.20% | 251,504 | 0.21% | 312,847 | 0.24% | 349,760 | 0.25% |
| Mari | 427,874 | 0.46% | 476,314 | 0.44% | 498,066 | 0.42% | 581,082 | 0.45% | 599,637 | 0.44% |
| Udmurts[c] | 503,970 | 0.54% | 599,893 | 0.55% | 615,640 | 0.52% | 678,393 | 0.52% | 685,718 | 0.50% |
| Tajiks | 52 | 0.00% | 3,315 | 0.00% | 7,027 | 0.01% | 14,108 | 0.01% | 17,863 | 0.01% |
| Uzbeks | 942 | 0.00% | 16,166 | 0.01% | 29,512 | 0.03% | 61,588 | 0.05% | 72,385 | 0.05% |
| Tuvans | 200 | 0.00% | 794 | 0.00% | 99,864 | 0.08% | 139,013 | 0.11% | 165,426 | 0.12% |
| Crimean Tatars | 0 | 0.00% | 0 | 0.00% | 416 | 0.00% | 2,852 | 0.00% | 5,165 | 0.00% |
| Karachays | 55,116 | 0.06% | 74,488 | 0.07% | 70,537 | 0.06% | 106,831 | 0.08% | 125,792 | 0.09% |
| Belarusians | 607,845 | 0.66% | 451,933 | 0.42% | 843,985 | 0.72% | 964,082 | 0.74% | 1,051,900 | 0.77% |
| Germans | 707,277 | 0.76% | 811,205 | 0.75% | 820,016 | 0.70% | 761,888 | 0.59% | 790,762 | 0.58% |
| Kalmyks | 128,809 | 0.14% | 129,786 | 0.12% | 100,603 | 0.09% | 131,318 | 0.10% | 140,103 | 0.10% |
| Laks | 40,243 | 0.04% | 54,348 | 0.05% | 58,397 | 0.05% | 78,625 | 0.06% | 91,412 | 0.07% |
| Roma | 39,089 | 0.04% | 59,198 | 0.05% | 72,488 | 0.06% | 97,955 | 0.08% | 120,672 | 0.09% |
| Tabasarans | 31,983 | 0.03% | 33,471 | 0.03% | 34,288 | 0.03% | 54,047 | 0.04% | 73,433 | 0.05% |
| Komi[d] | 226,012 | 0.24% | 415,009 | 0.38% | 281,780 | 0.24% | 315,347 | 0.24% | 320,078 | 0.23% |
| Kyrgyz | 285 | 0.00% | 6,311 | 0.01% | 4,701 | 0.00% | 9,107 | 0.01% | 15,011 | 0.01% |
| Balkars | 33,298 | 0.04% | 41,949 | 0.04% | 35,249 | 0.03% | 52,969 | 0.04% | 61,828 | 0.04% |
| Turks[e] | 1,846 | 0.00% | 2,668 | 0.00% | 1,377 | 0.00% | 1,568 | 0.00% | 3,561 | 0.00% |
| Cherkess / Circassians[f] | 28,986 | 0.02% | 38,356 | 0.03% | 44,572 | 0.03% | ||||
| Georgians | 20,551 | 0.02% | 43,585 | 0.04% | 57,594 | 0.05% | 68,971 | 0.05% | 89,407 | 0.07% |
| Adyghe[g] | 64,959 | 0.07% | 85,588 | 0.08% | 78,561 | 0.07% | 98,461 | 0.08% | 107,239 | 0.08% |
| Nogais | 36,089 | 0.04% | 36,088 | 0.03% | 37,656 | 0.03% | 51,159 | 0.04% | 58,639 | 0.04% |
| Koreans | 86,799 | 0.09% | 11,345 | 0.01% | 91,445 | 0.08% | 101,369 | 0.08% | 97,649 | 0.07% |
| Altay | 52,248 | 0.06% | 46,489 | 0.04% | 44,654 | 0.04% | 54,614 | 0.04% | 58,879 | 0.04% |
| Jews | 539,086 | 0.58% | 891,147 | 0.82% | 875,058 | 0.74% | 807,526 | 0.62% | 699,286 | 0.51% |
| Moldovans | 16,870 | 0.02% | 21,974 | 0.02% | 62,298 | 0.05% | 87,538 | 0.07% | 102,137 | 0.07% |
| Khakas | 45,607 | 0.05% | 52,033 | 0.05% | 56,032 | 0.05% | 65,368 | 0.05% | 69,247 | 0.05% |
| Komi-Permyak[h] | 149,275 | 0.16% | 143,030 | 0.12% | 150,244 | 0.12% | 145,993 | 0.11% | ||
| Pontic Greeks [i] | 34,439 | 0.04% | 65,705 | 0.06% | 47,024 | 0.04% | 57,847 | 0.04% | 69,816 | 0.05% |
| Nenets[j] | 17,560 | 0.02% | 24,716 | 0.02% | 22,845 | 0.02% | 28,487 | 0.02% | 29,487 | 0.02% |
| Abazas | 13,825 | 0.01% | 14,739 | 0.01% | 19,059 | 0.02% | 24,892 | 0.02% | 28,800 | 0.02% |
| Turkmens | 7,849 | 0.01% | 12,869 | 0.01% | 11,631 | 0.01% | 20,040 | 0.02% | 22,979 | 0.02% |
| Evenks | 38,804 | 0.03% | 29,599 | 0.02% | 24,583 | 0.02% | 25,051 | 0.02% | 27,278 | 0.02% |
| Aghuls | 7,653 | 0.01% | SDP | SDP | 6,460 | 0.01% | 8,751 | 0.01% | 11,752 | 0.01% |
| Rutuls | 10,333 | 0.01% | SDP | SDP | 6,703 | 0.01% | 11,904 | 0.01% | 14,835 | 0.01% |
| Karelians | 248,017 | 0.27% | 249,778 | 0.23% | 164,050 | 0.14% | 141,148 | 0.11% | 133,182 | 0.10% |
| Khanty | 22,301 | 0.02% | 18,447 | 0.02% | 19,246 | 0.02% | 21,007 | 0.02% | 20,743 | 0.02% |
| Yazidis | 1 | 0.00% | ||||||||
| Kurds[k] | 164 | 0.00% | 387 | 0.00% | 855 | 0.00% | 1,015 | 0.00% | 1,634 | 0.00% |
| Poles | 189,269 | 0.20% | 142,461 | 0.13% | 118,422 | 0.10% | 107,084 | 0.08% | 99,733 | 0.07% |
| Evens | 2,044 | 0.00% | 9,674 | 0.01% | 9,023 | 0.01% | 11,819 | 0.01% | 12,215 | 0.01% |
| Chinese | 8,739 | 0.01% | 22,491 | 0.02% | 19,097 | 0.02% | 7,987 | 0.01% | 5,743 | 0.00% |
| Arabs | 466 | 0.00% | 94 | 0.00% | 649 | 0.00% | 2,555 | 0.00% | 2,339 | 0.00% |
| Chukchi[l] | 12,331 | 0.01% | 13,830 | 0.01% | 11,680 | 0.01% | 13,500 | 0.01% | 13,937 | 0.01% |
| Lithuanians | 26,128 | 0.03% | 20,795 | 0.02% | 108,579 | 0.09% | 76,718 | 0.06% | 66,783 | 0.05% |
| Tsakhurs | 3,533 | 0.00% | SDP | SDP | 4,437 | 0.00% | 4,730 | 0.00% | 4,774 | 0.00% |
| Mansi | 5,754 | 0.01% | 6,295 | 0.01% | 6,318 | 0.01% | 7,609 | 0.01% | 7,434 | 0.01% |
| Bulgarians | 4,087 | 0.00% | 8,338 | 0.01% | 24,899 | 0.02% | 27,321 | 0.02% | 24,943 | 0.02% |
| Nanais | 5,860 | 0.01% | 8,411 | 0.01% | 7,919 | 0.01% | 9,911 | 0.01% | 10,357 | 0.01% |
| Shors | 13,000 | 0.01% | 16,042 | 0.01% | 14,938 | 0.01% | 15,950 | 0.01% | 15,182 | 0.01% |
| Gagauz | 0 | 0.00% | 0 | 0.00% | 3,012 | 0.00% | 3,704 | 0.00% | 4,176 | 0.00% |
| Latvians | 124,312 | 0.13% | 104,877 | 0.10% | 74,932 | 0.06% | 59,695 | 0.05% | 67,267 | 0.05% |
| Abkhaz | 97 | 0.00% | 647 | 0.00% | 1,400 | 0.00% | 2,427 | 0.00% | 4,058 | 0.00% |
| Dolgans[m] | 656 | 0.00% | 4,718 | 0.00% | 4,911 | 0.00% | ||||
| Finns | 134,089 | 0.14% | 138,962 | 0.13% | 72,356 | 0.06% | 62,307 | 0.05% | 55,687 | 0.04% |
| Vietnamese | 0 | 0.00% | 0 | 0.00% | 781 | 0.00% | 6,287 | 0.00% | 661 | 0.00% |
| Estonians | 146,051 | 0.16% | 130,494 | 0.12% | 78,556 | 0.07% | 62,980 | 0.05% | 55,539 | 0.04% |
| Indians | 17 | 0.00% | 0 | 0.00% | 216 | 0.00% | 1,378 | 0.00% | 181 | 0.00% |
| Koryaks | 7,437 | 0.01% | 7,337 | 0.01% | 6,168 | 0.01% | 7,367 | 0.01% | 7,637 | 0.01% |
| Nağaybäk | 11,196 | 0.01% | 0 | 0.00% | 0 | 0.00% | 0 | 0.00% | 0 | 0.00% |
| Veps | 32,783 | 0.04% | 31,442 | 0.03% | 16,170 | 0.01% | 8,057 | 0.01% | 7,550 | 0.01% |
| Assyrians | 2,791 | 0.00% | 7,446 | 0.01% | 7,612 | 0.01% | 8,098 | 0.01% | 8,708 | 0.01% |
| Soyots[n] | 229 | 0.00% | ||||||||
| Meskhetian Turks[o] | ||||||||||
| Nivkh | 4,076 | 0.00% | 3,857 | 0.00% | 3,690 | 0.00% | 4,356 | 0.00% | 4,366 | 0.00% |
| Talysh | 0 | 0.00% | 47 | 0.00% | 33 | 0.00% | 2 | 0.00% | ||
| Afghans | 38 | 0.00% | 190 | 0.00% | 175 | 0.00% | 561 | 0.00% | 184 | 0.00% |
| Selkups | 1,630 | 0.00% | 2,604 | 0.00% | 3,704 | 0.00% | 4,249 | 0.00% | 3,518 | 0.00% |
| Dungans | 6,009 | 0.01% | 48 | 0.00% | 169 | 0.00% | 304 | 0.00% | 1,159 | 0.00% |
| Itelmeni | 803 | 0.00% | SSP | SSP | 1,096 | 0.00% | 1,255 | 0.00% | 1,335 | 0.00% |
| Udis | 2 | 0.00% | SDP | SDP | 35 | 0.00% | 94 | 0.00% | 216 | 0.00% |
| Ulchs | 723 | 0.00% | SSP | SSP | 2,049 | 0.00% | 2,410 | 0.00% | 2,494 | 0.00% |
| Persians | 8,626 | 0.01% | 6,041 | 0.01% | 2,490 | 0.00% | 2,548 | 0.00% | 1,747 | 0.00% |
| Kumandins | 6,335 | 0.01% | 0 | 0.00% | 0 | 0.00% | 0 | 0.00% | 0 | 0.00% |
| Teleuts | 1,898 | 0.00% | 0 | 0.00% | 0 | 0.00% | 0 | 0.00% | 0 | 0.00% |
| Uygurs | 26 | 0.00% | 642 | 0.00% | 720 | 0.00% | 1,513 | 0.00% | 1,707 | 0.00% |
| Serbs | 1,278 | 0.00% | 2,373 | 0.00% | 0 | 0.00% | 1,431 | 0.00% | 815 | 0.00% |
| Hemshins | 2 | 0.00% | 0 | 0.00% | 0 | 0.00% | 0 | 0.00% | 0 | 0.00% |
| Besermyan[p] | 10,035 | 0.01% | ||||||||
| Shapsugs[q] | ||||||||||
| Romanians | 2,881 | 0.00% | 2,682 | 0.00% | 3,316 | 0.00% | 4,093 | 0.00% | 3,837 | 0.00% |
| Yukaghir | 443 | 0.00% | SSP | SSP | 440 | 0.00% | 593 | 0.00% | 801 | 0.00% |
| Inuit /Yupik | 1,292 | 0.00% | SSP | SSP | 1,111 | 0.00% | 1,265 | 0.00% | 1,460 | 0.00% |
| Kamchadals | 4,216 | 0.00% | 0 | 0.00% | 0 | 0.00% | 0 | 0.00% | 0 | 0.00% |
| Sami | 1,715 | 0.00% | 1,828 | 0.00% | 1,760 | 0.00% | 1,836 | 0.00% | 1,775 | 0.00% |
| Hungarians | 3,882 | 0.00% | 0 | 0.00% | 4,175 | 0.00% | 6,681 | 0.01% | 4,313 | 0.00% |
| Italians | 749 | 0.00% | 713 | 0.00% | 525 | 0.00% | 889 | 0.00% | 356 | 0.00% |
| French | 1,338 | 0.00% | 991 | 0.00% | 535 | 0.00% | 1,243 | 0.00% | 305 | 0.00% |
| Udege[r] | 1,357 | 0.00% | 1,701 | 0.00% | 1,395 | 0.00% | 1,396 | 0.00% | 1,431 | 0.00% |
| Mongols | 548 | 0.00% | 0 | 0.00% | 1,511 | 0.00% | 3,759 | 0.00% | 1,812 | 0.00% |
| Czechs | 7,996 | 0.01% | 7,526 | 0.01% | 7,174 | 0.01% | 6,073 | 0.00% | 4,491 | 0.00% |
| Spanish | 0 | 0.00% | 2,290 | 0.00% | 1,615 | 0.00% | 2,631 | 0.00% | 1,961 | 0.00% |
| British | 517 | 0.00% | 416 | 0.00% | 312 | 0.00% | 542 | 0.00% | 115 | 0.00% |
| Americans | 0 | 0.00% | 457 | 0.00% | 273 | 0.00% | 785 | 0.00% | 81 | 0.00% |
| Ket | 1,428 | 0.00% | SSP | SSP | 1,017 | 0.00% | 1,161 | 0.00% | 1,072 | 0.00% |
| Krymchaks | 6,185 | 0.01% | 0 | 0.00% | 249 | 0.00% | 389 | 0.00% | 1,365 | 0.00% |
| Chuvans[s] | 704 | 0.00% | 1,384 | 0.00% | ||||||
| Karakalpaks | 14 | 0.00% | 306 | 0.00% | 988 | 0.00% | 2,267 | 0.00% | 1,743 | 0.00% |
| Izhorians | 16,136 | 0.02% | 7,720 | 0.01% | 564 | 0.00% | 561 | 0.00% | 449 | 0.00% |
| Tofalar | 2,828 | 0.00% | SSP | SSP | 476 | 0.00% | 570 | 0.00% | 576 | 0.00% |
| Cubans | 0 | 0.00% | 0 | 0.00% | 0 | 0.00% | 0 | 0.00% | 1,175 | 0.00% |
| Nganasans[t] | 721 | 0.00% | 823 | 0.00% | 842 | 0.00% | ||||
| Japanese | 79 | 0.00% | 922 | 0.00% | 888 | 0.00% | 1,141 | 0.00% | 655 | 0.00% |
| Ruthenians | 0 | 0.00% | 0 | 0.00% | 0 | 0.00% | 0 | 0.00% | 0 | 0.00% |
| Tats | 223 | 0.00% | 5,136 | 0.00% | 8,753 | 0.01% | 12,748 | 0.01% | ||
| Orochs[u] | 646 | 0.00% | SSP | SSP | 779 | 0.00% | 1,037 | 0.00% | 1,040 | 0.00% |
| Karaites | 1,608 | 0.00% | 1,608 | 0.00% | 1,236 | 0.00% | 939 | 0.00% | ||
| Negidals | 683 | 0.00% | SSP | SSP | 495 | 0.00% | 477 | 0.00% | ||
| Pamiris | 0 | 0.00% | 0 | 0.00% | 0 | 0.00% | 0 | 0.00% | 0 | 0.00% |
| Pakistani | 0 | 0.00% | 0 | 0.00% | 0 | 0.00% | 0 | 0.00% | 0 | 0.00% |
| Aleut | 353 | 0.00% | SSP | SSP | 399 | 0.00% | 410 | 0.00% | 489 | 0.00% |
| Chulyms | 0 | 0.00% | 0 | 0.00% | 0 | 0.00% | 0 | 0.00% | 0 | 0.00% |
| Oroks[v] | 162 | 0.00% | SSP | SSP | 2 | 0.00% | ||||
| Mountain Jews | 15,612 | 0.02% | 0 | 0.00% | 19,352 | 0.02% | 15,434 | 0.01% | 6,509 | 0.00% |
| Taz[w] | ||||||||||
| Enets[x] | ||||||||||
| Slovaks | 0 | 0.00% | 513 | 0.00% | 497 | 0.00% | 758 | 0.00% | 439 | 0.00% |
| Croats | 0 | 0.00% | 0 | 0.00% | 0 | 0.00% | 174 | 0.00% | 115 | 0.00% |
| Macedonians | 0 | 0.00% | 0 | 0.00% | 0 | 0.00% | 0 | 0.00% | 0 | 0.00% |
| Slovenes | 0 | 0.00% | 0 | 0.00% | 0 | 0.00% | 0 | 0.00% | 0 | 0.00% |
| Votes | 705 | 0.00% | 0 | 0.00% | 0 | 0.00% | 0 | 0.00% | 0 | 0.00% |
| Bosnians | 0 | 0.00% | 0 | 0.00% | 0 | 0.00% | 0 | 0.00% | 0 | 0.00% |
| Montenegrins | 0 | 0.00% | 0 | 0.00% | 0 | 0.00% | 0 | 0.00% | 0 | 0.00% |
| Kereks[y] | ||||||||||
| Central Asian Jews | 93 | 0.00% | 0 | 0.00% | 99 | 0.00% | 91 | 0.00% | 336 | 0.00% |
| Georgian Jews | 82 | 0.00% | 0 | 0.00% | 109 | 0.00% | 109 | 0.00% | 130 | 0.00% |
| Central Asian Roma | 0 | 0.00% | 0 | 0.00% | 0 | 0.00% | 0 | 0.00% | 0 | 0.00% |
| Small Dagestan Peoples (SDP) | 20,962 | 0.02% | ||||||||
| Small Siberian Peoples (SSP) | 11,824 | 0.01% | ||||||||
| Other Ethnicity | ||||||||||
| Ethnicity not stated or stated No ethnicity | ||||||||||
1989–2021
| Ethnic group[3] |
Year | ||||||||
|---|---|---|---|---|---|---|---|---|---|
| 1989 Census | 2002 Census | 2010 Census | 2021 Census[4] | ||||||
| Number | % | Number | % | Number | % | Number | % | % (of those declared) | |
| Russians | 119,865,469 | 81.5% | 115,889,107 | 79.83% | 111,016,896 | 77.71% | 105,579,179 | 71.76% | 80.85% |
| Tatars | 5,522,096 | 3.8% | 5,554,601 | 3.83% | 5,310,649 | 3.72% | 4,713,669 | 3.2% | 3.62% |
| Chechens | 898,999 | 0.61% | 1,360,253 | 0.95% | 1,431,360 | 1.00% | 1,674,854 | 1.14% | 1.29% |
| Bashkir | 1,345,273 | 0.92% | 1,673,389 | 1.16% | 1,584,554 | 1.11% | 1,571,879 | 1.07% | 1.21% |
| Chuvashs | 1,773,645 | 1.21% | 1,637,094 | 1.14% | 1,435,872 | 1.01% | 1,067,139 | 0.73% | 0.83% |
| Avars | 544,016 | 0.37% | 814,473 | 0.57% | 912,090 | 0.64% | 1,012,074 | 0.69% | 0.78% |
| Armenians | 532,390 | 0.36% | 1,132,033 | 0.79% | 1,182,388 | 0.83% | 946,172 | 0.64% | 0.72% |
| Ukrainians | 4,362,872 | 3.0% | 2,942,961 | 2.03% | 1,927,888 | 1.35% | 884,007 | 0.6% | 0.68% |
| Dargins | 353,348 | 0.24% | 510,156 | 0.35% | 589,386 | 0.41% | 626,601 | 0.43% | 0.49% |
| Kazakhs | 635,865 | 0.43% | 653,962 | 0.46% | 647,732 | 0.45% | 591,970 | 0.4% | 0.45% |
| Kumyks | 277,163 | 0.19% | 422,409 | 0.29% | 503,060 | 0.35% | 565,830 | 0.38% | 0.43% |
| Kabardins | 386,055 | 0.26% | 519,958 | 0.36% | 516,826 | 0.36% | 523,404 | 0.36% | 0.41% |
| Ingush | 215,068 | 0.15% | 413,016 | 0.29% | 444,833 | 0.31% | 517,186 | 0.35% | 0.40% |
| Lezgins | 257,270 | 0.17% | 411,535 | 0.28% | 473,722 | 0.33% | 488,608 | 0.33% | 0.37% |
| Ossetians | 402,275 | 0.27% | 514,875 | 0.36% | 528,515 | 0.37% | 485,646 | 0.33% | 0.37% |
| Mordvins | 1,072,939 | 0.73% | 843,350 | 0.59% | 744,237 | 0.52% | 484,450 | 0.33% | 0.37% |
| Yakuts | 380,242 | 0.26% | 443,852 | 0.31% | 478,085 | 0.34% | 478,409 | 0.33% | 0.37% |
| Azerbaijanis | 335,889 | 0.23% | 621,840 | 0.43% | 603,070 | 0.42% | 474,576 | 0.32% | 0.36% |
| Buryats[b] | 417,425 | 0.28% | 445,175 | 0.31% | 461,389 | 0.32% | 460,053 | 0.31% | 0.35% |
| Mari | 643,698 | 0.44% | 604,298 | 0.42% | 547,605 | 0.38% | 423,803 | 0.29% | 0.33% |
| Udmurts[c] | 714,883 | 0.49% | 636,906 | 0.44% | 552,299 | 0.39% | 386,465 | 0.26% | 0.29% |
| Tajiks | 38,208 | 0.03% | 120,136 | 0.08% | 200,666 | 0.14% | 350,236 | 0.24% | 0.27% |
| Uzbeks | 126,899 | 0.09% | 122,916 | 0.09% | 289,862 | 0.20% | 323,278 | 0.22% | 0.25% |
| Tuvans | 206,160 | 0.14% | 243,442 | 0.17% | 263,934 | 0.19% | 295,384 | 0.2% | 0.23% |
| Crimean Tatars | 21,275 | 0.01% | 4,131 | 2,449 | 257,592 | 0.18% | 0.20% | ||
| Karachays | 150,332 | 0.10% | 192,182 | 0.13% | 218,403 | 0.15% | 226,271 | 0.15% | 0.17% |
| Belarusians | 1,206,222 | 0.82% | 807,970 | 0.56% | 521,443 | 0.37% | 208,046 | 0.14% | 0.16% |
| Germans | 842,295 | 0.57% | 597,212 | 0.41% | 394,138 | 0.28% | 195,256 | 0.13% | 0.15% |
| Kalmyks | 165,103 | 0.11% | 174,000 | 0.12% | 183,372 | 0.13% | 179,547 | 0.12% | 0.14% |
| Laks | 106,245 | 0.07% | 156,545 | 0.11% | 178,630 | 0.13% | 173,416 | 0.12% | 0.14% |
| Roma | 152,939 | 0.10% | 183,252 | 0.13% | 204,958 | 0.14% | 173,400 | 0.12% | 0.14% |
| Tabasarans | 93,587 | 0.06% | 131,785 | 0.09% | 146,360 | 0.10% | 151,466 | 0.1% | 0.11% |
| Komi | 336,309 | 0.23% | 293,406 | 0.20% | 228,235 | 0.16% | 148,516 | 0.1% | 0.11% |
| Kyrgyz | 41,734 | 0.03% | 31,808 | 0.02% | 103,422 | 0.07% | 137,780 | 0.09% | 0.10% |
| Balkars | 78,341 | 0.05% | 108,426 | 0.08% | 112,924 | 0.08% | 125,044 | 0.08% | 0.09% |
| Turks[e] | 9,890 | 0.01% | 92,415 | 0.06% | 105,058 | 0.07% | 116,705 | 0.08% | 0.09% |
| Cherkess / Circassians | 50,572 | 0.03% | 60,517 | 73,184 | 114,697 | 0.08% | 0.09% | ||
| Georgians | 130,688 | 0.09% | 197,934 | 0.14% | 157,803 | 0.11% | 112,765 | 0.08% | 0.09% |
| Adyghe[f] | 122,908 | 0.08% | 128,528 | 0.09% | 124,835 | 0.09% | 111,471 | 0.08% | 0.09% |
| Nogais | 73,703 | 0.05% | 90,666 | 0.06% | 103,660 | 0.07% | 109,042 | 0.07% | 0.08% |
| Koreans | 107,051 | 0.07% | 148,556 | 0.10% | 153,156 | 0.11% | 87,819 | 0.06% | 0.07% |
| Altay | 69,409 | 0.05% | 77,822 | 0.05% | 89,773 | 0.05% | 83,125 | 0.06% | 0.07% |
| Jews | 550,709 | 0.37% | 233,439 | 0.16% | 156,801 | 0.11% | 82,644 | 0.06% | 0.07% |
| Moldovans | 172,671 | 0.12% | 172,330 | 0.12% | 156,400 | 0.11% | 77,509 | 0.05% | 0.06% |
| Khakas | 78,500 | 0.05% | 76,278 | 72,959 | 61,365 | 0.04% | 0.05% | ||
| Komi-Permyak | 147,269 | 0.10% | 125,235 | 0.09% | 94,456 | 0.07% | 55,786 | 0.04% | 0.05% |
| Pontic Greeks[i] | 91,699 | 0.06% | 97,827 | 0.07% | 85,640 | 0.06% | 53,972 | 0.04% | 0.05% |
| Nenets | 34,190 | 0.02% | 41,302 | 44,640 | 49,646 | 0.03% | 0.03% | ||
| Abazas | 32,983 | 0.02% | 37,942 | 43,341 | 41,793 | 0.03% | 0.03% | ||
| Turkmens | 39,739 | 0.03% | 33,053 | 36,885 | 41,328 | 0.03% | 0.03% | ||
| Evenks | 29,901 | 0.02% | 35,527 | 37,843 | 39,226 | 0.03% | 0.03% | ||
| Aghuls | 17,728 | 0.01% | 28,297 | 34,160 | 34,576 | 0.02% | 0.02% | ||
| Rutuls | 19,503 | 0.01% | 29,929 | 35,240 | 34,259 | 0.02% | 0.02% | ||
| Karelians | 124,921 | 0.08% | 93,344 | 60,815 | 32,422 | 0.02% | 0.02% | ||
| Khanty | 22,283 | 0.02% | 28,678 | 30,943 | 31,467 | 0.02% | 0.02% | ||
| Yazidis | 31,273 | 40,586 | 26,257 | 0.02% | 0.02% | ||||
| Kurds[k] | 4,724 | 0.00% | 19,607 | 23,232 | 24,657 | 0.01% | 0.01% | ||
| Poles | 94,594 | 0.06% | 73,001 | 47,125 | 22,024 | 0.01% | 0.01% | ||
| Evens | 17,055 | 0.01% | 19,071 | 22,383 | 19,913 | 0.01% | 0.01% | ||
| Chinese | 5,197 | 0.00% | 34,577 | 28,943 | 19,644 | 0.01% | 0.01% | ||
| Arabs | 2,704 | 0.00% | 10,811 | 9,583 | 16,329 | 0.01% | 0.01% | ||
| Chukchi[l] | 15,107 | 0.01% | 15,767 | 15,908 | 16,200 | 0.01% | 0.01% | ||
| Lithuanians | 70,427 | 0.05% | 45,569 | 31,377 | 13,230 | 0.01% | 0.01% | ||
| Tsakhurs | 6,492 | 0.00% | 10,366 | 12,769 | 12,541 | 0.01% | 0.01% | ||
| Mansi | 8,279 | 0.01% | 11,432 | 12,269 | 12,228 | 0.01% | 0.01% | ||
| Bulgarians | 32,785 | 0.02% | 31,965 | 24,038 | 11,851 | 0.01% | 0.01% | ||
| Nanais | 11,883 | 0.01% | 12,160 | 12,003 | 11,623 | 0.01% | 0.01% | ||
| Shors | 15,745 | 0.01% | 13,975 | 12,888 | 10,507 | 0.01% | 0.01% | ||
| Gagauz | 10,051 | 0.01% | 12,210 | 13,690 | 9,272 | 0.01% | 0.01% | ||
| Latvians | 46,829 | 0.03% | 28,520 | 18,979 | 8,516 | 0.01% | 0.01% | ||
| Abkhaz | 7,239 | 0.00% | 11,366 | 11,249 | 8,177 | 0.01% | 0.01% | ||
| Dolgans | 6,584 | 0.00% | 7,261 | 7,885 | 8,157 | 0.01% | 0.01% | ||
| Finns | 47,102 | 0.03% | 34,050 | 20,267 | 7,978 | 0.01% | 0.01% | ||
| Vietnamese | 2,142 | 0.00% | 26,206 | 13,954 | 7,859 | 0.01% | 0.01% | ||
| Estonians | 46,390 | 0.03% | 28,113 | 17,875 | 7,778 | 0.01% | 0.01% | ||
| Indians | 535 | 0.00% | 4,980 | 4,058 | 7,667 | 0.01% | 0.01% | ||
| Koryaks | 8,942 | 0.01% | 8,743 | 7,953 | 7,485 | 0.01% | 0.01% | ||
| Nağaybäk | 0 | 0.00% | 9,600 | 8,148 | 5,719 | 0.00% | 0.00% | ||
| Veps | 12,142 | 0.01% | 8,240 | 5,936 | 4,534 | 0.00% | 0.00% | ||
| Assyrians | 9,622 | 0.01% | 13,649 | 11,084 | 4,421 | 0.00% | 0.00% | ||
| Soyots[n] | 2,769 | 3,608 | 4,368 | 0.00% | 0.00% | ||||
| Meskhetian Turks[o] | 3,527 | 4,825 | 4,095 | 0.00% | 0.00% | ||||
| Nivkh | 4,631 | 0.00% | 5,162 | 4,652 | 3,842 | 0.00% | 0.00% | ||
| Talysh | 202 | 0.00% | 2,548 | 2,529 | 3,595 | 0.00% | 0.00% | ||
| Afghans | 858 | 0.00% | 9,800 | 5,350 | 3,536 | 0.00% | 0.00% | ||
| Selkups | 3,564 | 0.00% | 4,249 | 3,649 | 3,458 | 0.00% | 0.00% | ||
| Dungans | 635 | 0.00% | 801 | 1,651 | 3,028 | 0.00% | 0.00% | ||
| Itelmeni | 2,429 | 0.00% | 3,180 | 3,193 | 2,596 | 0.00% | 0.00% | ||
| Udis | 1,102 | 0.00% | 3,721 | 4,267 | 2,551 | 0.00% | 0.00% | ||
| Ulchs | 3,173 | 0.00% | 2,913 | 2,765 | 2,472 | 0.00% | 0.00% | ||
| Persians | 2,572 | 0.00% | 3,821 | 3,696 | 2,434 | 0.00% | 0.00% | ||
| Kumandins | 0 | 0.00% | 3,114 | 2,892 | 2,408 | 0.00% | 0.00% | ||
| Teleuts | 0 | 0.00% | 2,650 | 2,643 | 2,217 | 0.00% | 0.00% | ||
| Uygurs | 2,577 | 0.00% | 2,867 | 3,696 | 2,217 | 0.00% | 0.00% | ||
| Serbs | 1,580 | 0.00% | 4,156 | 3,510 | 2,151 | 0.00% | 0.00% | ||
| Hemshins | 0 | 0.00% | 1,542 | 2,047 | 2,082 | 0.00% | 0.00% | ||
| Besermyan[p] | 3,122 | 2,201 | 2,036 | 0.00% | 0.00% | ||||
| Shapsugs[g] | 3,231 | 3,882 | 1,914 | 0.00% | 0.00% | ||||
| Romanians | 5,996 | 0.00% | 5,308 | 3,201 | 1,850 | 0.00% | 0.00% | ||
| Yukaghir | 1,112 | 0.00% | 1,509 | 1,603 | 1,802 | 0.00% | 0.00% | ||
| Inuit /Yupik | 1,704 | 0.00% | 1,750 | 1,738 | 1,657 | 0.00% | 0.00% | ||
| Kamchadals | 0 | 0.00% | 2,293 | 1,927 | 1,547 | 0.00% | 0.00% | ||
| Sami | 1,835 | 0.00% | 1,991 | 1,771 | 1,530 | 0.00% | 0.00% | ||
| Hungarians | 5,742 | 0.00% | 3,768 | 2,781 | 1,460 | 0.00% | 0.00% | ||
| Italians | 627 | 0.00% | 862 | 1,370 | 1,460 | 0.00% | 0.00% | ||
| French | 352 | 0.00% | 819 | 1,475 | 1,457 | 0.00% | 0.00% | ||
| Udege[r] | 1,902 | 0.00% | 1,657 | 1,496 | 1,325 | 0.00% | 0.00% | ||
| Mongols | 2,117 | 0.00% | 2,656 | 2,986 | 1,318 | 0.00% | 0.00% | ||
| Czechs | 4,375 | 0.00% | 2,904 | 1,898 | 1,214 | 0.00% | 0.00% | ||
| Spanish | 2,054 | 0.00% | 1,547 | 1,162 | 1,175 | 0.00% | 0.00% | ||
| British | 223 | 0.00% | 529 | 950 | 1,167 | 0.00% | 0.00% | ||
| Americans | 185 | 0.00% | 1,275 | 1,572 | 1,129 | 0.00% | 0.00% | ||
| Ket | 1,084 | 0.00% | 1,494 | 1,219 | 1,088 | 0.00% | 0.00% | ||
| Krymchaks | 338 | 0.00% | 157 | 90 | 954 | 0.00% | 0.00% | ||
| Chuvans | 1,087 | 1,002 | 900 | 0.00% | 0.00% | ||||
| Karakalpaks | 6,155 | 0.00% | 1,609 | 1,466 | 838 | 0.00% | 0.00% | ||
| Izhorians | 449 | 0.00% | 327 | 266 | 781 | 0.00% | 0.00% | ||
| Tofalar | 722 | 0.00% | 837 | 762 | 719 | 0.00% | 0.00% | ||
| Cubans | 1,566 | 0.00% | 707 | 676 | 701 | 0.00% | 0.00% | ||
| Nganasans[j] | 1,262 | 0.00% | 834 | 862 | 687 | 0.00% | 0.00% | ||
| Japanese | 591 | 0.00% | 835 | 888 | 663 | 0.00% | 0.00% | ||
| Rusyns | 0 | 0.00% | 97 | 225 | 596 | 0.00% | 0.00% | ||
| Tats | 19,420 | 0.01% | 2,303 | 1,585 | 575 | 0.00% | 0.00% | ||
| Orochs | 883 | 0.00% | 686 | 596 | 527 | 0.00% | 0.00% | ||
| Karaites | 680 | 0.00% | 366 | 205 | 500 | 0.00% | 0.00% | ||
| Negidals | 587 | 0.00% | 567 | 513 | 481 | 0.00% | 0.00% | ||
| Pamiris | 0 | 0.00% | 0 | 363 | 467 | 0.00% | 0.00% | ||
| Pakistani | 0 | 0.00% | 0 | 507 | 410 | 0.00% | 0.00% | ||
| Aleut | 644 | 0.00% | 540 | 482 | 397 | 0.00% | 0.00% | ||
| Chulyms | 0 | 0.00% | 656 | 355 | 382 | 0.00% | 0.00% | ||
| Oroks | 179 | 0.00% | 346 | 295 | 268 | 0.00% | 0.00% | ||
| Mountain Jews | 11,282 | 0.01% | 3,394 | 762 | 266 | 0.00% | 0.00% | ||
| Taz[w] | 276 | 274 | 235 | 0.00% | 0.00% | ||||
| Enets | 198 | 0.00% | 237 | 227 | 201 | 0.00% | 0.00% | ||
| Slovaks | 711 | 0.00% | 568 | 324 | 193 | 0.00% | 0.00% | ||
| Swedes | 295 | ||||||||
| Croats | 479 | 0.00% | 0 | 304 | 177 | 0.00% | 0.00% | ||
| Macedonians | 0 | 0.00% | 0 | 325 | 155 | 0.00% | 0.00% | ||
| Slovenes | 0 | 0.00% | 0 | 1,008 | 108 | 0.00% | 0.00% | ||
| Votes | 0 | 0.00% | 73 | 64 | 99 | 0.00% | 0.00% | ||
| Bosnians | 0 | 0.00% | 0 | 256 | 98 | 0.00% | 0.00% | ||
| Montenegrins | 0 | 0.00% | 0 | 181 | 85 | 0.00% | 0.00% | ||
| Kereks[y] | 8 | 4 | 23 | 0.00% | 0.00% | ||||
| Central Asian Jews | 1,407 | 0.00% | 54 | 32 | 18 | 0.00% | 0.00% | ||
| Georgian Jews | 1,172 | 0.00% | 53 | 78 | 14 | 0.00% | 0.00% | ||
| Central Asian Roma | 0 | 0.00% | 486 | 49 | 12 | 0.00% | 0.00% | ||
| Small Dagestan Peoples (SDP) | |||||||||
| Small Siberian Peoples (SSP) | |||||||||
| Other Ethnicity | 1,393,685 | 0.95% | 1.08% | ||||||
| Ethnicity not stated or no ethnicity | 17,136,960 | 11.64% | - | ||||||
Population pyramids
- Population pyramids of ethnicities within Russia in the 2021 census
 Russians
 Bashkirs
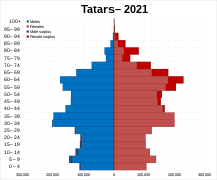 Tatars
 Chechens
 Ukrainians
 Kazakhs
 Kabardians
 Chuvash
 Avars
Avars Armenians
 Crimean Tatars
 Germans
 Belarusians
 Tajiks
 Uzbeks
 Tuvans
 Kumyks
 Dargins
 Buryats
 Azeribaijanis
 Ingush
 stated No ethnicity
 Lezgins


Ethno-racial groups
This section possibly contains original research. (January 2025) |
Based on the Last Census, 2021, the total population was 147,182,123, but only 130,045,163 indicated a nationality. It is estimated that the percentage of those who didn't indicate a nationality is very similar to the percentage of those who did.
| Ethno-Racial group | Population | Percentage |
|---|---|---|
| Europeans
(Russians, Ukrainians, Mordvins, Belarusians, Germans, and others.) |
107,750,000 | 82.86% |
| Caucasians
(Chechens, Dagestanis, Armenians, Circassians, Ingush, Ossetians, and others. A separate group because they cluster separately from Europeans.) |
8,704,000 | 6.69% |
| Eurasians
(Tatars, Bashkir, Chuvash, Mari, Udmurt, and others. Predominantly Europeans with 10% asiatic admixture.) |
8,679,000 | 6.67% |
| Asiatics and Central Asians | 3,386,000 | 2.6% |
| Romani | 173,412 | 0.13% |
| Turkish | 120,812 | 0.09% |
| Jews | 84,481 | 0.06% |
| Arab, North African, and Middle Eastern | 74,160 | 0.06% |
| Mixed Race/Mestizo/Mulattos | 18,413 | 0.01% |
| Black African | 4,661 | 0.003% |
| Other Answers | 153,576 | 0.12% |
| Rossiyane | 1,151,631 | 0.89% |
| TOTAL | 130,045,163 | 100% |
Future projections
The ethnic demographic mix of the Russian Federation is projected to change far into the future. The majority population, ethnic Russians, who have been in slight decline since the 1950s will decline further due to a below replacement fertility rate and population ageing.[5] In 2010, rough population projections from Ivan Beloborodov projecting to 2030 estimated that the percentage of Russians within the population would decrease to around 70 to 60% of the total population.[6]
Language and culture
Summarize
Perspective
This section needs additional citations for verification. (May 2022) |
Although the constitution of Russia recognizes Russian as the official language, the individual republics may declare one or more official languages. Many of these subjects have at least two—Russian and the language of the "eponymous" nationality.[7] There is a minority language scene in most subjects of the country, with more than 1,350 newspapers and magazines, 300 TV channels and 250 radio stations in over 50 of these minority languages. Moreover, new legislation allows usage of minority languages in federal radio and TV broadcasting. [citation needed]
In 2007, there were 6,260 schools which provided teaching in 38 minority languages. Over 75 minority languages were taught as a discipline in 10,404 schools.[citation needed] The Ministers of Council of Europe has noted significant efforts to improve the supply of minority language textbooks and teachers, as well as a greater availability of minority language teaching. However, as Ministers has noted, there remain shortcomings in the access to education of a person(s) belonging to certain minorities. [citation needed]
There are more than 2,000 national minorities' public associations and 560 national cultural autonomies, however the Committee of Ministers has noted that in many regions, amount of state support for the preservation and development of minority cultures is still inadequate.[citation needed] There's a significant difference between "eponymous" ethnic groups and nationalities without their own national territory, as resources of the last are relatively limited.
| Language family | Population | Percentage |
|---|---|---|
| Slavic
(Russians, Ukrainians, Belarusians, Poles, Bulgarians, Serbs, Czechs, Rusyns, Slovaks, Croats, Macedonians, Slovenes, Bosnians, Montenegrins) |
106,709,884 | 81.72% |
| Turkic
(Tatars, Bashkirs, Chuvash, Kazakhs, Kumyks, Yakuts, Azerbaijanis, Uzbeks, Tuvans, Crimean Tatars, Karachays, Kyrgyz, Balkars, Turks, Nogais, Altai, Khakas, Turkmens, Shors, Gagauz, Dolgans, Nagaibak, Soyots, Meskhetian Turks, Kumandins, Uyghurs, Teleuts, Krymchaks, Karakalpaks, Tofalar, Crimean Karaites, Chulyms) |
11,287,749 | 8.64% |
| Caucasian
(Chechens, Avars, Dargins, Kabardians, Ingush, Lezgins, Laks, Tabasarans, Cherkess, Georgians, Adyghe, Abazins, Aghuls, Rutuls, Tsakhurs, Abkhazians, Udis, Shapsugs) |
5,642,353 | 4.32% |
| Uralic
(Mordvins, Mari, Udmurts, Komi, Komi-Permyaks, Nenets, Karelians, Khanty, Mansi, Estonians, Finns, Vepsians, Selkups, Besermyan, Sami, Hungarians, Nganasan, Izhorians, Enets, Votians) |
1,649,635 | 1.26% |
| Armenian
(Armenians, Hemshins) |
948,254 | 0.73% |
| Iranian
(Ossetians, Tajiks, Yazidis, Kurds, Talysh, Afghans, Persians, Tat, Pamiris) |
897,403 | 0.69% |
| Mongolic
(Buryats, Kalmyks, Mongols) |
640,918 | 0.49% |
| Other | 2,811,168 | 2.15% |
Indigenous peoples
This section needs additional citations for verification. (May 2022) |
Russia is also home to a particular category of minority peoples, i.e. small indigenous peoples of the North and Far East, who maintain very traditional lifestyles, often in a hazardous climatic environment, while adapting to the modern world. After the fall of the Soviet Union, Russia passed legislation to protect rights of these small northern indigenous peoples. [citation needed]
Gil-Robles has noted agreements between indigenous representatives and oil companies, which are to compensate potential damages on peoples habitats due to oil exploration. As Committee of Ministers of Council of Europe noted in 2007,[8] despite some initiatives for development, the social and economic situation of numerically small indigenous peoples was affected by recent legislative amendments at the federal level, removing some positive measures as regards their access to land and other natural resources.[9]
Maps
 1989 ethnic map of Russia showing the largest ethnic group of each region or Republic; with brown as Russians, green as Turkic peoples
 Ethnic map of Russia, 2010
 Largest ethnic group apart from Russians: yellow – Ukrainians, lawn green – Tatars, green – Kazakhs, orange – Armenians, blue – Buryats, gray-blue – Germans, pink – Koreans
 The largest two ethnic groups, excluding Russians, in each region (Census 2010)
 Distribution of Russians, 2010
 Distribution of Tatars, 2010
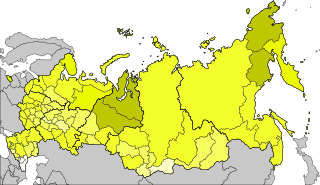 Distribution of Ukrainians, 2010
 Distribution of Bashkirs, 2010
 Distribution of Chuvashs, 2010
 Distribution of Chechens, 2010
 Distribution of Armenians, 2010
 Distribution of Mordvins, 2010
 Distribution of Kazakhs, 2010
 Distribution of Azerbaijanis, 2010
 Distribution of Belarusians, 2010
 Distribution of Germans, 2010


See also
Indigenous peoples:
References
External links
Wikiwand - on
Seamless Wikipedia browsing. On steroids.