Devon County Council elections
Local government elections in Devon, England From Wikipedia, the free encyclopedia
Devon County Council elections are held every four years in order to elect the members of Devon County Council. Since the last boundary changes in 2017 the council has comprised 60 councillors, representing 58 electoral divisions.[1] Since 1998, Plymouth and Torbay have been unitary authorities, making them independent of Devon County Council.[2]
Council elections
| Year | Conservative | Liberal Democrats[a] | Labour | Green[b] | Liberal | UKIP | NDM | SDP[c] | Independent | Council control after election | |
|---|---|---|---|---|---|---|---|---|---|---|---|
| 1973[3] | 54 | 11 | 20 | – | – | – | 1 | – | 12 | Conservative | |
| 1977[3] | 85 | 2 | 3 | 1 | 7 | Conservative | |||||
| 1981[3] | 65 | 10 | 16 | 0 | 1 | 6 | Conservative | ||||
| 1985[d][3] | 37 | 36 | 10 | 0 | 0 | 2 | No overall control | ||||
| 1989[3] | 55 | 12 | 13 | 0 | – | 2 | 3 | Conservative | |||
| 1993[5] | 19 | 39 | 21 | 0 | 1 | 0 | 5 | No overall control | |||
| 1997[e][7] | 13 | 31 | 4 | 0 | 2 | – | 4 | Liberal Democrats | |||
| 2001[8][9] | 22 | 21 | 5 | 0 | 2 | 0 | 4 | No overall control | |||
| 2005[f][11][12] | 23 | 33 | 4 | 0 | 0 | 0 | 2 | Liberal Democrats | |||
| 2009[13][14] | 41 | 14 | 4 | 1 | 0 | 0 | 2 | Conservative | |||
| 2013[15] | 38 | 9 | 7 | 1 | 0 | 4 | 3 | Conservative | |||
| 2017[g][16] | 42 | 7 | 7 | 1 | 0 | 0 | 3 | Conservative | |||
| 2021[17] | 39 | 9 | 7 | 2 | – | 0 | 3 | Conservative | |||
| 2025 | Upcoming election | ||||||||||
County result maps
 2009 results map
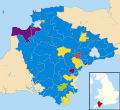 2013 results map
 2017 results map
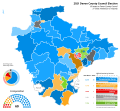 2021 results map


By-election results
1993-1997
| Party | Candidate | Votes | % | ±% | |
|---|---|---|---|---|---|
| Conservative | 796 | 37.9 | |||
| Labour | 659 | 32.5 | |||
| Liberal Democrats | 599 | 29.5 | |||
| Majority | 110 | 5.4 | |||
| Turnout | 2,054 | 24.3 | |||
| Conservative hold | Swing | ||||
1997-2001
| Party | Candidate | Votes | % | ±% | |
|---|---|---|---|---|---|
| Labour | 1,339 | 61.7 | −16.5 | ||
| Conservative | 414 | 19.1 | −2.8 | ||
| Liberal Democrats | 345 | 15.9 | +15.9 | ||
| 72 | 3.3 | +3.3 | |||
| Majority | 925 | 42.6 | |||
| Turnout | 2,170 | 23.0 | |||
| Labour hold | Swing | ||||
| Party | Candidate | Votes | % | ±% | |
|---|---|---|---|---|---|
| Labour | 1,036 | 59.4 | +10.3 | ||
| Conservative | 336 | 19.3 | −7.0 | ||
| Liberal Democrats | 282 | 16.2 | −2.7 | ||
| Liberal | 90 | 5.2 | −0.5 | ||
| Majority | 700 | 40.1 | |||
| Turnout | 1,744 | ||||
| Labour hold | Swing | ||||
| Party | Candidate | Votes | % | ±% | |
|---|---|---|---|---|---|
| Conservative | 1,163 | 45.5 | +27.5 | ||
| Liberal Democrats | 700 | 27.4 | −3.9 | ||
| Labour | 695 | 27.3 | +15.9 | ||
| Majority | 463 | 18.1 | |||
| Turnout | 2,558 | 32.0 | |||
| Conservative gain from Independent | Swing | ||||
| Party | Candidate | Votes | % | ±% | |
|---|---|---|---|---|---|
| Conservative | 1,811 | 51.0 | +7.7 | ||
| Liberal Democrats | 1,505 | 42.4 | +4.6 | ||
| Labour | 150 | 4.2 | −5.4 | ||
| Liberal | 82 | 2.3 | −6.9 | ||
| Majority | 306 | 8.6 | |||
| Turnout | 3,548 | 40.0 | |||
| Conservative hold | Swing | ||||
| Party | Candidate | Votes | % | ±% | |
|---|---|---|---|---|---|
| Conservative | 1,344 | 46.2 | +7.8 | ||
| Liberal Democrats | 1,291 | 44.3 | +1.4 | ||
| Labour | 277 | 9.5 | −9.3 | ||
| Majority | 53 | 1.9 | |||
| Turnout | 2,912 | 29.0 | |||
| Conservative gain from Liberal Democrats | Swing | ||||
2001-2005
| Party | Candidate | Votes | % | ±% | |
|---|---|---|---|---|---|
| Liberal Democrats | 756 | 39.0 | +7.9 | ||
| Conservative | 686 | 35.4 | −2.6 | ||
| Independent | 318 | 16.4 | +8.9 | ||
| Independent | 178 | 9.2 | +4.2 | ||
| Majority | 70 | 3.6 | |||
| Turnout | 1,938 | 23.6 | |||
| Liberal Democrats gain from Conservative | Swing | ||||
| Party | Candidate | Votes | % | ±% | |
|---|---|---|---|---|---|
| Liberal Democrats | Sheila Hobden | 1,330 | 41.3 | +7.3 | |
| Conservative | Jeffrey Coates | 1,090 | 33.8 | +3.0 | |
| Labour | Lesley Robson | 452 | 14.0 | −13.0 | |
| Independent | Sylvia Hardy | 351 | 10.9 | +10.9 | |
| Majority | 240 | 7.5 | |||
| Turnout | 3,223 | 26.3 | |||
| Liberal Democrats hold | Swing | ||||
2005-2009
| Party | Candidate | Votes | % | ±% | |
|---|---|---|---|---|---|
| Conservative | William Mumford | 1,530 | 49.5 | +3.8 | |
| Liberal Democrats | Keith Baldry | 1,421 | 46.0 | +3.1 | |
| Labour | David Trigger | 140 | 4.5 | +4.5 | |
| Majority | 109 | 3.5 | |||
| Turnout | 3,091 | 35.9 | |||
| Conservative hold | Swing | ||||
| Party | Candidate | Votes | % | ±% | |
|---|---|---|---|---|---|
| Liberal Democrats | Vanessa Newcombe | 1,265 | 39.3 | −4.5 | |
| Conservative | Margaret Baldwin | 1,211 | 37.6 | +17.8 | |
| Labour | Allan Hart | 568 | 17.7 | −8.7 | |
| Green | Andrew Bell | 174 | 5.4 | +0.8 | |
| Majority | 54 | 1.7 | |||
| Turnout | 3,218 | 30.0 | |||
| Liberal Democrats hold | Swing | ||||
| Party | Candidate | Votes | % | ±% | |
|---|---|---|---|---|---|
| Liberal Democrats | Alan Connett | 1,969 | 62.5 | +12.1 | |
| Conservative | Francine Tullis | 1,182 | 37.5 | +0.4 | |
| Majority | 787 | 25.0 | |||
| Turnout | 3,151 | 42.9 | |||
| Liberal Democrats hold | Swing | ||||
2013-2017
| Party | Candidate | Votes | % | ±% | |
|---|---|---|---|---|---|
| Conservative | Richard Hosking | 2,493 | 57.9 | +6.8 | |
| Liberal Democrats | Brian Blake | 1,028 | 23.9 | +6.2 | |
| Labour | David Trigger | 706 | 16.4 | +16.4 | |
| Majority | 1,465 | 34.0 | +1.8 | ||
| Turnout | 4,307 | 47.6 | +11.8 | ||
| Conservative hold | Swing | ||||
2017-2021
| Party | Candidate | Votes | % | ±% | |
|---|---|---|---|---|---|
| Labour | Greg Sheldon | 1032 | 31.9 | −19% | |
| Conservative | John Harvey | 992 | 30.7 | −1% | |
| Liberal Democrats | Rowena Squires | 576 | 17.8 | +11% | |
| Green | Lizzie Woodman | 563 | 17.4 | +11% | |
| For Britain | Frankie Rufolo | 70 | 2.2 | +2.2% | |
| Majority | 40 | 1.2% | −18.7% | ||
| Turnout | 3,248 | 30.6 | −10.4% | ||
| Labour hold | Swing | ||||
Notes
- Liberal Party, 1973–1981; SDP–Liberal Alliance, 1985.
- Ecology Party, 1981–1985; Green Party (UK), 1989.
- Boundary changes reduced the number of seats by 13.[4]
- Boundary changes increased the number of seats by eight.[10]
- Boundary changes reduced the number of seats by two.[1]
References
External links
Wikiwand - on
Seamless Wikipedia browsing. On steroids.