Top Qs
Timeline
Chat
Perspective
Demographic history
From Wikipedia, the free encyclopedia
Remove ads
Demographic history is the reconstructed record of human population in the past. Given the lack of population records prior to the 1950s, there are many gaps in our record of demographic history. Historical demographers must make do with estimates, models and extrapolations. For the demographic methodology, see historical demography.

Remove ads
Historical population of the world
Summarize
Perspective

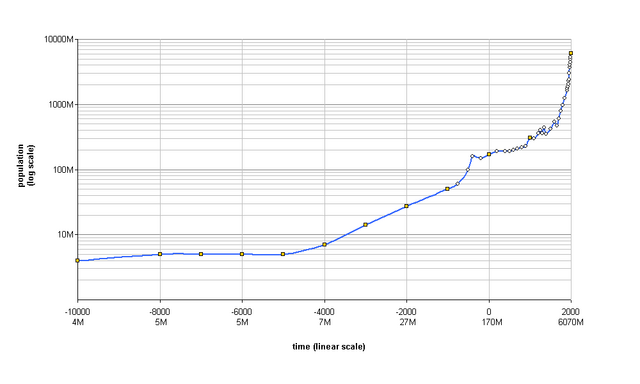
Estimating the ancestral population of anatomically modern humans, Colin McEvedy and Richard Jones chose bounds based on gorilla and chimpanzee population densities of 1/km2 and 3-4/km2,[1] respectively, then assumed that as Homo erectus moved up the food chain, they lost an order of magnitude in density. With a habitat of 68 million km2 ("the Old World south of latitude 50° north, minus Australia"), Homo erectus could have numbered around 1.7 million individuals. After being replaced by Homo sapiens and moving into the New World and de-glaciated territory, by 10,000 BC world population was approaching four million people.[2] McEvedy and Jones argue that, after populating the maximum available range, this was the limit of our food-gathering ancestors, with further population growth requiring food-producing activities.[3]
The initial population "upswing" began around 5000 BC. Global population gained 50% in the 5th millennium BC, and 100% each millennium until 1000 BC, reaching 50 million people. After the beginning of the Iron Age, growth rate reached its peak with a doubling time of 500 years. However, growth slackened between 500 BC and 1 AD, before ceasing around 200 AD. This "primary cycle" was, at this time in history, confined to Europe, North Africa, and mainland Asia.[4] McEvedy and Jones describe a secondary, "medieval cycle" being led by feudal Europe and Song China from around 900 AD.[5]
During the period from 500 to 900 world population grew slowly but the growth rate accelerated between 900 and 1300 when the population doubled. During the 14th century, there was a fall in population associated with the Black Death that spread from Asia to Europe. This was followed by a period of restrained growth for 300 years.[6]
John F. Richards estimated the following world populations from the early modern period, 1500–1800.[7]
- 1500 world population 400-500 million
- 1600 world population 500-600 million
- 1700 world population 600-700 million
- 1800 world population 850-950 million
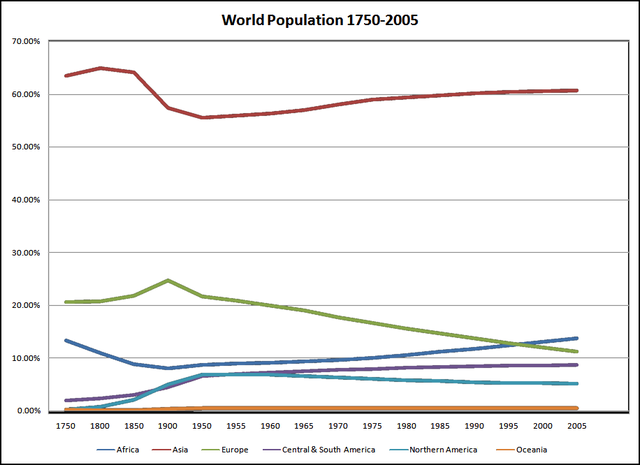
In the 18th century world population entered a period of accelerated growth. European population reached a peak growth rate of 10 per thousand per year in the second half of the 19th century. During the 20th century, the growth rate among the European populations fell and was overtaken by a rapid acceleration in the growth rate in other continents, which reached 21 per thousand per year in the last 50 years of the millennium. Between 1900 and 2000, the population of the world increased by 277%, a fourfold increase from 1.5 billion to 6 billion. The European component increased by 124%, and the remainder by 349%.[6]
Remove ads
Asia
Summarize
Perspective
India
The Indian population was about 100 million in 1500. Under the Mughal Empire, the population rose to 160 million in 1700 by 1800 the population rose to 185 million.[8] Mughal India had a relatively high degree of urbanization for its time, with 15% of its population living in urban centres, higher than the percentage of the urban population in contemporary Europe at the time and higher than that of British India in the 19th century.[9] Under the British Raj, the population reached 255 million according to the census taken in 1881.[10][11][12][13]
Studies of India's population since 1881 have focused on such topics as total population, birth and death rates, growth rates, geographic distribution, literacy, the rural and urban divide, cities of a million, and the three cities with populations over eight million: Delhi, Greater Mumbai (Bombay), and Kolkata (Calcutta).[14]
Mortality rates fell in 1920-45 era, primarily due to biological immunization. Other factors included rising incomes and better living conditions, improved better nutrition, a safer and cleaner environmental, and better official health policies and medical care.[15]
Severe overcrowding in the cities caused major public health problems, as noted in an official report from 1938:[16]
- In the urban and industrial areas ... cramped sites, the high values of land and the necessity for the worker to live in the vicinity of his work ... all tend to intensify congestion and overcrowding. In the busiest centres houses are built close together, eave touching eave, and frequently back to back .... Indeed space is so valuable that, in place of streets and roads, winding lanes provide the only approach to the houses. Neglect of sanitation is often evidenced by heaps of rotting garbage and pools of sewage, whilst the absence of latrines enhance the general pollution of air and soil.
China
China has older bureaucratic records than any other country.[17] For example, Chinese imperial examinations can be dated back to 165 AD.[18] British Economist Angus Maddison estimated Asia's past populations through detailed analysis of China's bureaucratic records and the country's past gross domestic product.[19]
Population of Asia 1-1820 C.E. (million)
Source: Maddison[19]
In the 15th century, China had approximately 100 million population.[20] During the Ming (1368-1644) and Qing (1644-1911) dynasties, China experienced a high population increase. From the years 1749 to 1811 the population doubled from approximately 177 million to 358 million.[21] Advances in China's agriculture made feeding such a growing population possible. However, by 1815 increased rice prices caused landless households to favor feeding male infants which caused an increase in infant female mortality.[22] Middle class households did the opposite due to their higher economic means and their infant female mortality rate declined.[23] The rising cost of rice additionally affected the adult demographics, adult male mortality rate increased more than the adult female mortality rate.[24]
The growing population of China continued into the 21st century. The country continued to face the strenuous issue of how to feed its ever-growing population. In 1979 extreme reform was put into place with the implementation of China's one-child policy.[25]
Remove ads
Early modern Europe
Summarize
Perspective
Karl Julius Beloch (and for Russia, Yaroslav Vodarsky) estimated the population of early modern Europe, circa 1600 as follows:[26][27]
See also
- Historical demography, Methodology and sources
- Classical demography, Ancient world
- Medieval demography
- Early modern demography
- Paleodemography
- Prehistoric demography
- Category:Demographic history by country or region
References
Further reading
External links
Wikiwand - on
Seamless Wikipedia browsing. On steroids.
Remove ads
