Clarin, Bohol
Municipality in Bohol, Philippines From Wikipedia, the free encyclopedia
Clarin, officially the Municipality of Clarin (Cebuano: Munisipyo sa Clarin; Tagalog: Bayan ng Clarin), is a municipality in the province of Bohol, Philippines. According to the 2020 census, it has a population of 21,158 people.[4]
Clarin | |
|---|---|
| Municipality of Clarin | |
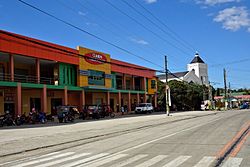
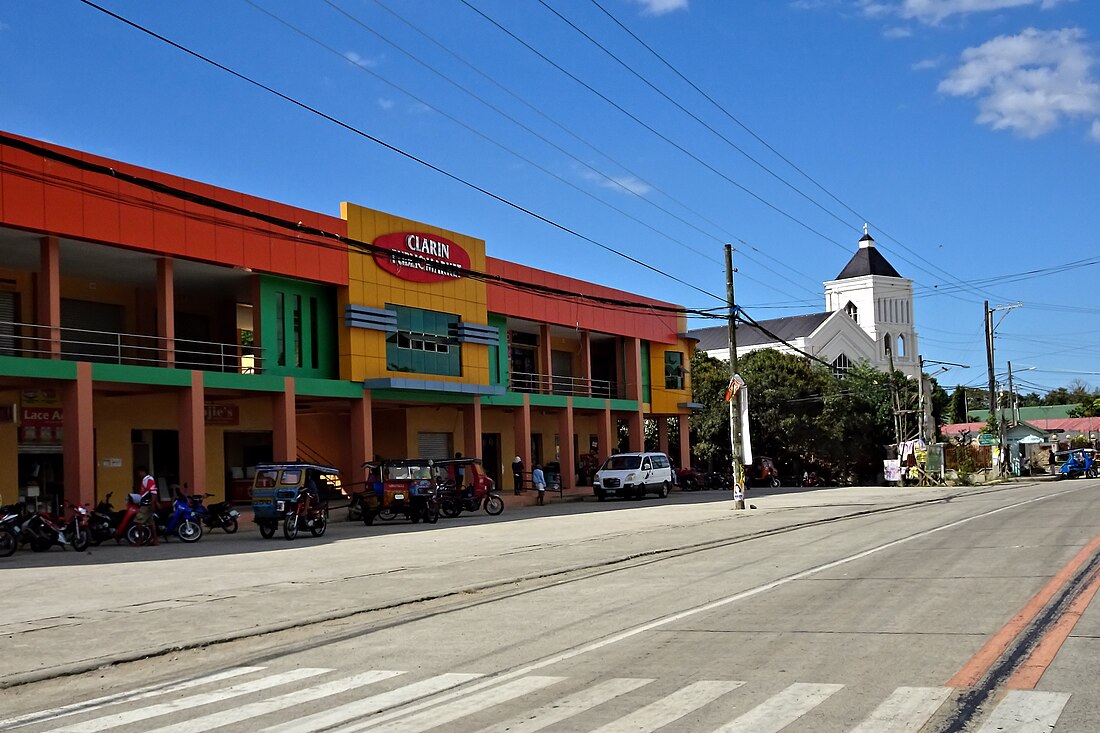
 Clarin – market and church (new 2016) | |
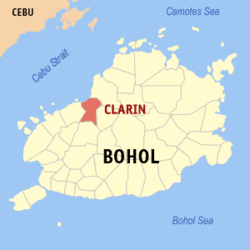
 Map of Bohol with Clarin highlighted | |
Location within the Philippines | |
| Coordinates: 9°58′N 124°01′E | |
| Country | Philippines |
| Region | Central Visayas |
| Province | Bohol |
| District | 2nd district |
| Founded | 31 January 1919 |
| Barangays | 24 (see Barangays) |
| Government | |
| • Type | Sangguniang Bayan |
| • Mayor | Engr. Eugeniano E. Ibarra (suspended)[2] Fernando C. Camacho Jr. (acting) |
| • Vice Mayor | Nora P. Salera (acting) |
| • Representative | Ma. Vanessa C. Aumentado |
| • Municipal Council | Members |
| • Electorate | 16,673 voters (2025) |
| Area | |
• Total | 52.12 km2 (20.12 sq mi) |
| Elevation | 61 m (200 ft) |
| Highest elevation | 294 m (965 ft) |
| Lowest elevation | −1 m (−3 ft) |
| Population (2020 census)[4] | |
• Total | 21,158 |
| • Density | 410/km2 (1,100/sq mi) |
| • Households | 5,114 |
| Economy | |
| • Income class | 5th municipal income class |
| • Poverty incidence | 23.19 |
| • Revenue | ₱ 132.8 million (2022) |
| • Assets | ₱ 365.3 million (2022) |
| • Expenditure | ₱ 99.44 million (2022) |
| • Liabilities | ₱ 56.64 million (2022) |
| Service provider | |
| • Electricity | Bohol 1 Electric Cooperative (BOHECO 1) |
| Time zone | UTC+8 (PST) |
| ZIP code | 6330 |
| PSGC | |
| IDD : area code | +63 (0)38 |
| Native languages | Boholano dialect Cebuano Tagalog |
Geography
Summarize
Perspective

Clarin is bounded by Tubigon in the west, Inabanga in the northeast, Sagbayan in the east, and Catigbian in the south. It is 61 kilometres (38 mi) from Tagbilaran.
Barangays
Clarin is politically subdivided into 24 barangays. Each barangay consists of puroks and some have sitios.
| PSGC | Barangay | Population | ±% p.a. | |||
|---|---|---|---|---|---|---|
| 2020[4] | 2010[6] | |||||
| 071214001 | Bacani | 5.6% | 1,185 | 1,208 | −0.19% | |
| 071214002 | Bogtongbod | 6.7% | 1,428 | 1,377 | 0.36% | |
| 071214003 | Bonbon | 6.7% | 1,427 | 1,487 | −0.41% | |
| 071214004 | Bontud | 2.3% | 497 | 456 | 0.86% | |
| 071214005 | Buacao | 3.0% | 644 | 797 | −2.11% | |
| 071214006 | Buangan | 3.9% | 824 | 796 | 0.35% | |
| 071214007 | Cabog | 3.9% | 829 | 764 | 0.82% | |
| 071214008 | Caboy | 2.7% | 569 | 571 | −0.04% | |
| 071214009 | Caluwasan | 1.2% | 255 | 222 | 1.40% | |
| 071214010 | Candajec | 5.0% | 1,061 | 932 | 1.30% | |
| 071214011 | Cantoyoc | 1.6% | 346 | 343 | 0.09% | |
| 071214012 | Comaang | 2.4% | 498 | 471 | 0.56% | |
| 071214013 | Danahao | 3.3% | 693 | 856 | −2.09% | |
| 071214014 | Katipunan | 1.4% | 301 | 340 | −1.21% | |
| 071214015 | Lajog | 6.0% | 1,262 | 1,381 | −0.90% | |
| 071214016 | Mataub | 3.0% | 632 | 700 | −1.02% | |
| 071214017 | Nahawan | 10.4% | 2,202 | 2,208 | −0.03% | |
| 071214018 | Poblacion Centro | 6.1% | 1,285 | 1,234 | 0.41% | |
| 071214019 | Poblacion Norte | 3.9% | 831 | 838 | −0.08% | |
| 071214020 | Poblacion Sur | 5.9% | 1,246 | 1,159 | 0.73% | |
| 071214021 | Tangaran | 3.7% | 776 | 850 | −0.91% | |
| 071214022 | Tontunan | 2.8% | 593 | 559 | 0.59% | |
| 071214023 | Tubod | 2.3% | 484 | 402 | 1.87% | |
| 071214024 | Villaflor | 2.0% | 423 | 345 | 2.06% | |
| Total | 21,158 | 20,296 | 0.42% | |||
Climate
| Climate data for Clarin, Bohol | |||||||||||||
|---|---|---|---|---|---|---|---|---|---|---|---|---|---|
| Month | Jan | Feb | Mar | Apr | May | Jun | Jul | Aug | Sep | Oct | Nov | Dec | Year |
| Mean daily maximum °C (°F) | 28 (82) |
28 (82) |
29 (84) |
31 (88) |
31 (88) |
30 (86) |
30 (86) |
30 (86) |
30 (86) |
29 (84) |
29 (84) |
28 (82) |
29 (85) |
| Mean daily minimum °C (°F) | 23 (73) |
23 (73) |
23 (73) |
23 (73) |
24 (75) |
24 (75) |
24 (75) |
24 (75) |
24 (75) |
24 (75) |
24 (75) |
23 (73) |
24 (74) |
| Average precipitation mm (inches) | 98 (3.9) |
82 (3.2) |
96 (3.8) |
71 (2.8) |
104 (4.1) |
129 (5.1) |
101 (4.0) |
94 (3.7) |
99 (3.9) |
135 (5.3) |
174 (6.9) |
143 (5.6) |
1,326 (52.3) |
| Average rainy days | 18.0 | 14.1 | 17.1 | 16.8 | 23.7 | 25.7 | 25.8 | 23.3 | 24.2 | 25.9 | 24.0 | 20.6 | 259.2 |
| Source: Meteoblue (modeled/calculated data, not measured locally)[7] | |||||||||||||
History
Summarize
Perspective
On January 1st of 1919, Executive Order No. 3[8] from the Office of the Governor-General of the Philippine Islands, took effect marking the birth of the Municipality of Clarin in the Province of Bohol. It was signed by Acting Governor-General of the Philippine Islands, Charles E. Yeater.
Under Executive Order No. 3, s. 1919,[8] Clarin was initially composed of the barrios/barangays of Canogon, Cumaang, Bonbon, Buangan, Tontunan, and Lajog from the Municipality of Tubigon, and the barrios/barangays of Nahawan, Obohan, and Canmaya from the Municipality of Inabanga. Barrio Canogon became its barrio Poblacion and the seat of the newly created town.
In the same year, Executive Order No. 3[8] was amended on February 27, 1919, by Executive Order No. 22,[9] which returned barrio/barangay Obohan to its former municipality in exchange for barrio/barangay Cantoyoc, while the rest remained unchanged. Additionally, a boundary line between the Municipalities of Clarin and Inabanga was established along the Nahawan River.
The Municipality of Clarin was named after Don Aniceto Clarín y Vélez, the first Civil Governor of Bohol.
Clarin was severely affected by the 20d13 Bohol earthquake which damaged 1,358 homes, of which 221 were totally destroyed, as well as the Catholic church.[10]
- Roman Catholic Church before earthquake
- Roman Catholic Church after earthquake
Demographics
| Year | Pop. | ±% p.a. |
|---|---|---|
| 1939 | 15,809 | — |
| 1948 | 15,005 | −0.58% |
| 1960 | 10,248 | −3.13% |
| 1970 | 11,723 | +1.35% |
| 1975 | 13,105 | +2.26% |
| 1980 | 13,721 | +0.92% |
| 1990 | 16,021 | +1.56% |
| 1995 | 15,961 | −0.07% |
| 2000 | 18,040 | +2.66% |
| 2007 | 18,871 | +0.62% |
| 2010 | 20,296 | +2.68% |
| 2015 | 20,301 | +0.00% |
| 2020 | 21,158 | +0.82% |
| Source: Philippine Statistics Authority[11][6][12][13] | ||
Economy
Poverty incidence of Clarin
10
20
30
40
50
2000
46.36 2003
19.24 2006
40.50 2009
39.17 2012
26.37 2015
22.91 2018
17.40 2021
23.19 Source: Philippine Statistics Authority[14][15][16][17][18][19][20][21] |
Education
The accessibility of this section is in question. The specific issue is: screen readers can not read content that is hidden. Relevant discussion may be found on the talk page. (February 2025) |
Elementary and primary schools
-
- Bacani Elementary School
- Bogtongbod Elementary School
- Bonbon Elementary School
- Buacao Primary School
- Buangan Elementary School
- Bontud Primary School
- Caboy Elementary School
- Clarin Central Elementary School
- Danahaw Elementary School
- Lajog Elementary School
- Nahawan Elementary School
- Tontunan Elementary School
Secondary schools
-
- Clarin National School of Fisheries
- Nahawan National High School
- Tontunan National High School
- Danahaw Integrated School
- Presentation Mary School of Clarin (PMSC)
Tertiary schools
References
External links
Wikiwand - on
Seamless Wikipedia browsing. On steroids.


