Chantonnay
Commune in Pays de la Loire, France From Wikipedia, the free encyclopedia
Chantonnay (French: [ʃɑ̃tɔnɛ]) is a commune in the Vendée department in the Pays de la Loire region in western France.
Chantonnay | |
|---|---|
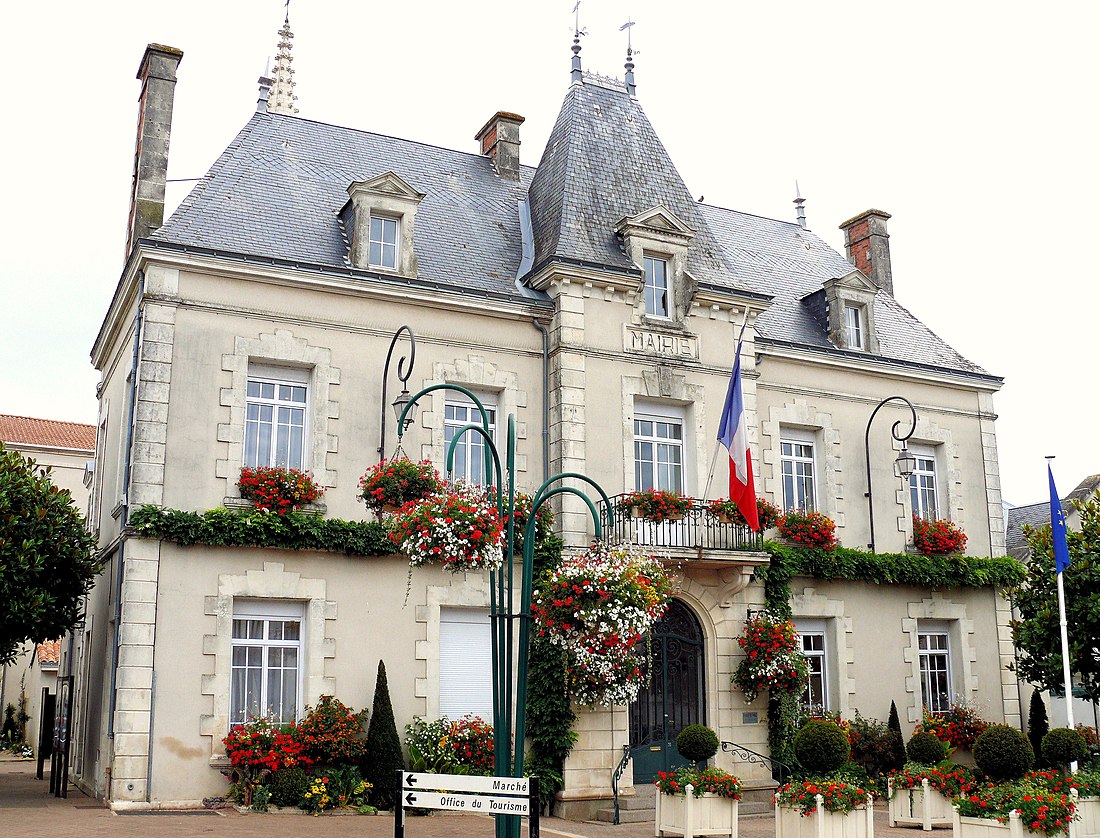
 The town hall in Chantonnay | |
| Coordinates: 46°41′16″N 1°02′58″W | |
| Country | France |
| Region | Pays de la Loire |
| Department | Vendée |
| Arrondissement | La Roche-sur-Yon |
| Canton | Chantonnay |
| Intercommunality | Pays de Chantonnay |
| Government | |
| • Mayor (2020–2026) | Isabelle Moinet[1] |
Area 1 | 82.91 km2 (32.01 sq mi) |
| Population (2022)[2] | 8,518 |
| • Density | 100/km2 (270/sq mi) |
| Time zone | UTC+01:00 (CET) |
| • Summer (DST) | UTC+02:00 (CEST) |
| INSEE/Postal code | 85051 /85110 |
| Elevation | 18–112 m (59–367 ft) |
| 1 French Land Register data, which excludes lakes, ponds, glaciers > 1 km2 (0.386 sq mi or 247 acres) and river estuaries. | |
Geography
Summarize
Perspective
The river Lay flows southwestward through the commune and forms part of its eastern and southern borders.
Climate
Chantonnay has an oceanic climate (Köppen climate classification Cfb). The average annual temperature in Chantonnay is 12.3 °C (54.1 °F). The average annual rainfall is 876.9 mm (34.52 in) with November as the wettest month. The temperatures are highest on average in July, at around 19.9 °C (67.8 °F), and lowest in January, at around 5.4 °C (41.7 °F). The highest temperature ever recorded in Chantonnay was 41.3 °C (106.3 °F) on 27 June 2019; the coldest temperature ever recorded was −17.0 °C (1.4 °F) on 15 February 1956.
| Climate data for Chantonnay (1981−2010 normals, extremes 1951−present) | |||||||||||||
|---|---|---|---|---|---|---|---|---|---|---|---|---|---|
| Month | Jan | Feb | Mar | Apr | May | Jun | Jul | Aug | Sep | Oct | Nov | Dec | Year |
| Record high °C (°F) | 16.7 (62.1) |
24.0 (75.2) |
26.8 (80.2) |
30.3 (86.5) |
35.0 (95.0) |
41.3 (106.3) |
39.8 (103.6) |
41.0 (105.8) |
35.2 (95.4) |
31.6 (88.9) |
22.8 (73.0) |
19.0 (66.2) |
41.3 (106.3) |
| Mean daily maximum °C (°F) | 8.6 (47.5) |
10.0 (50.0) |
13.4 (56.1) |
15.1 (59.2) |
20.1 (68.2) |
23.9 (75.0) |
26.1 (79.0) |
26.1 (79.0) |
22.9 (73.2) |
17.8 (64.0) |
12.2 (54.0) |
9.0 (48.2) |
17.2 (63.0) |
| Daily mean °C (°F) | 5.4 (41.7) |
5.9 (42.6) |
8.5 (47.3) |
10.7 (51.3) |
14.6 (58.3) |
18.0 (64.4) |
19.9 (67.8) |
19.8 (67.6) |
16.9 (62.4) |
13.3 (55.9) |
8.6 (47.5) |
5.8 (42.4) |
12.3 (54.1) |
| Mean daily minimum °C (°F) | 2.2 (36.0) |
1.8 (35.2) |
3.7 (38.7) |
5.4 (41.7) |
9.1 (48.4) |
12.0 (53.6) |
13.7 (56.7) |
13.5 (56.3) |
10.8 (51.4) |
8.8 (47.8) |
4.9 (40.8) |
2.6 (36.7) |
7.4 (45.3) |
| Record low °C (°F) | −15.0 (5.0) |
−17.0 (1.4) |
−11.2 (11.8) |
−5.0 (23.0) |
−3.0 (26.6) |
1.0 (33.8) |
3.0 (37.4) |
3.0 (37.4) |
0.0 (32.0) |
−4.4 (24.1) |
−8.0 (17.6) |
−12.5 (9.5) |
−17.0 (1.4) |
| Average precipitation mm (inches) | 97.5 (3.84) |
67.4 (2.65) |
63.5 (2.50) |
67.3 (2.65) |
62.6 (2.46) |
44.0 (1.73) |
49.9 (1.96) |
45.2 (1.78) |
73.2 (2.88) |
106.9 (4.21) |
96.3 (3.79) |
103.1 (4.06) |
876.9 (34.52) |
| Average precipitation days (≥ 1.0 mm) | 13.2 | 10.4 | 11.0 | 10.9 | 10.4 | 7.1 | 7.2 | 6.7 | 8.4 | 12.3 | 13.1 | 13.3 | 123.9 |
| Source: Météo-France[3] | |||||||||||||
Population
| Year | Pop. | ±% p.a. |
|---|---|---|
| 1968 | 6,172 | — |
| 1975 | 6,991 | +1.80% |
| 1982 | 7,235 | +0.49% |
| 1990 | 7,458 | +0.38% |
| 1999 | 7,541 | +0.12% |
| 2007 | 8,040 | +0.80% |
| 2012 | 8,306 | +0.65% |
| 2017 | 8,318 | +0.03% |
| Source: INSEE[4] | ||
See also
References
Wikiwand - on
Seamless Wikipedia browsing. On steroids.


