Top Qs
Timeline
Chat
Perspective
California's 22nd congressional district
Remove ads
"CA-22" redirects here. For the state route, see California State Route 22.
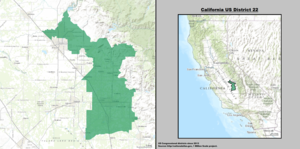
California's 22nd congressional district is a congressional district in the U.S. state of California. It is represented by David Valadao, who formerly represented California's 21st congressional district from 2013 to 2019 and 2021 to 2023. Following redistricting in 2021, the district is located in the San Joaquin Valley. It includes most of Kings County and parts of Tulare and Kern counties. It includes the east side of Bakersfield; the west and south sides of Tulare, the south side of Hanford; and all of Porterville, Lindsay, Shafter, Wasco, Delano, McFarland, Arvin, Lamont, and Corcoran.[3] The new 22nd is a majority-Latino district.
Quick Facts Representative, Population (2023) ...
| California's 22nd congressional district | |
|---|---|
.svg)  Interactive map of district boundaries since 2023 (Used in the 2022 elections) | |
| Representative | |
| Population (2023) | 774,942 |
| Median household income | $59,649[1] |
| Ethnicity |
|
| Cook PVI | R+1[2] |
Close
Remove ads
In the 2025 edition of the Cook Partisan Voting Index California's 22nd was rated as the median district of the country, with 217 districts rated more Democratic and 217 more Republican.[2]
Remove ads
Recent election results from statewide races
More information Year, Office ...
| Year | Office | Results[4][5][6][7] |
|---|---|---|
| 2008 | President | Obama 52% - 47% |
| 2010 | Governor | Brown 48% - 44% |
| Lt. Governor | Maldonado 52% - 36% | |
| Secretary of State | Bowen 46% - 44% | |
| Attorney General | Cooley 51% - 38% | |
| Treasurer | Lockyer 51% - 40% | |
| Controller | Chiang 50% - 40% | |
| 2012 | President | Obama 55% - 43% |
| 2014 | Governor | Brown 53% - 47% |
| 2016 | President | Clinton 55% - 39% |
| 2018 | Governor | Newsom 54% - 46% |
| Attorney General | Becerra 57% - 43% | |
| 2020 | President | Biden 55% - 42% |
| 2022 | Senate (Reg.) | Padilla 51% - 49% |
| Governor | Dahle 52% - 48% | |
| Lt. Governor | Underwood Jacobs 51% - 49% | |
| Secretary of State | Weber 50.3% - 49.7% | |
| Attorney General | Hochman 50.1% - 49.9% | |
| Treasurer | Guerrero 51% - 49% | |
| Controller | Chen 52% - 48% | |
| 2024 | President | Trump 52% - 46% |
| Senate (Reg.) | Garvey 53% - 47% |
Close
Remove ads
Composition
More information FIPS County Code, County ...
| FIPS County Code[8] | County | Seat | Population |
|---|---|---|---|
| 29 | Kern | Bakersfield | 913,820 |
| 31 | Kings | Hanford | 152,682 |
| 107 | Tulare | Visalia | 479,468 |
Close
Cities and CDPs with 10,000 or more people
- Bakersfield – 403,455
- Tulare – 68,875
- Porterville – 62,742
- Hanford – 57,990
- Delano – 51,428
- Oildale – 36,135
- East Niles – 28,390
- Edison – 28,390
- Wasco – 27,047
- Corcoran – 22,339
- Shafter – 19,953
- Arvin – 19,495
- Greenfield – 18,937
- McFarland – 14,161
- Lamont – 14,049
- Avenal – 13,696
- Lindsay – 12,659
- Hillcrest – 10,528
2,500 – 10,000 people
- East Bakersfield – 9,749
- Potomac Park – 9,164
- La Cresta – 8,787
- Earlimart – 7,679
- Fairfax – 7,605
- Cottonwood – 6,268
- East Porterville – 5,549
- Benton Park – 5,333
- Armona – 4,274
- Old Stine – 3,841
- Pixley – 3,828
- Rexland Acres – 3,563
- Greenfield – 3,447
- Strathmore – 3,033
- Terra Bella – 2,910
- Weedpatch – 2,658
- Richgrove – 2,538
- Tipton – 2,519
Remove ads
List of members representing the district
More information Member, Party ...

.jpg)


_(new_version).svg)
Close
Remove ads
Election results
1942
More information Party, Candidate ...
| Party | Candidate | Votes | % | ||
|---|---|---|---|---|---|
| Republican | John J. Phillips | 42,765 | 57.6% | ||
| Democratic | N. E. West | 31,440 | 42.4% | ||
| Total votes | 74,205 | 100.0% | |||
| Turnout | |||||
| Republican win (new seat) | |||||
Close
1944
More information Party, Candidate ...
| Party | Candidate | Votes | % | |
|---|---|---|---|---|
| Republican | John J. Phillips (incumbent) | 88,537 | 100.0% | |
| Turnout | ||||
| Republican hold | ||||
Close
1946
More information Party, Candidate ...
| Party | Candidate | Votes | % | |
|---|---|---|---|---|
| Republican | John J. Phillips (incumbent) | 59,935 | 62.1% | |
| Democratic | Ray Adkinson | 36,649 | 37.9% | |
| Total votes | 96,584 | 100.0% | ||
| Turnout | ||||
| Republican hold | ||||
Close
1948
More information Party, Candidate ...
| Party | Candidate | Votes | % | |
|---|---|---|---|---|
| Republican | John J. Phillips (incumbent) | 115,697 | 100.0% | |
| Turnout | ||||
| Republican hold | ||||
Close
1950
More information Party, Candidate ...
| Party | Candidate | Votes | % | |
|---|---|---|---|---|
| Republican | John J. Phillips (incumbent) | 114,497 | 100.0% | |
| Turnout | ||||
| Republican hold | ||||
Close
1952
More information Party, Candidate ...
| Party | Candidate | Votes | % | ||
|---|---|---|---|---|---|
| Republican | Joseph F. Holt | 85,039 | 60.5% | ||
| Democratic | Dean E. McHenry | 55,534 | 39.5% | ||
| Total votes | 140,573 | 100.0% | |||
| Turnout | |||||
| Republican win (new seat) | |||||
Close
1954
More information Party, Candidate ...
| Party | Candidate | Votes | % | |
|---|---|---|---|---|
| Republican | Joseph F. Holt (incumbent) | 65,165 | 58.2% | |
| Democratic | William M. "Bill" Costley | 46,875 | 41.8% | |
| Total votes | 112,040 | 100.0% | ||
| Turnout | ||||
| Republican hold | ||||
Close
1956
More information Party, Candidate ...
| Party | Candidate | Votes | % | |
|---|---|---|---|---|
| Republican | Joseph F. Holt (incumbent) | 97,317 | 59.8% | |
| Democratic | Irving Glasband | 65,314 | 40.2% | |
| Total votes | 162,631 | 100.0% | ||
| Turnout | ||||
| Republican hold | ||||
Close
1958
More information Party, Candidate ...
| Party | Candidate | Votes | % | |
|---|---|---|---|---|
| Republican | Joseph F. Holt (incumbent) | 87,785 | 55.4% | |
| Democratic | Irving Glasband | 70,777 | 44.6% | |
| Total votes | 158,562 | 100.0% | ||
| Turnout | ||||
| Republican hold | ||||
Close
1960
More information Party, Candidate ...
| Party | Candidate | Votes | % | |||
|---|---|---|---|---|---|---|
| Democratic | James C. Corman | 104,919 | 51.1% | |||
| Republican | Lemoine Blanchard | 100,321 | 48.9% | |||
| Total votes | 205,240 | 100.0% | ||||
| Turnout | ||||||
| Democratic gain from Republican | ||||||
Close
1962
More information Party, Candidate ...
| Party | Candidate | Votes | % | |
|---|---|---|---|---|
| Democratic | James C. Corman (incumbent) | 75,294 | 53.6% | |
| Republican | Charles S. Foote | 65,087 | 46.4% | |
| Total votes | 140,381 | 100.0% | ||
| Turnout | ||||
| Democratic hold | ||||
Close
1964
More information Party, Candidate ...
| Party | Candidate | Votes | % | |
|---|---|---|---|---|
| Democratic | James C. Corman (incumbent) | 94,141 | 50.5% | |
| Republican | Robert C. Cline | 92,133 | 49.5% | |
| Total votes | 186,274 | 100.0% | ||
| Turnout | ||||
| Democratic hold | ||||
Close
1966
More information Party, Candidate ...
| Party | Candidate | Votes | % | |
|---|---|---|---|---|
| Democratic | James C. Corman (incumbent) | 94,420 | 53.5% | |
| Republican | Robert C. Cline | 82,207 | 46.5% | |
| Total votes | 176,627 | 100.0% | ||
| Turnout | ||||
| Democratic hold | ||||
Close
1968
More information Party, Candidate ...
| Party | Candidate | Votes | % | |
|---|---|---|---|---|
| Democratic | James C. Corman (incumbent) | 102,332 | 56.9% | |
| Republican | Joe Holt | 74,433 | 41.4% | |
| Peace and Freedom | Hugh Manes | 3,024 | 1.7% | |
| Total votes | 179,789 | 100.0% | ||
| Turnout | ||||
| Democratic hold | ||||
Close
1970
More information Party, Candidate ...
| Party | Candidate | Votes | % | |
|---|---|---|---|---|
| Democratic | James C. Corman (incumbent) | 95,256 | 59.4% | |
| Republican | Tom Hayden | 63,297 | 39.5% | |
| American Independent | Callis R. Johnson | 1,880 | 1.1% | |
| Total votes | 160,433 | 100.0% | ||
| Turnout | ||||
| Democratic hold | ||||
Close
1972
More information Party, Candidate ...
| Party | Candidate | Votes | % | |
|---|---|---|---|---|
| Democratic | James C. Corman (incumbent) | 121,352 | 67.6% | |
| Republican | Bruce P. Wolfe | 52,664 | 29.3% | |
| Peace and Freedom | Ralph L. Shroyer | 5,583 | 3.1% | |
| Total votes | 179,599 | 100.0% | ||
| Turnout | ||||
| Democratic hold | ||||
Close
1974
More information Party, Candidate ...
| Party | Candidate | Votes | % | |||
|---|---|---|---|---|---|---|
| Republican | Carlos Moorhead (incumbent) | 78,983 | 55.8% | |||
| Democratic | Richard Hallin | 62,770 | 44.2% | |||
| Total votes | 141,753 | 100.0% | ||||
| Turnout | ||||||
| Republican gain from Democratic | ||||||
Close
1976
More information Party, Candidate ...
| Party | Candidate | Votes | % | |
|---|---|---|---|---|
| Republican | Carlos Moorhead (incumbent) | 114,769 | 62.6% | |
| Democratic | Robert S. Henry | 68,543 | 37.4% | |
| Total votes | 183,312 | 100.0% | ||
| Turnout | ||||
| Republican hold | ||||
Close
1978
More information Party, Candidate ...
| Party | Candidate | Votes | % | |
|---|---|---|---|---|
| Republican | Carlos Moorhead (incumbent) | 99,502 | 64.6% | |
| Democratic | Robert S. Henry | 54,442 | 35.4% | |
| Total votes | 153,944 | 100.0% | ||
| Turnout | ||||
| Republican hold | ||||
Close
1980
More information Party, Candidate ...
| Party | Candidate | Votes | % | |
|---|---|---|---|---|
| Republican | Carlos Moorhead (incumbent) | 115,241 | 63.9% | |
| Democratic | Pierce O'Donnell | 57,477 | 31.9% | |
| Libertarian | William V. Susel | 7,705 | 4.3% | |
| Total votes | 180,423 | 100.0% | ||
| Turnout | ||||
| Republican hold | ||||
Close
1982
More information Party, Candidate ...
| Party | Candidate | Votes | % | |
|---|---|---|---|---|
| Republican | Carlos Moorhead (incumbent) | 145,831 | 73.6% | |
| Democratic | Harvey L. Goldhammer | 46,521 | 23.5% | |
| Libertarian | Robert T. Gerringer | 5,870 | 3.0% | |
| Total votes | 198,222 | 100.0% | ||
| Turnout | ||||
| Republican hold | ||||
Close
1984
More information Party, Candidate ...
| Party | Candidate | Votes | % | |
|---|---|---|---|---|
| Republican | Carlos Moorhead (incumbent) | 184,981 | 85.2% | |
| Libertarian | Michael B. Yauch | 32,036 | 14.8% | |
| Total votes | 217,017 | 100.0% | ||
| Turnout | ||||
| Republican hold | ||||
Close
1986
More information Party, Candidate ...
| Party | Candidate | Votes | % | |
|---|---|---|---|---|
| Republican | Carlos Moorhead (incumbent) | 141,096 | 73.8% | |
| Democratic | John G. Simmons | 44,036 | 23.0% | |
| Libertarian | Jona Joy Bergland | 3,114 | 1.6% | |
| Peace and Freedom | Joel Lorimer | 2,930 | 1.5% | |
| Total votes | 191,176 | 100.0% | ||
| Turnout | ||||
| Republican hold | ||||
Close
1988
More information Party, Candidate ...
| Party | Candidate | Votes | % | |
|---|---|---|---|---|
| Republican | Carlos Moorhead (incumbent) | 164,699 | 69.5% | |
| Democratic | John G. Simmons | 61,555 | 26.0% | |
| Peace and Freedom | Shirley Rachel Isaacson | 6,298 | 2.7% | |
| Libertarian | Ted Brown | 4,259 | 1.8% | |
| Total votes | 235,811 | 100.0% | ||
| Turnout | ||||
| Republican hold | ||||
Close
1990
More information Party, Candidate ...
| Party | Candidate | Votes | % | |
|---|---|---|---|---|
| Republican | Carlos Moorhead (incumbent) | 108,634 | 60.0% | |
| Democratic | David Bayer | 61,630 | 34.1% | |
| Libertarian | William H. Wilson | 6,702 | 3.7% | |
| Peace and Freedom | Jan B. Tucker | 3,963 | 2.2% | |
| Total votes | 180,929 | 100.0% | ||
| Turnout | ||||
| Republican hold | ||||
Close
1992
More information Party, Candidate ...
| Party | Candidate | Votes | % | |
|---|---|---|---|---|
| Republican | Michael Huffington | 131,242 | 52.5% | |
| Democratic | Gloria Ochoa | 87,328 | 34.9% | |
| Green | Mindy Lorenz | 23,699 | 9.5% | |
| Libertarian | William Howard Dilbeck | 7,553 | 3.0% | |
| No party | Bialosky (write-in) | 104 | 0.1% | |
| Total votes | 249,926 | 100.0% | ||
| Turnout | ||||
| Republican hold | ||||
Close
1994
More information Party, Candidate ...
| Party | Candidate | Votes | % | |
|---|---|---|---|---|
| Republican | Andrea Seastrand | 102,987 | 49.27% | |
| Democratic | Walter Capps | 101,424 | 48.53% | |
| Libertarian | David L. Bersohn | 4,597 | 2.20% | |
| Total votes | 209,008 | 100.0% | ||
| Turnout | ||||
| Republican hold | ||||
Close
1996
More information Party, Candidate ...
| Party | Candidate | Votes | % | |||
|---|---|---|---|---|---|---|
| Democratic | Walter Capps | 118,299 | 48.5% | |||
| Republican | Andrea Seastrand (incumbent) | 107,987 | 44.3% | |||
| Independent | Steven Wheeler | 9,845 | 4.0% | |||
| Reform | Richard Porter | 3,975 | 1.6% | |||
| Libertarian | David Bersohn | 2,233 | 0.9% | |||
| Natural Law | Dawn Tomastik | 1,847 | 0.7% | |||
| Total votes | 244,186 | 100.0% | ||||
| Turnout | ||||||
| Democratic gain from Republican | ||||||
Close
1998 (special)
More information Party, Candidate ...
| Party | Candidate | Votes | % | |
|---|---|---|---|---|
| Democratic | Lois Capps | 93,392 | 53.46% | |
| Republican | Tom Bordonaro | 78,224 | 44.78% | |
| Libertarian | Robert Bakhaus | 3,079 | 1.76% | |
| Total votes | 174,695 | 100.00% | ||
| Turnout | ||||
| Democratic hold | ||||
Close
1998
More information Party, Candidate ...
| Party | Candidate | Votes | % | |
|---|---|---|---|---|
| Democratic | Lois Capps (incumbent) | 111,388 | 55.09% | |
| Republican | Tom J. Bordonaro Jr. | 86,921 | 42.99% | |
| Libertarian | Robert Bakhaus | 2,618 | 1.29% | |
| Reform | Richard D. "Dick" Porter | 1,263 | 0.62% | |
| Total votes | 202,190 | 100.0% | ||
| Turnout | ||||
| Democratic hold | ||||
Close
2000
More information Party, Candidate ...
| Party | Candidate | Votes | % | |
|---|---|---|---|---|
| Democratic | Lois Capps (incumbent) | 135,538 | 53.2% | |
| Republican | Mike Stoker | 113,094 | 44.4% | |
| Reform | Richard D. "Dick" Porter | 2,490 | 0.9% | |
| Libertarian | Joe Furcinite | 2,060 | 0.8% | |
| Natural Law | J. Carlos Aguirre | 1,888 | 0.7% | |
| Total votes | 255,070 | 100.0% | ||
| Turnout | ||||
| Democratic hold | ||||
Close
2002
More information Party, Candidate ...
| Party | Candidate | Votes | % | |||
|---|---|---|---|---|---|---|
| Republican | Bill Thomas | 120,473 | 73.4% | |||
| Democratic | Jaime A. Corvera | 38,988 | 23.7% | |||
| Libertarian | Frank Coates | 4,824 | 2.9% | |||
| Total votes | 164,285 | 100.0% | ||||
| Turnout | ||||||
| Republican gain from Democratic | ||||||
Close
2004
More information Party, Candidate ...
| Party | Candidate | Votes | % | |
|---|---|---|---|---|
| Republican | Bill Thomas (incumbent) | 209,384 | 100.0% | |
| Turnout | ||||
| Republican hold | ||||
Close
2006
More information Party, Candidate ...
| Party | Candidate | Votes | % | |
|---|---|---|---|---|
| Republican | Kevin McCarthy | 133,278 | 70.8% | |
| Democratic | Sharon M. Beery | 55,226 | 29.2% | |
| Total votes | 188,504 | 100.0% | ||
| Turnout | ||||
| Republican hold | ||||
Close
2008
More information Party, Candidate ...
| Party | Candidate | Votes | % | |
|---|---|---|---|---|
| Republican | Kevin McCarthy (incumbent) | 224,549 | 100.0% | |
| Total votes | 224,549 | 100.0% | ||
| Turnout | ||||
| Republican hold | ||||
Close
2010
More information Party, Candidate ...
| Party | Candidate | Votes | % | |
|---|---|---|---|---|
| Republican | Kevin McCarthy (incumbent) | 173,490 | 98.8% | |
| Independent | John Uebersax (write-in) | 2,173 | 1.2% | |
| Total votes | 175,663 | 100.0% | ||
| Turnout | ||||
| Republican hold | ||||
Close
2012
More information Party, Candidate ...
| Party | Candidate | Votes | % | |
|---|---|---|---|---|
| Republican | Devin Nunes (incumbent) | 132,386 | 61.9% | |
| Democratic | Otto Lee | 81,555 | 38.1% | |
| Total votes | 213,941 | 100.0% | ||
| Republican hold | ||||
Close
2014
More information Party, Candidate ...
| Party | Candidate | Votes | % | |
|---|---|---|---|---|
| Republican | Devin Nunes (incumbent) | 96,053 | 72.0% | |
| Democratic | Suzanna "Sam" Aguilera-Marrero | 37,289 | 28.0% | |
| Total votes | 133,342 | 100.0% | ||
| Republican hold | ||||
Close
2016
More information Party, Candidate ...
| Party | Candidate | Votes | % | |
|---|---|---|---|---|
| Republican | Devin Nunes (incumbent) | 158,755 | 67.6% | |
| Democratic | Louie J. Campos | 76,211 | 32.4% | |
| Total votes | 234,966 | 100.0% | ||
| Republican hold | ||||
Close
2018
More information Party, Candidate ...
| Party | Candidate | Votes | % | |
|---|---|---|---|---|
| Republican | Devin Nunes (incumbent) | 117,243 | 52.7% | |
| Democratic | Andrew Janz | 105,136 | 47.3% | |
| Total votes | 222,379 | 100.0% | ||
| Republican hold | ||||
Close
2020
More information Party, Candidate ...
| Party | Candidate | Votes | % | |
|---|---|---|---|---|
| Republican | Devin Nunes (incumbent) | 151,864 | 54.2% | |
| Democratic | Phil Arballo | 128,564 | 45.8% | |
| Total votes | 280,428 | 100.0% | ||
| Republican hold | ||||
Close
2022 (special)
More information Party, Candidate ...
| Party | Candidate | Votes | % | |
|---|---|---|---|---|
| Republican | Connie Conway | 69,954 | 62.1% | |
| Democratic | Lourin Hubbard | 42,688 | 37.9% | |
| Total votes | 112,642 | 100.0% | ||
| Republican hold | ||||
Close
2022
More information Party, Candidate ...
| Party | Candidate | Votes | % | |
|---|---|---|---|---|
| Republican | David Valadao (incumbent) | 52,994 | 51.5% | |
| Democratic | Rudy Salas | 49,862 | 48.5% | |
| Total votes | 102,856 | 100.0% | ||
| Republican hold | ||||
Close
2024
More information Party, Candidate ...
| Party | Candidate | Votes | % | |
|---|---|---|---|---|
| Republican | David Valadao (incumbent) | 89,484 | 53.4 | |
| Democratic | Rudy Salas | 78,023 | 46.6 | |
| Total votes | 167,507 | 100.0% | ||
| Republican hold | ||||
Close
Remove ads
Historical district boundaries

2003–2013

2013 – 2023
See also
References
External links
Wikiwand - on
Seamless Wikipedia browsing. On steroids.
Remove ads