Beinwil, Solothurn
Municipality in Solothurn, Switzerland From Wikipedia, the free encyclopedia
Beinwil is a municipality in the district of Thierstein in Canton of Solothurn in Switzerland.
Beinwil | |
|---|---|
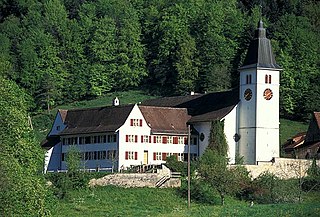
 Beinwil Abbey | |
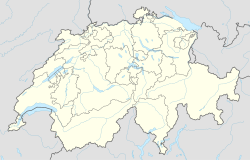
| Coordinates: 47°22′N 7°35′E | |
| Country | Switzerland |
| Canton | Solothurn |
| District | Thierstein |
| Area | |
• Total | 22.67 km2 (8.75 sq mi) |
| Elevation | 582 m (1,909 ft) |
| Population (31 December 2018)[2] | |
• Total | 283 |
| • Density | 12/km2 (32/sq mi) |
| Time zone | UTC+01:00 (Central European Time) |
| • Summer (DST) | UTC+02:00 (Central European Summer Time) |
| Postal code(s) | 4229 |
| SFOS number | 2612 |
| ISO 3166 code | CH-SO |
| Surrounded by | Aedermannsdorf, Erschwil, Lauwil (BL), Meltingen, Mervelier (JU), Montsevelier (JU), Mümliswil-Ramiswil, Nunningen, Schelten (BE) |
| Website | https://www.beinwil-so.ch SFSO statistics |
History
Beinwil is first mentioned in 1147 as Benwilre. In 1156, it was mentioned as Beinwilare.[3]
Geography

Beinwil has an area, as of 2009[update], of 22.66 square kilometers (8.75 sq mi). Of this area, 9.88 km2 (3.81 sq mi) or 43.6% is used for agricultural purposes, while 12.26 km2 (4.73 sq mi) or 54.1% is forested. Of the rest of the land, 0.43 km2 (0.17 sq mi) or 1.9% is settled (buildings or roads) and 0.08 km2 (20 acres) or 0.4% is unproductive land.[4]
Of the built-up area, housing and buildings made up 0.6% and transportation infrastructure made up 1.2%. Out of the forested land, 50.6% of the total land area is heavily forested and 3.5% is covered with orchards or small clusters of trees. Of the agricultural land, 0.4% is used for growing crops and 26.3% is pastures and 16.2% is used for alpine pastures.[4]
The municipality is located in the Thierstein district. It consists of scattered farm houses and small settlement clusters without a village center. It is divided into the regions of Unterbeinwil and Oberbeinwil.
Coat of arms
The blazon of the municipal coat of arms is Sable two Bones Argent in bend sinister.[5]
Demographics
Summarize
Perspective


Beinwil has a population (as of December 2020[update]) of 274.[6] As of 2008[update], 2.0% of the population are resident foreign nationals.[7] From 1999 to 2009, the population has changed at a rate of -4.7%. It has changed at a rate of -5.7% due to migration and at a rate of 3.5% due to births and deaths.[8]
Most of the population (as of 2000[update]) speaks German (303 or 97.4%), with French being second most common (3 or 1.0%) and Serbo-Croatian being third (3 or 1.0%).[9]
As of 2008[update], the gender distribution of the population was 52.2% male and 47.8% female. The population was made up of 153 Swiss men (49.0% of the population) and 10 (3.2%) non-Swiss men. There were 143 Swiss women (45.8%) and 6 (1.9%) non-Swiss women.[10] Of the population in the municipality, 171 or about 55.0% were born in Beinwil and lived there in 2000. There were 53 or 17.0% who were born in the same canton, while 72 or 23.2% were born somewhere else in Switzerland, and 13 or 4.2% were born outside of Switzerland.[9]
In 2008[update] there were 3 live births to Swiss citizens and were 2 deaths of Swiss citizens. Ignoring immigration and emigration, the population of Swiss citizens increased by 1 while the foreign population remained the same. There was 1 Swiss man who immigrated back to Switzerland and 1 Swiss woman who emigrated from Switzerland. At the same time, there was 1 non-Swiss man who immigrated from another country to Switzerland. The total Swiss population change in 2008 (from all sources, including moves across municipal borders) was a decrease of 3 and the non-Swiss population decreased by 4 people. This represents a population growth rate of -2.3%.[7]
The age distribution, as of 2000[update], in Beinwil is: 25 children or 8.0% of the population are between 0 and 6 years old and 61 teenagers or 19.6% are between 7 and 19. Of the adult population, 19 people or 6.1% of the population are between 20 and 24 years old. 86 people or 27.7% are between 25 and 44, and 87 people or 28.0% are between 45 and 64. The senior population distribution is 24 people or 7.7% of the population are between 65 and 79 years old and there are 9 people or 2.9% who are over 80.[11]
As of 2000[update], there were 149 people who were single and never married in the municipality. There were 135 married individuals, 21 widows or widowers and 6 individuals who are divorced.[9]
As of 2000[update], there were 101 private households in the municipality, and an average of 2.9 persons per household.[8] There were 21 households that consist of only one person and 15 households with five or more people. Out of a total of 105 households that answered this question, 20.0% were households made up of just one person and there was 1 adult who lived with their parents. Of the rest of the households, there are 19 married couples without children, 49 married couples with children There were 8 single parents with a child or children. There were 3 households that were made up of unrelated people and 4 households that were made up of some sort of institution or another collective housing.[9]
In 2000[update] there were 34 single family homes (or 35.4% of the total) out of a total of 96 inhabited buildings. There were 7 multi-family buildings (7.3%), along with 46 multi-purpose buildings that were mostly used for housing (47.9%) and 9 other use buildings (commercial or industrial) that also had some housing (9.4%). Of the single family homes 7 were built before 1919, while 3 were built between 1990 and 2000. The greatest number of single family homes (10) were built between 1961 and 1970.[12]
In 2000[update] there were 115 apartments in the municipality. The most common apartment size was 4 rooms of which there were 36. There were 2 single room apartments and 52 apartments with five or more rooms. Of these apartments, a total of 100 apartments (87.0% of the total) were permanently occupied, while 8 apartments (7.0%) were seasonally occupied and 7 apartments (6.1%) were empty.[12] As of 2009[update], the construction rate of new housing units was 0 new units per 1000 residents.[8] The vacancy rate for the municipality, in 2010[update], was 0%.[8]
The historical population is given in the following chart:[3][13]

Heritage sites of national significance
Summarize
Perspective

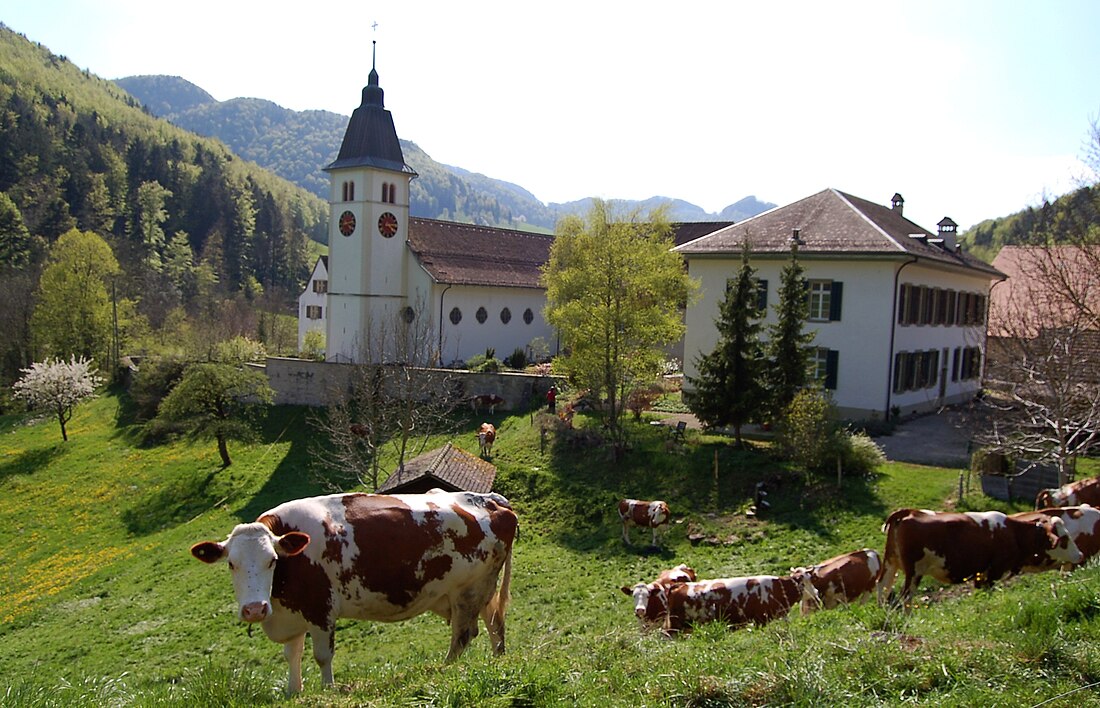
The Former Benedictine Beinwil Abbey is listed as a Swiss heritage site of national significance. The entire site of Beinwil Abbey is part of the Inventory of Swiss Heritage Sites.[14]
The abbey was founded around 1100, probably by the local nobility. It was first mentioned in 1147. After conflicts arising from the territorial claims of the towns of Solothurn and Basel against the Counts of Thierstein, who acted as the abbey's Vögte (lords protectors), it was burnt down in 1445. After Beinwil had been taken over by Solothurn in 1519, the town authorities impounded much of the abbey's possessions.
By the 16th century, only a few monks were left in the abbey, and it was formally dissolved in 1554. A small community remained, the care of which was assumed firstly by Einsiedeln Abbey, in 1589, and then, from 1622, by Rheinau Abbey. As no monastic revival could be achieved due to the remote location, it was decided to re-settle the community at Mariastein Abbey, a new foundation in a pilgrimage center, which took place in 1648. In anticipation of this, Mariastein became a member of the Swiss Congregation, now part of the Benedictine Confederation. From Mariastein, at the end of the 18th century, it was at length possible to revive Beinwil, and at that time the church and the monastic premises were rebuilt.
The abbey was however suppressed in 1874 by plebiscite during the Kulturkampf, and the community of Mariastein went into exile.
The abbey church, dedicated to Saint Vincent of Saragossa, was destroyed by fire in 1978. It has now been comprehensively restored and a high altar has been installed, dated about 1700, from Bellwald. The former abbey was used as an ecumenical conference and retreat center from 1982 until 2018.[15] It is now an Orthodox Monastery.
Politics
In the 2007 federal election, the most popular party was the FDP, which received 48.03% of the vote. The next three most popular parties were the CVP (29.38%), the SVP (13.51%) and the Green Party (6.08%). In the federal election, a total of 185 votes were cast, and the voter turnout was 79.1%.[16]
Economy
Summarize
Perspective
As of 2010[update], Beinwil had an unemployment rate of 0.9%. As of 2008[update], there were 100 people employed in the primary economic sector and about 37 businesses involved in this sector. Nine people were employed in the secondary sector and there were 3 businesses in this sector. Thirty-one people were employed in the tertiary sector, with 10 businesses in this sector.[8] There were 153 residents of the municipality who were employed in some capacity, of which females made up 38.6% of the workforce.
In 2008[update] the total number of full-time equivalent jobs was 98. The number of jobs in the primary sector was 70, of which 66 were in agriculture and 5 were in forestry or lumber production. The number of jobs in the secondary sector was 8 of which 7 or (87.5%) were in manufacturing and 1 was in construction. The number of jobs in the tertiary sector was 20. In the tertiary sector; 2 or 10.0% were in a hotel or restaurant, 4 or 20.0% were technical professionals or scientists, 3 or 15.0% were in education and 6 or 30.0% were in health care.[17]
In 2000[update], there were 15 workers who commuted into the municipality and 76 workers who commuted away. The municipality is a net exporter of workers, with about 5.1 workers leaving the municipality for every one entering.[18] Of the working population, 9.2% used public transportation to get to work, and 41.8% used a private car.[8]
Religion
From the 2000 census[update], 218 or 70.1% were Roman Catholic, while 65 or 20.9% belonged to the Swiss Reformed Church. Of the rest of the population, there were three members of an Orthodox church (or about 0.96% of the population). There was one individual who belonged to another church. Nineteen (or about 6.11% of the population) belonged to no church, are agnostic or atheist, and five individuals (or about 1.61% of the population) did not answer the question.[9]
Education
In Beinwil, about 104 or (33.4%) of the population have completed non-mandatory upper secondary education, and 25 or (8.0%) have completed additional higher education (either university or a Fachhochschule). Of the 25 who completed tertiary schooling, 68.0% were Swiss men, 24.0% were Swiss women.[9]
During the 2010–2011 school year, there were a total of 38 students in the Beinwil school system. The education system in the Canton of Solothurn allows young children to attend two years of non-obligatory Kindergarten.[19] During that school year, there were six children in kindergarten. The canton's school system requires students to attend six years of primary school, with some of the children attending smaller, specialized classes. In the municipality, there were 32 students in primary school. The secondary school program consists of three lower, obligatory years of schooling, followed by three to five years of optional, advanced schools. All the lower secondary students from Beinwil attend their school in a neighboring municipality.[20]
As of 2000[update], there were 33 students from Beinwil who attended schools outside the municipality.[18]
References
External links
Wikiwand - on
Seamless Wikipedia browsing. On steroids.


