Ayse
Commune in Auvergne-Rhône-Alpes, France From Wikipedia, the free encyclopedia
Ayse (sometimes written Ayze, French pronunciation: [aiz]; Arpitan: Aïze) is a commune of the Haute-Savoie department in the Auvergne-Rhône-Alpes region in south-eastern France.
Ayse | |
|---|---|
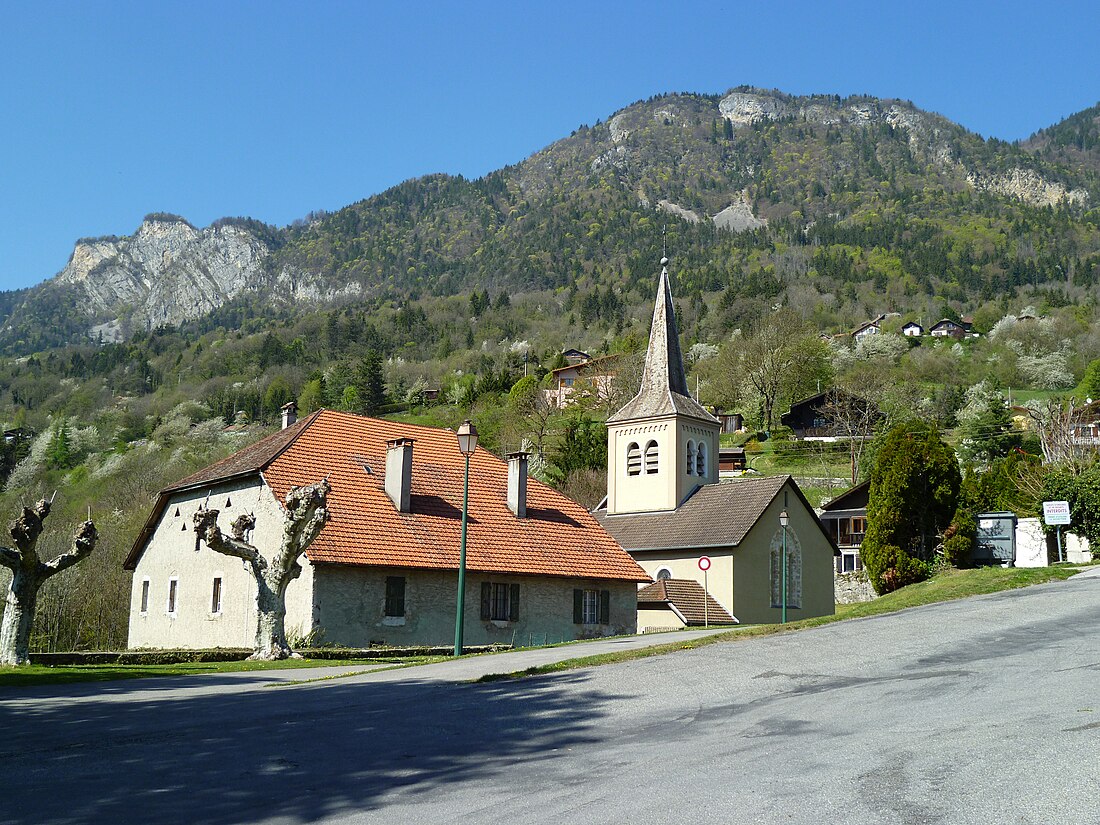
 The church in Ayse | |
| Coordinates: 46°05′00″N 6°26′15″E | |
| Country | France |
| Region | Auvergne-Rhône-Alpes |
| Department | Haute-Savoie |
| Arrondissement | Bonneville |
| Canton | Bonneville |
| Intercommunality | CC Fauciny-Glières |
| Government | |
| • Mayor (2020–2026) | Jean-Pierre Mermin[1] |
Area 1 | 10.48 km2 (4.05 sq mi) |
| Population (2022)[2] | 2,325 |
| • Density | 220/km2 (570/sq mi) |
| Time zone | UTC+01:00 (CET) |
| • Summer (DST) | UTC+02:00 (CEST) |
| INSEE/Postal code | 74024 /74130 |
| Elevation | 444–1,843 m (1,457–6,047 ft) |
| 1 French Land Register data, which excludes lakes, ponds, glaciers > 1 km2 (0.386 sq mi or 247 acres) and river estuaries. | |
Climate
| Climate data for Ayse (1991-2020, extremes 1951-present) | |||||||||||||
|---|---|---|---|---|---|---|---|---|---|---|---|---|---|
| Month | Jan | Feb | Mar | Apr | May | Jun | Jul | Aug | Sep | Oct | Nov | Dec | Year |
| Record high °C (°F) | 18.2 (64.8) |
22.6 (72.7) |
25.7 (78.3) |
28.9 (84.0) |
33.1 (91.6) |
35.8 (96.4) |
40.4 (104.7) |
40 (104) |
33.2 (91.8) |
28.6 (83.5) |
24 (75) |
20.4 (68.7) |
40.4 (104.7) |
| Mean daily maximum °C (°F) | 5.0 (41.0) |
7.9 (46.2) |
13.2 (55.8) |
17.3 (63.1) |
21.4 (70.5) |
25.2 (77.4) |
27.5 (81.5) |
27.0 (80.6) |
22.1 (71.8) |
16.5 (61.7) |
9.5 (49.1) |
5.2 (41.4) |
16.5 (61.7) |
| Daily mean °C (°F) | 1.3 (34.3) |
2.8 (37.0) |
6.9 (44.4) |
10.5 (50.9) |
14.7 (58.5) |
18.4 (65.1) |
20.4 (68.7) |
20.0 (68.0) |
15.9 (60.6) |
11.3 (52.3) |
5.4 (41.7) |
1.8 (35.2) |
10.8 (51.4) |
| Mean daily minimum °C (°F) | −2.4 (27.7) |
−2.2 (28.0) |
0.5 (32.9) |
3.7 (38.7) |
8.0 (46.4) |
11.5 (52.7) |
13.3 (55.9) |
13.4 (56.1) |
9.6 (49.3) |
6.1 (43.0) |
1.4 (34.5) |
−1.6 (29.1) |
5.1 (41.2) |
| Record low °C (°F) | −23.9 (−11.0) |
−23.2 (−9.8) |
−15 (5) |
−7 (19) |
−3.9 (25.0) |
−0.8 (30.6) |
2.8 (37.0) |
3 (37) |
−0.5 (31.1) |
−5.5 (22.1) |
−11.1 (12.0) |
−16.5 (2.3) |
−23.9 (−11.0) |
| Average precipitation mm (inches) | 80.8 (3.18) |
69.8 (2.75) |
79.0 (3.11) |
91.3 (3.59) |
116.8 (4.60) |
111.0 (4.37) |
109.1 (4.30) |
118.9 (4.68) |
110.0 (4.33) |
104.6 (4.12) |
101.4 (3.99) |
99.9 (3.93) |
1,192.6 (46.95) |
| Average precipitation days (≥ 1 mm) | 10.9 | 8.9 | 9.7 | 10 | 12.2 | 10.9 | 9.7 | 10.4 | 9.3 | 10.7 | 10.8 | 11.4 | 124.8 |
| Source: Meteociel[3] | |||||||||||||
Population
| Year | Pop. | ±% p.a. |
|---|---|---|
| 1968 | 628 | — |
| 1975 | 926 | +5.70% |
| 1982 | 1,262 | +4.52% |
| 1990 | 1,532 | +2.45% |
| 1999 | 1,817 | +1.91% |
| 2007 | 1,944 | +0.85% |
| 2012 | 2,039 | +0.96% |
| 2017 | 2,145 | +1.02% |
| Source: INSEE[4] | ||
See also
References
Wikiwand - on
Seamless Wikipedia browsing. On steroids.


