Antarctic ice sheet
Earth's southern polar ice cap From Wikipedia, the free encyclopedia

The Antarctic ice sheet is a continental glacier covering 98% of the Antarctic continent, with an area of 14 million square kilometres (5.4 million square miles) and an average thickness of over 2 kilometres (1.2 mi). It is the largest of Earth's two current ice sheets, containing 26.5 million cubic kilometres (6,400,000 cubic miles) of ice, which is equivalent to 61% of all fresh water on Earth. Its surface is nearly continuous, and the only ice-free areas on the continent are the dry valleys, nunataks of the Antarctic mountain ranges, and sparse coastal bedrock. However, it is often subdivided into the East Antarctic ice sheet (EAIS), West Antarctic ice sheet (WAIS), and Antarctic Peninsula (AP), due to the large differences in topography, ice flow, and glacier mass balance between the three regions.
| Antarctic Ice Sheet | |
|---|---|
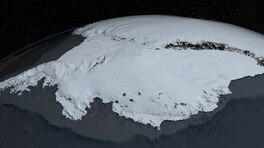 South facing visualization of the Antarctic ice sheet from the Pacific sector of the Southern Ocean (West Antarctic ice sheet, foreground; Antarctic Peninsula, to the left; East Antarctic ice sheet, background).[1][2] | |
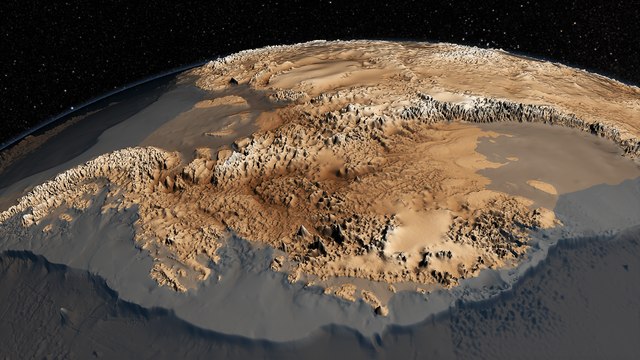
 Geographic map of Antarctica, with the grounded ice sheet in white, its floating ice shelves in gray, and ice-free land in brown. | |
| Type | Ice sheet |
| Location | Antarctica |
| Area | 14×106 km2 (5.4×10⁶ sq mi)[3] |
| Thickness | 2.2 km (1.4 mi) on average,[3] 4.9 km (3.0 mi) at maximum[2] |
| Status | Ongoing net loss of ice, regionally variable[4][5] |
Because the East Antarctic ice sheet is over 10 times larger than the West Antarctic ice sheet and located at a higher elevation, it is less vulnerable to climate change than the WAIS. In the 20th century, EAIS had been one of the only places on Earth which displayed limited cooling instead of warming, even as the WAIS warmed by over 0.1 °C/decade from 1950s to 2000, with an average warming trend of >0.05 °C/decade since 1957 across the whole continent. As of early 2020s, there is still net mass gain over the EAIS (due to increased precipitation freezing on top of the ice sheet), yet the ice loss from the WAIS glaciers such as Thwaites and Pine Island Glacier is far greater.
By 2100, net ice loss from Antarctica alone would add around 11 cm (5 in) to the global sea level rise. Further, the way WAIS is located deep below the sea level leaves it vulnerable to marine ice sheet instability, which is difficult to simulate in ice sheet models. If instability is triggered before 2100, it has the potential to increase total sea level rise caused by Antarctica by tens of centimeters more, particularly with high overall warming. Ice loss from Antarctica also generates fresh meltwater, at a rate of 1100–1500 billion tons (GT) per year. This meltwater dilutes the saline Antarctic bottom water, which weakens the lower cell of the Southern Ocean overturning circulation and may even contribute to its collapse, although this will likely take place over multiple centuries.
Paleoclimate research and improved modelling show that the West Antarctic ice sheet is very likely to disappear even if the warming does not progress any further, and only reducing the warming to 2 °C (3.6 °F) below the temperature of 2020 may save it. It is believed that the loss of the ice sheet would take between 2,000 and 13,000 years, although several centuries of high emissions may shorten this to 500 years. 3.3 m (10 ft 10 in) of sea level rise would occur if the ice sheet collapses but leaves ice caps on the mountains behind, and 4.3 m (14 ft 1 in) if those melt as well. Isostatic rebound may also add around 1 m (3 ft 3 in) to the global sea levels over another 1,000 years. On the other hand, the East Antarctic ice sheet is far more stable and may only cause 0.5 m (1 ft 8 in) - 0.9 m (2 ft 11 in) of sea level rise from the current level of warming, which is a small fraction of the 53.3 m (175 ft) contained in the full ice sheet. Around 3 °C (5.4 °F), vulnerable locations like Wilkes Basin and Aurora Basin may collapse over a period of around 2,000 years, which would add up to 6.4 m (21 ft 0 in) to sea levels. The loss of the entire ice sheet would require global warming in a range between 5 °C (9.0 °F) and 10 °C (18 °F), and a minimum of 10,000 years.
Geography
Summarize
Perspective
The Antarctic ice sheet covers an area of almost 14 million square kilometres (5.4 million square miles) and contains 26.5 million cubic kilometres (6,400,000 cubic miles) of ice.[6] A cubic kilometer of ice weighs approximately 0.92 metric gigatonnes, meaning that the ice sheet weighs about 24,380,000 gigatonnes. This ice is equivalent to around 61% of all fresh water on Earth.[7] The only other currently existing ice sheet on Earth is the Greenland ice sheet in the Arctic.[8]
The Antarctic ice sheet is divided by the Transantarctic Mountains into two unequal sections called the East Antarctic Ice Sheet (EAIS) and the smaller West Antarctic Ice Sheet (WAIS). Some glaciologists consider ice cover over the relatively small Antarctic Peninsula (also in West Antarctica) to be the third ice sheet in Antarctica,[9][10]: 2234 in part because its drainage basins are very distinct from the WAIS.[5] Collectively, these ice sheets have an average thickness of around 2 kilometres (1.2 mi),[3] Even the Transantarctic Mountains are largely covered by ice, with only some mountain summits and the McMurdo Dry Valleys being ice-free in the present. Some coastal areas also have exposed bedrock that is not covered by ice.[11] During the Late Cenozoic Ice Age, many of those areas had been covered by ice as well.[12][13]
The EAIS rests on a major land mass, but the bed of the WAIS is, in places, more than 2,500 meters (8,200 feet) below sea level. It would be seabed if the ice sheet were not there. The WAIS is classified as a marine-based ice sheet, meaning that its bed lies below sea level and its edges flow into floating ice shelves.[7][14] The WAIS is bounded by the Ross Ice Shelf, the Filchner-Ronne Ice Shelf, and outlet glaciers that drain into the Amundsen Sea.[15] Thwaites Glacier and Pine Island Glacier are the two most important outlet glaciers.[16]
Warming over the ice sheet
Summarize
Perspective


Antarctica is the coldest, driest continent on Earth, and has the highest average elevation.[19] Antarctica's dryness means the air contains little water vapor and conducts heat poorly.[18] The Southern Ocean surrounding the continent is far more effective at absorbing heat than any other ocean.[20] The presence of extensive, year-round sea ice, which has a high albedo (reflectivity), adds to the albedo of the ice sheets' own bright, white surface.[19] Antarctica's coldness means it is the only place on Earth where an atmospheric temperature inversion occurs every winter;[19] elsewhere on Earth, the atmosphere is at its warmest near the surface and becomes cooler as elevation increases. During the Antarctic winter, the surface of central Antarctica becomes cooler than middle layers of the atmosphere;[18] this means greenhouse gases trap heat in the middle atmosphere, and reduce its flow toward the surface and toward space, rather than preventing the flow of heat from the lower atmosphere to the upper layers. This effect lasts until the end of the Antarctic winter.[18][19] Early climate models predicted temperature trends over Antarctica would emerge more slowly and be more subtle than those elsewhere.[21]
There were fewer than twenty permanent weather stations across the continent and only two in the continent's interior. Automatic weather stations were deployed relatively late, and their observational record was brief for much of the 20th century satellite temperature measurements began in 1981 and are typically limited to cloud-free conditions. Thus, datasets representing the entire continent only began to appear by the very end of the 20th century.[22] The exception was the Antarctic Peninsula, where warming was pronounced and well-documented;[23] it was eventually found to have warmed by 3 °C (5.4 °F) since the mid 20th century.[24] Based on this limited data, several papers published in the early 2000s said there had been an overall cooling over continental Antarctica outside the Peninsula.[25][26] In particular, a 2002 analysis led by Peter Doran indicated stronger cooling than warming over Antarctica between 1966 and 2000, and found the McMurdo Dry Valleys in East Antarctica had experienced cooling of 0.7 °C per decade.[27] The paper noted that its data was limited, and it still found warming over 42% of the continent.[27][28]

Nevertheless, the paper received widespread media coverage, as multiple journalists described these findings as "contradictory" to global warming,[30][31][32] which was criticized by scientists at the time.[33][34] The "controversy" around cooling of Antarctica received further attention in 2004 when Michael Crichton wrote the novel State of Fear. The novel featured a fictional conspiracy among climate scientists to fake evidence of global warming, and cited Doran's study as proof that there was no warming in Antarctica outside of the Peninsula.[35] That novel was mentioned in a 2006 US Senate hearing in support of climate change denial,[36] and Peter Doran published a statement in The New York Times decrying the misinterpretation of his work.[28] The British Antarctic Survey and NASA also issued statements affirming the strength of climate science after the hearing.[37][38]
By 2009, researchers were able to combine historical weather-station data with satellite measurements to create consistent temperature records going back to 1957 that demonstrated warming of >0.05 °C per decade across the continent, with cooling in East Antarctica offset by the average temperature increase of at least 0.176 ± 0.06 °C per decade in West Antarctica.[29] That paper was widely reported on,[39][40] and subsequent research confirmed clear warming over West Antarctica in the 20th century, with the only uncertainty being the magnitude.[41] During 2012–2013, estimates based on WAIS Divide ice cores and revised temperature records from Byrd Station suggested a much-larger West-Antarctica warming of 2.4 °C (4.3 °F) since 1958, or around 0.46 °C (0.83 °F) per decade,[42][43][44][45] although some scientists continued to emphasize uncertainty.[46] In 2022, a study narrowed the warming of the Central area of the West Antarctic Ice Sheet between 1959 and 2000 to 0.31 °C (0.56 °F) per decade, and conclusively attributed it to increases in greenhouse gas concentrations caused by human activity.[47] Likewise, the strong cooling at McMurdo Dry Valleys was confirmed to be a local trend.[48]

The Antarctica-wide warming trend continued after 2000, and in February 2020, the continent recorded its highest-ever temperature of 18.3 °C, exceeding the previous record of 17.5 °C in March 2015.[50] The East Antarctica interior also demonstrated clear warming between 2000 and 2020.[49][51] In particular, the South Pole warmed by 0.61 ± 0.34 °C per decade between 1990 and 2020, which is three times the global average.[52][53] On the other hand, changes in atmospheric circulation patterns like the Interdecadal Pacific Oscillation (IPO) and the Southern Annular Mode (SAM) slowed or partially reversed the warming of West Antarctica, with the Antarctic Peninsula experiencing cooling from 2002.[54][55][56] While a variability in those patterns is natural, past ozone depletion had also led the SAM to be stronger than it had been in the past 600 years of observations. Starting around 2002, studies predicted a reversal in the SAM once the ozone layer began to recover following the Montreal Protocol,[57][58][59] and these changes are consistent with their predictions.[60]
Under the most intense climate change scenario known as RCP8.5, models predict Antarctic surface temperatures to rise by 3 °C (5.4 °F) by 2070[61] and by 4 °C (7.2 °F) on average by 2100; this will be accompanied by a 30% increase in precipitation and a 30% decrease in sea ice by 2100.[62] The Southern Ocean waters "south of 50° S latitude would also warm by about 1.9 °C (3.4 °F) by 2070.[61] RCPs were developed in the late 2000s, and early 2020s research considers RCP8.5 much less likely[63] than the more-moderate scenarios like RCP 4.5, which lie in between the worst-case scenario and the Paris Agreement goals.[64][65] If a low-emission scenario mostly consistent with the Paris Agreement goals is followed, then Antarctica would experience surface and ocean warming of less than 1 °C (1.8 °F) by 2070, while less than 15% of sea ice would be lost and precipitation would increase by less than 10%.[61]Ice loss and accumulation
Summarize
Perspective
Contrasting temperature trends across parts of Antarctica mean that some locations, particularly at the coasts, lose mass while locations further inland continue to gain mass. These contrasting trends and the remoteness of the region make estimating an average trend difficult.[66]
In 2018, a systematic review of all previous studies and data by the Ice Sheet Mass Balance Inter-comparison Exercise (IMBIE) estimated an increase in the West Antarctic ice sheet from 53 ± 29 Gt (gigatonnes) in 1992 to 159 ± 26 Gt in the final five years of the study. On the Antarctic Peninsula, the study estimated a loss of 20 ± 15 Gt per year with an increase in loss of roughly 15 Gt per year after 2000, a significant quantity of which was the loss of ice shelves.[67] The review's overall estimate was that Antarctica lost 2,720 ± 1,390 gigatons of ice from 1992 to 2017, averaging 109 ± 56 Gt per year. This would amount to 7.6 mm (0.30 in) of sea-level rise.[67]
A 2021 analysis of data from four research satellite systems – Envisat, European Remote-Sensing Satellite, GRACE and GRACE-FO, and ICESat – indicated an annual mass loss of about 12 Gt from 2012 to 2016 due to much-greater ice gain in East Antarctica than earlier estimated, which offset most of the losses from West Antarctica.[68] The East Antarctic ice sheet can still gain mass despite warming because effects of climate change on the water cycle increase precipitation over its surface, which then freezes and helps to accrete more ice.[69]: 1262Near-future sea level rise

By 2100, net ice loss from Antarctica is expected to add about 11 cm (4.3 in) to global sea-level rise.[69]: 1270 Other processes may cause West Antarctica to contribute more to sea-level rise. Marine ice-sheet instability is the potential for warm water currents to enter between the seafloor and the base of the ice sheet once the sheet is no longer heavy enough to displace such flows.[71] Marine ice-cliff instability may cause ice cliffs taller than 100 m (330 ft) to collapse under their own weight once they are no longer buttressed by ice shelves. This process has never been observed and it only occurs in some models.[72] By 2100, these processes may increase sea-level rise caused by Antarctica to 41 cm (16 in) under the low-emission scenario and by 57 cm (22 in) under the high-emission scenario.[69]: 1270
Some scientists have given greater estimates but all agree melting in Antarctica would have a greater impact and would be much more likely to occur under higher warming scenarios, where it may double the overall 21st-century sea-level rise to 2 m (7 ft) or more.[73][74][75] According to one study, if the Paris Agreement is followed and global warming is limited to 2 °C (3.6 °F), the loss of ice in Antarctica will continue at the 2020 rate for the rest of the 21st century, but if a trajectory leading to 3 °C (5.4 °F) is followed, Antarctica ice loss will accelerate after 2060 and start adding 0.5 cm (0.20 in) per year to global sea levels by 2100.[76]Weakening Antarctic circulation

Ice loss from Antarctica also generates more fresh meltwater, at a rate of 1100–1500 billion tons (GT) per year.[78]: 1240 This meltwater then mixes back into the Southern Ocean, which makes its water fresher.[79] This freshening of the Southern Ocean results in increased stratification and stabilization of its layers,[80][78]: 1240 and this has the single largest impact on the long-term properties of Southern Ocean circulation.[81] These changes in the Southern Ocean cause the upper cell circulation to speed up, accelerating the flow of major currents,[82] while the lower cell circulation slows down, as it is dependent on the highly saline Antarctic bottom water, which already appears to have been observably weakened by the freshening, in spite of the limited recovery during 2010s.[83][84][85][86][78]: 1240 Since the 1970s, the upper cell has strengthened by 3–4 sverdrup (Sv; represents a flow of 1 million cubic meters per second), or 50–60% of its flow, while the lower cell has weakened by a similar amount, but because of its larger volume, these changes represent a 10–20% weakening.[87][88]

While these effects weren't fully caused by climate change, with some role played by the natural cycle of Interdecadal Pacific Oscillation,[89][90] they are likely to worsen in the future. As of early 2020s, climate models' best, limited-confidence estimate is that the lower cell would continue to weaken, while the upper cell may strengthen by around 20% over the 21st century.[78] A key reason for the uncertainty is limited certainty about future ice loss from Antarctica and the poor and inconsistent representation of ocean stratification in even the CMIP6 models - the most advanced generation available as of early 2020s.[91] One study suggests that the circulation would lose half its strength by 2050 under the worst climate change scenario,[81] with greater losses occurring afterwards.[92]
It is possible that the South Ocean overturning circulation may not simply continue to weaken in response to increased warming and freshening, but will eventually collapse outright, in a way which would be difficult to reverse and constitute an example of tipping points in the climate system. This would be similar to some projections for Atlantic meridional overturning circulation (AMOC), which is also affected by the ocean warming and by meltwater flows from the declining Greenland ice sheet.[93] However, Southern Hemisphere is only inhabited by 10% of the world's population, and the Southern Ocean overturning circulation has historically received much less attention than the AMOC. Some preliminary research suggests that such a collapse may become likely once global warming reaches levels between 1.7 °C (3.1 °F) and 3 °C (5.4 °F), but there is far less certainty than with the estimates for most other tipping points in the climate system.[94] Even if initiated in the near future, the circulation's collapse is unlikely to be complete until close to 2300,[95] Similarly, impacts such as the reduction in precipitation in the Southern Hemisphere, with a corresponding increase in the North, or a decline of fisheries in the Southern Ocean with a potential collapse of certain marine ecosystems, are also expected to unfold over multiple centuries.[92]
Long-term future

Sea levels will continue to rise long after 2100 but potentially at very different rates. According to the most-recent reports of the Intergovernmental Panel on Climate Change (SROCC and the IPCC Sixth Assessment Report), there will be a median rise of 16 cm (6.3 in) and maximum rise of 37 cm (15 in) under the low-emission scenario. The highest-emission scenario results in a median rise of 1.46 m (5 ft) with a minimum of 60 cm (2 ft) and a maximum of 2.89 m (9+1⁄2 ft).[69]
Over longer timescales, the West Antarctic ice sheet, which is much smaller than the East Antarctic ice sheet and is grounded deep below sea level, is considered highly vulnerable. The melting of all of the ice in West Antarctica would increase global sea-level rise to 4.3 m (14 ft 1 in).[97] Mountain ice caps that are not in contact with water are less vulnerable than the majority of the ice sheet, which is located below sea level. The collapse of the West Antarctic ice sheet would cause around 3.3 m (10 ft 10 in) of sea-level rise.[98] This kind of collapse is now considered almost inevitable because it appears to have occurred during the Eemian period 125,000 years ago, when temperatures were similar to those in the early 21st century.[99][100][101] The Amundsen Sea also appears to be warming at rates that, if continued, make the ice sheet's collapse inevitable.[102][103]
The only way to reverse ice loss from West Antarctica once triggered is to lower the global temperature to 1 °C (1.8 °F) below the pre-industrial level, to 2 °C (3.6 °F) below the temperature of 2020.[104] Other researchers said a climate engineering intervention to stabilize the ice sheet's glaciers may delay its loss by centuries and give the environment more time to adapt. This is an uncertain proposal and would be one of the most-expensive projects ever attempted.[105][106] Otherwise, the disappearance of the West Antarctic ice sheet would take an estimated 2,000 years. The loss of West Antarctica ice would take at least 500 years and possibly as long as 13,000 years.[107][108] Once the ice sheet is lost, the isostatic rebound of the land previously covered by the ice sheet would result in an additional 1 m (3 ft 3 in) of sea-level rise over the following 1,000 years.[109]

If global warming were to reach higher levels, then the EAIS would play an increasingly larger role in sea level rise occurring after 2100. According to the most recent reports of the Intergovernmental Panel on Climate Change (SROCC and the IPCC Sixth Assessment Report), the most intense climate change scenario, where the anthropogenic emissions increase continuously, RCP8.5, would result in Antarctica alone losing a median of 1.46 m (4 ft 9 in) (confidence interval between 60 cm (2.0 ft) and 2.89 m (9 ft 6 in)) by 2300, which would involve some loss from the EAIS in addition to the erosion of the WAIS. This Antarctica-only sea level rise would be in addition to ice losses from the Greenland ice sheet and mountain glaciers, as well as the thermal expansion of ocean water.[111] If the warming were to remain at elevated levels for a long time, then the East Antarctic Ice Sheet would eventually become the dominant contributor to sea level rise, simply because it contains the largest amount of ice.[111][112]
Sustained ice loss from the EAIS would begin with the significant erosion of the so-called subglacial basins, such as Totten Glacier and Wilkes Basin, which are located in vulnerable locations below the sea level. Evidence from the Pleistocene shows that Wilkes Basin had likely lost enough ice to add 0.5 m (1 ft 8 in) to sea levels between 115,000 and 129,000 years ago, during the Eemian, and about 0.9 m (2 ft 11 in) between 318,000 and 339,000 years ago, during the Marine Isotope Stage 9.[113] Neither Wilkes nor the other subglacial basins were lost entirely, but estimates suggest that they would be committed to disappearance once the global warming reaches 3 °C (5.4 °F) - the plausible temperature range is between 2 °C (3.6 °F) and 6 °C (11 °F).[112][114] Then, the subglacial basins would gradually collapse over a period of around 2,000 years, although it may be as fast as 500 years or as slow as 10,000 years.[112][114] Their loss would ultimately add between 1.4 m (4 ft 7 in) and 6.4 m (21 ft 0 in) to sea levels, depending on the ice sheet model used. Isostatic rebound of the newly ice-free land would also add 8 cm (3.1 in) and 57 cm (1 ft 10 in), respectively.[115]
The entire East Antarctic Ice Sheet holds enough ice to raise global sea levels by 53.3 m (175 ft).[116] Its complete melting is also possible, but it would require very high warming and a lot of time: In 2022, an extensive assessment of tipping points in the climate system published in Science Magazine concluded that the ice sheet would take a minimum of 10,000 years to fully melt. It would most likely be committed to complete disappearance only once the global warming reaches about 7.5 °C (13.5 °F), with the minimum and the maximum range between 5 °C (9.0 °F) and 10 °C (18 °F).[112][114] Another estimate suggested that at least 6 °C (11 °F) would be needed to melt two thirds of its volume.[117]
If the entire ice sheet were to disappear, then the change in ice-albedo feedback would increase the global temperature by 0.6 °C (1.1 °F), while the regional temperatures would increase by around 2 °C (3.6 °F). The loss of the subglacial basins alone would only add about 0.05 °C (0.090 °F) to global temperatures due to their relatively limited area, and a correspondingly low impact on global albedo.[112][114]Situation during geologic time scales
Summarize
Perspective

The icing of Antarctica began in the Late Palaeocene or middle Eocene between 60[118] and 45.5 million years ago[119] and escalated during the Eocene–Oligocene extinction event about 34 million years ago. CO2 levels were then about 760 ppm[120] and had been decreasing from earlier levels in the thousands of ppm. Carbon dioxide decrease, with a tipping point of 600 ppm, was the primary agent forcing Antarctic glaciation.[121] The glaciation was favored by an interval when the Earth's orbit favored cool summers but oxygen isotope ratio cycle marker changes were too large to be explained by Antarctic ice-sheet growth alone indicating an ice age of some size.[122] The opening of the Drake Passage may have played a role as well[123] though models of the changes suggest declining CO2 levels to have been more important.[124]
The Western Antarctic ice sheet declined somewhat during the warm early Pliocene epoch, approximately five to three million years ago; during this time the Ross Sea opened up.[125] But there was no significant decline in the land-based Eastern Antarctic ice sheet.[126]
See also
References
Wikiwand - on
Seamless Wikipedia browsing. On steroids.