1986 United States Senate elections
From Wikipedia, the free encyclopedia

The 1986 United States Senate elections were elections for the United States Senate. Held on November 4, in the middle of Ronald Reagan's second presidential term, the 34 seats of Class 3 were contested in regular elections. The Republicans had to defend an unusually large number of freshman Senate incumbents who had been elected on President Ronald Reagan's coattails in 1980. Democrats won a net of eight seats, defeating seven freshman incumbents, picking up two Republican-held open seats, and regaining control of the Senate for the first time since January 1981. This remains the most recent midterm election cycle in which the sitting president's party suffered net losses while still flipping a Senate seat.
| ||||||||||||||||||||||||||||||||||||||||
34 of the 100 seats in the United States Senate 51 seats needed for a majority | ||||||||||||||||||||||||||||||||||||||||
|---|---|---|---|---|---|---|---|---|---|---|---|---|---|---|---|---|---|---|---|---|---|---|---|---|---|---|---|---|---|---|---|---|---|---|---|---|---|---|---|---|
| ||||||||||||||||||||||||||||||||||||||||
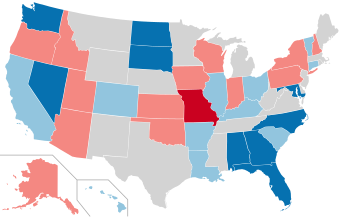 Results of the elections: Democratic gain Democratic hold Republican gain Republican hold No election Rectangular inset (North Carolina): both seats up for election | ||||||||||||||||||||||||||||||||||||||||
| ||||||||||||||||||||||||||||||||||||||||


Democrats gained a net eight seats, and recaptured control of the Senate from the Republicans with a 55–45 majority. They defeated seven incumbents, all but one of whom had been elected in 1980, and gained open seats held by retiring Republicans in Maryland and Nevada. Republicans gained one open seat in Missouri. Bob Dole (R-Kansas) and Robert Byrd (D-West Virginia) exchanged positions as the Majority Leader and the Minority Leader. However, the Democratic majority would be reduced to 54-46 following the March 1987 death of Democrat Edward Zorinsky, who was then replaced with a Republican.
This was the last election cycle — until 2016 — in which the Democrats in this class of senators amassed a gain in seats (not including special elections held in off-years in some states to fill the seats that had been vacated by senators due to death, resignation, or otherwise).
Results summary
Summarize
Perspective
| 55 | 45 |
| Democratic | Republican |
Shading indicates party with largest share of that line.
| Parties | Total | ||||||||||||||||||||||||||||||||||||||||||||||||||||||||||||||||||||||||||||||||||||||||||||||||||
|---|---|---|---|---|---|---|---|---|---|---|---|---|---|---|---|---|---|---|---|---|---|---|---|---|---|---|---|---|---|---|---|---|---|---|---|---|---|---|---|---|---|---|---|---|---|---|---|---|---|---|---|---|---|---|---|---|---|---|---|---|---|---|---|---|---|---|---|---|---|---|---|---|---|---|---|---|---|---|---|---|---|---|---|---|---|---|---|---|---|---|---|---|---|---|---|---|---|---|---|
| Democratic | Republican | Independent | Libertarian | Other | |||||||||||||||||||||||||||||||||||||||||||||||||||||||||||||||||||||||||||||||||||||||||||||||
| Last elections (1984) Before these elections |
47 | 53 | 0 | 0 | 0 | 100 | |||||||||||||||||||||||||||||||||||||||||||||||||||||||||||||||||||||||||||||||||||||||||||||
| Not up | 35 | 31 | — | — | — | 66 | |||||||||||||||||||||||||||||||||||||||||||||||||||||||||||||||||||||||||||||||||||||||||||||
| Up Class 3 (1980→1986) |
12 | 22 | — | — | — | 34 | |||||||||||||||||||||||||||||||||||||||||||||||||||||||||||||||||||||||||||||||||||||||||||||
| Incumbent retired | 3 | 3 | — | — | — | 6 | |||||||||||||||||||||||||||||||||||||||||||||||||||||||||||||||||||||||||||||||||||||||||||||
| Held by same party | 2 | 1 | — | — | — | 3 | |||||||||||||||||||||||||||||||||||||||||||||||||||||||||||||||||||||||||||||||||||||||||||||
| Replaced by other party | — | — | — | 3 | |||||||||||||||||||||||||||||||||||||||||||||||||||||||||||||||||||||||||||||||||||||||||||||||
| Result | 4 | 2 | 0 | 0 | 0 | 6 | |||||||||||||||||||||||||||||||||||||||||||||||||||||||||||||||||||||||||||||||||||||||||||||
| Incumbent ran | 9 | 19 | — | — | — | 28 | |||||||||||||||||||||||||||||||||||||||||||||||||||||||||||||||||||||||||||||||||||||||||||||
| Won re-election | 9 | 12 | — | — | — | 21 | |||||||||||||||||||||||||||||||||||||||||||||||||||||||||||||||||||||||||||||||||||||||||||||
| Lost re-election | — | — | — | 7 | |||||||||||||||||||||||||||||||||||||||||||||||||||||||||||||||||||||||||||||||||||||||||||||||
| Lost renomination, but held by same party |
0 | 0 | — | — | — | 0 | |||||||||||||||||||||||||||||||||||||||||||||||||||||||||||||||||||||||||||||||||||||||||||||
| Result | 16 | 12 | 0 | 0 | 0 | 28 | |||||||||||||||||||||||||||||||||||||||||||||||||||||||||||||||||||||||||||||||||||||||||||||
| Total elected | 20 | 14 | 0 | 0 | 0 | 34 | |||||||||||||||||||||||||||||||||||||||||||||||||||||||||||||||||||||||||||||||||||||||||||||
| Net gain/loss | 8 | ||||||||||||||||||||||||||||||||||||||||||||||||||||||||||||||||||||||||||||||||||||||||||||||||||
| Nationwide vote | 24,347,369 | 23,126,219[a] | 155,032 | 104,338 | 878,047 | 48,611,005 | |||||||||||||||||||||||||||||||||||||||||||||||||||||||||||||||||||||||||||||||||||||||||||||
| Share | 50.09% | 47.57% | 0.32% | 0.21% | 1.81% | 100% | |||||||||||||||||||||||||||||||||||||||||||||||||||||||||||||||||||||||||||||||||||||||||||||
| Result | 55 | 45 | 0 | 0 | 0 | 100 | |||||||||||||||||||||||||||||||||||||||||||||||||||||||||||||||||||||||||||||||||||||||||||||
Source: Office of the Clerk[1]
Gains, losses, and holds
Summarize
Perspective
Retirements
Three Republicans and three Democrats retired instead of seeking re-election.
Defeats
Seven Republicans sought re-election but lost in the general election, including one that simultaneously lost in a special election.
Post-election changes
One Democrat died on March 6, 1987, and a Republican was appointed on March 11, 1987.
| State | Senator | Replaced by |
|---|---|---|
| Nebraska (Class 1) |
Edward Zorinsky | David Karnes |
Change in composition
Before the elections
| D1 | D2 | D3 | D4 | D5 | D6 | D7 | D8 | D9 | D10 |
| D20 | D19 | D18 | D17 | D16 | D15 | D14 | D13 | D12 | D11 |
| D21 | D22 | D23 | D24 | D25 | D26 | D27 | D28 | D29 | D30 |
| D40 Hawaii Ran |
D39 Conn. Ran |
D38 Colo. Retired |
D37 Calif. Ran |
D36 Ark. Ran |
D35 | D34 | D33 | D32 | D31 |
| D41 Ill. Ran |
D42 Ky. Ran |
D43 La. Retired |
D44 Mo. Retired |
D45 Ohio Ran |
D46 S.C. Ran |
D47 Vt. Ran |
R53 Wisc. Ran |
R52 Wash. Ran |
R51 Utah Ran |
| Majority → | |||||||||
| R41 Md. Retired |
R42 Nev. Retired |
R43 N.H. Ran |
R44 N.Y. Ran |
R45 N.C. (reg) & N.C. (sp) Ran |
R46 N.D. Ran |
R47 Okla. Ran |
R48 Ore. Ran |
R49 Pa. Ran |
R50 S.D. Ran |
| R40 Kan. Ran |
R39 Iowa Ran |
R38 Ind. Ran |
R37 Idaho Ran |
R36 Ga. Ran |
R35 Fla. Ran |
R34 Ariz. Retired |
R33 Alaska Ran |
R32 Ala. Ran |
R31 |
| R21 | R22 | R23 | R24 | R25 | R26 | R27 | R28 | R29 | R30 |
| R20 | R19 | R18 | R17 | R16 | R15 | R14 | R13 | R12 | R11 |
| R1 | R2 | R3 | R4 | R5 | R6 | R7 | R8 | R9 | R10 |
After the elections
| D1 | D2 | D3 | D4 | D5 | D6 | D7 | D8 | D9 | D10 |
| D20 | D19 | D18 | D17 | D16 | D15 | D14 | D13 | D12 | D11 |
| D21 | D22 | D23 | D24 | D25 | D26 | D27 | D28 | D29 | D30 |
| D40 Hawaii Re-elected |
D39 Conn. Re-elected |
D38 Colo. Hold |
D37 Calif. Re-elected |
D36 Ark. Re-elected |
D35 | D34 | D33 | D32 | D31 |
| D41 Ill. Re-elected |
D42 Ky. Re-elected |
D43 La. Hold |
D44 Ohio Re-elected |
D45 S.C. Re-elected |
D46 Vt. Re-elected |
D47 Ala. Gain |
D48 Fla. Gain |
D49 Ga. Gain |
D50 Md. Gain |
| Majority → | D51 Nev. Gain | ||||||||
| R41 Ore. Re-elected |
R42 Pa. Re-elected |
R43 Utah Re-elected |
R44 Wisc. Re-elected |
R45 Mo. Gain |
D55 Wash. Gain |
D54 S.D. Gain |
D53 N.D. Gain |
D52 N.C. (reg) & N.C. (sp) Gain[b] | |
| R40 Okla. Re-elected |
R39 N.Y. Re-elected |
R38 N.H. Re-elected |
R37 Kan. Re-elected |
R36 Iowa Re-elected |
R35 Ind. Re-elected |
R34 Idaho Re-elected |
R33 Ariz. Hold |
R32 Alaska Re-elected |
R31 |
| R21 | R22 | R23 | R24 | R25 | R26 | R27 | R28 | R29 | R30 |
| R20 | R19 | R18 | R17 | R16 | R15 | R14 | R13 | R12 | R11 |
| R1 | R2 | R3 | R4 | R5 | R6 | R7 | R8 | R9 | R10 |
Beginning of the first session
| D1 | D2 | D3 | D4 | D5 | D6 | D7 | D8 | D9 | D10 |
| D20 | D19 | D18 | D17 | D16 | D15 | D14 | D13 | D12 | D11 |
| D21 | D22 | D23 | D24 | D25 | D26 | D27 | D28 | D29 | D30 |
| D40 | D39 | D38 | D37 | D36 | D35 | D34 | D33 | D32 | D31 |
| D41 | D42 | D43 | D44 | D45 | D46 | D47 | D48 | D49 | D50 |
| Majority → | D51 | ||||||||
| R41 | R42 | R43 | R44 | R45 | R46 Neb. Gain |
D54 | D53 | D52 | |
| R40 | R39 | R38 | R37 | R36 | R35 | R34 | R33 | R32 | R31 |
| R21 | R22 | R23 | R24 | R25 | R26 | R27 | R28 | R29 | R30 |
| R20 | R19 | R18 | R17 | R16 | R15 | R14 | R13 | R12 | R11 |
| R1 | R2 | R3 | R4 | R5 | R6 | R7 | R8 | R9 | R10 |
| Key |
|
|---|
Race summary
Summarize
Perspective
Special election
In this special election, the winner was seated during 1986.
| State | Incumbent | Result | Candidates | ||
|---|---|---|---|---|---|
| Senator | Party | Electoral history | |||
| North Carolina (Class 3) |
Jim Broyhill | Republican | 1986 (appointed) | Interim appointee lost election to finish term. New senator elected November 8, 1986. Democratic gain. Winner also elected to the next term; see below. |
|
Elections leading to the next Congress
In these general elections, the winners were elected for the term beginning January 3, 1987; ordered by state.
All of the elections involved the Class 3 seats.
| State | Incumbent | Result | Candidates | ||
|---|---|---|---|---|---|
| Senator | Party | Electoral history | |||
| Alabama | Jeremiah Denton | Republican | 1980 | Incumbent lost re-election. Democratic gain. |
|
| Alaska | Frank Murkowski | Republican | 1980 | Incumbent re-elected. |
|
| Arizona | Barry Goldwater | Republican | 1952 1958 1964 (retired) 1968 1974 1980 |
Incumbent retired. Republican hold. |
|
| Arkansas | Dale Bumpers | Democratic | 1974 1980 |
Incumbent re-elected. |
|
| California | Alan Cranston | Democratic | 1968 1974 1980 |
Incumbent re-elected. |
Others
|
| Colorado | Gary Hart | Democratic | 1974 1980 |
Incumbent retired. Democratic hold. |
Others
|
| Connecticut | Chris Dodd | Democratic | 1980 | Incumbent re-elected. |
|
| Florida | Paula Hawkins | Republican | 1980 | Incumbent lost re-election. Democratic gain. |
|
| Georgia | Mack Mattingly | Republican | 1980 | Incumbent lost re-election. Democratic gain. |
|
| Hawaii | Daniel Inouye | Democratic | 1962 1968 1974 1980 |
Incumbent re-elected. |
|
| Idaho | Steve Symms | Republican | 1980 | Incumbent re-elected. |
|
| Illinois | Alan J. Dixon | Democratic | 1980 | Incumbent re-elected. |
|
| Indiana | Dan Quayle | Republican | 1980 | Incumbent re-elected. |
|
| Iowa | Chuck Grassley | Republican | 1980 | Incumbent re-elected. |
|
| Kansas | Bob Dole | Republican | 1968 1974 1980 |
Incumbent re-elected. |
|
| Kentucky | Wendell Ford | Democratic | 1974 1980 |
Incumbent re-elected. |
|
| Louisiana | Russell B. Long | Democratic | 1948 (special) 1950 1956 1962 1968 1974 1980 |
Incumbent retired. Democratic hold. |
|
| Maryland | Charles Mathias | Republican | 1968 1974 1980 |
Incumbent retired. Democratic gain. |
|
| Missouri | Thomas Eagleton | Democratic | 1968 1974 1980 |
Incumbent retired. Republican gain. |
|
| Nevada | Paul Laxalt | Republican | 1974 1980 |
Incumbent retired. Democratic gain. |
|
| New Hampshire | Warren Rudman | Republican | 1980 | Incumbent re-elected. |
|
| New York | Al D'Amato | Republican | 1980 | Incumbent re-elected. |
Others
|
| North Carolina | Jim Broyhill | Republican | 1986 (appointed) | Interim appointee lost election. Democratic gain. Winner was also elected to finish the current term; see above. |
|
| North Dakota | Mark Andrews | Republican | 1980 | Incumbent lost re-election. Democratic-NPL gain. |
|
| Ohio | John Glenn | Democratic | 1974 1974 (appointed) 1980 |
Incumbent re-elected. |
|
| Oklahoma | Don Nickles | Republican | 1980 | Incumbent re-elected. |
|
| Oregon | Bob Packwood | Republican | 1968 1974 1980 |
Incumbent re-elected. |
|
| Pennsylvania | Arlen Specter | Republican | 1980 | Incumbent re-elected. |
|
| South Carolina | Fritz Hollings | Democratic | 1966 (special) 1968 1974 1980 |
Incumbent re-elected. |
|
| South Dakota | James Abdnor | Republican | 1980 | Incumbent lost re-election. Democratic gain. |
|
| Utah | Jake Garn | Republican | 1974 1980 |
Incumbent re-elected. |
Others
|
| Vermont | Patrick Leahy | Democratic | 1974 1980 |
Incumbent re-elected. |
|
| Washington | Slade Gorton | Republican | 1980 | Incumbent lost re-election. Democratic gain. |
|
| Wisconsin | Bob Kasten | Republican | 1980 | Incumbent re-elected. |
|
Closest races
Summarize
Perspective
In sixteen races the margin of victory was under 10%.
| State | Party of winner | Margin |
|---|---|---|
| Alabama | Democratic (flip) | 0.56% |
| North Dakota | Democratic (flip) | 0.73% |
| California | Democratic | 1.42% |
| Colorado | Democratic | 1.55% |
| North Carolina (special) | Democratic (flip) | 1.76% |
| Georgia | Democratic (flip) | 1.83% [c] |
| Washington | Democratic (flip) | 1.99% |
| Idaho | Republican | 3.11% |
| South Dakota | Democratic (flip) | 3.21% |
| North Carolina (regular) | Democratic (flip) | 3.54% |
| Wisconsin | Republican | 3.54% |
| Missouri | Republican (flip) | 5.28% |
| Nevada | Democratic (flip) | 5.48% |
| Louisiana | Democratic | 5.64% |
| Florida | Democratic (flip) | 9.48% |
| Alaska | Republican | 9.93% |
Alabama
Summarize
Perspective
| |||||||||||||||||
 County results Shelby: 50–60% 60–70% 70–80% 80–90% Denton: 50–60% 60–70% 70–80% | |||||||||||||||||
| |||||||||||||||||


Incumbent Republican Jeremiah Denton ran for a second term but lost to Democrat Richard Shelby.
Shelby, a moderate-to-conservative Democrat avoided a primary runoff and won nomination in the Democratic Party primary over Jim Allen Jr., son of former senator James Allen.[2]
| Party | Candidate | Votes | % | |
|---|---|---|---|---|
| Democratic | Richard Shelby | 420,155 | 51.33% | |
| Democratic | Jim Allen Jr. | 284,206 | 34.72% | |
| Democratic | Ted McLaughlin | 70,784 | 8.65% | |
| Democratic | Margaret Stewart | 26,723 | 3.27% | |
| Democratic | Steve Arnold | 16,722 | 2.04% | |
| Total votes | 818,590 | 100.00% | ||
Incumbent Senator Jeremiah Denton, a retired Rear Admiral and decorated Vietnam War veteran who six years earlier became the first Republican elected to the Senate from Alabama since Reconstruction, won the Republican primary with little opposition from Richard Vickers.[3]
| Party | Candidate | Votes | % | |
|---|---|---|---|---|
| Republican | Jeremiah Denton | 29,805 | 88.55% | |
| Republican | Richard Vickers | 3,854 | 11.45% | |
| Total votes | 33,659 | 100.00% | ||
Shelby won a very narrow victory over Denton (less than one percent), once again making Alabama's Senate delegation entirely Democratic.[4][5]
| Party | Candidate | Votes | % | ±% | |
|---|---|---|---|---|---|
| Democratic | Richard Shelby | 609,360 | 50.28% | ||
| Republican | Jeremiah Denton (Incumbent) | 602,537 | 49.72% | ||
| Majority | 6,823 | 0.56% | |||
| Turnout | 1,211,897 | ||||
| Democratic gain from Republican | Swing | ||||
Alaska
Summarize
Perspective
| |||||||||||||||||
 Results by state house district Murkowski: 40–50% 50–60% 60–70% Olds: 40–50% 50–60% | |||||||||||||||||
| |||||||||||||||||

.jpg)
Incumbent Republican Frank Murkowski ran for a second term and was primarily opposed by Democrat and Alaska Pacific University President Glenn Olds and Libertarian Chuck House, field representative for Eastman Kodak Company. Following a highly competitive election in 1980, Murkowski faced a legitimate opponent in Olds, and the contest was fairly close throughout the campaign. However, in the end, Murkowski was able to defeat Olds 63%-25% in the open primary. He won 54%-44% against Olds in the runoff.[5]
| Party | Candidate | Votes | % | |
|---|---|---|---|---|
| Republican | Frank Murkowski (inc.) | 91,705 | 63.11% | |
| Democratic | Glenn Olds | 36,995 | 25.46% | |
| Democratic | Bill Barnes | 4,871 | 3.35% | |
| Libertarian | Chuck House | 4,265 | 2.94% | |
| Democratic | Dave J. Carlson | 4,211 | 2.90% | |
| Democratic | Michael J. Bruner | 1,809 | 1.24% | |
| Democratic | Karl Francis | 1,454 | 1.00% | |
| Total votes | 145,310 | 100.00% | ||
| Party | Candidate | Votes | % | ±% | |
|---|---|---|---|---|---|
| Republican | Frank Murkowski (Incumbent) | 97,674 | 54.02% | +0.34% | |
| Democratic | Glenn Olds | 79,727 | 44.10% | −1.84% | |
| Libertarian | Chuck House | 3,161 | 1.75% | ||
| Write-ins | 239 | 0.13% | |||
| Majority | 17,947 | 9.93% | +2.17% | ||
| Turnout | 180,801 | 100.0 | |||
| Republican hold | Swing | ||||
Arizona
Summarize
Perspective
| |||||||||||||||||
 County results McCain: 50–60% 60-70% Kimball: 50–60% | |||||||||||||||||
| |||||||||||||||||


Incumbent Republican Barry Goldwater decided to retire instead of seeking a sixth term. The open seat was won by Republican John McCain, a Congressman and former Navy Officer who beat Democratic State Legislator Richard Kimball. Both candidates were unopposed in their respective primaries.
Kimball's campaign was subject to negative press from the Arizona Republic and Phoenix Gazette. One Gazette columnist described him as displaying "terminal weirdness."[7] McCain ultimately won the election by a margin of 20%,[5] and he would go on to win six more terms to the U.S. Senate.[1]
| Party | Candidate | Votes | % | ±% | |
|---|---|---|---|---|---|
| Republican | John McCain | 521,850 | 60.47% | +11.02% | |
| Democratic | Richard Kimball | 340,965 | 39.51% | −8.87% | |
| Write-ins | 106 | 0.01% | |||
| Majority | 180,885 | 20.96% | +19.89% | ||
| Turnout | 862,921 | ||||
| Republican hold | Swing | ||||
Arkansas
Summarize
Perspective
| |||||||||||||||||
 County results
Bumpers: 50–60% 60–70% 70–80% 80–90% | |||||||||||||||||
| |||||||||||||||||


Incumbent Democrat Dale Bumpers won re-election to a third term over Republican U.S. Attorney Asa Hutchinson. Both ran unopposed in their respective primaries.[5]
| Party | Candidate | Votes | % | |
|---|---|---|---|---|
| Democratic | Dale Bumpers (Incumbent) | 433,122 | 62.3% | |
| Republican | Asa Hutchinson | 262,313 | 37.7% | |
| Independent | Ralph Forbes | 52 | 0.1% | |
| Majority | 170,809 | 24.6% | ||
| Turnout | 695,487 | |||
| Democratic hold | ||||
California
Summarize
Perspective
| |||||||||||||||||
 County results Cranston: 40-50% 50–60% 60–70% 70–80% Zschau: 40–50% 50–60% 60–70% | |||||||||||||||||
| |||||||||||||||||


Incumbent Democratic Alan Cranston won re-nomination over nominal Democratic opposition. Congressman Ed Zschau narrowly defeated Bruce Herschensohn in the Republican primary to secure the nomination. Cranston narrowly won re-election to a fourth term over Zschau, 49%-48%.[5]
| Party | Candidate | Votes | % | |
|---|---|---|---|---|
| Democratic | Alan Cranston (Incumbent) | 3,646,672 | 49.3% | |
| Republican | Ed Zschau | 3,541,804 | 47.9% | |
| American Independent | Edward B Vallen | 109,916 | 1.5% | |
| Libertarian | Breck McKinley | 66,261 | 0.9% | |
| Peace and Freedom | Paul Kangas | 33,869 | 0.5% | |
| Majority | 104,868 | 1.4% | ||
| Turnout | 7,398,522 | |||
| Democratic hold | ||||
Colorado
Summarize
Perspective
| |||||||||||||||||
 County results Wirth: 40–50% 50–60% 60–70% | |||||||||||||||||
| |||||||||||||||||
.jpg)

Incumbent Democrat Gary Hart retired instead of seeking a third term. Democratic nominee Tim Wirth and Republican Ken Kramer ran unopposed for the seat. In an ultimately very close election, Wirth defeated Kramer by just under 2%. Wirth would retire and opt not to seek a second term.[5]
| Party | Candidate | Votes | % | ±% | |
|---|---|---|---|---|---|
| Democratic | Tim Wirth | 529,449 | 49.91% | −0.42% | |
| Republican | Ken Kramer | 512,994 | 48.36% | −0.34% | |
| Independent | Michael Martin Bush | 11,127 | 1.05% | ||
| Socialist Workers | Michael R. Chamberlain | 3,756 | 0.35% | ||
| Independent American | Henry John Olshaw | 1,868 | 0.18% | −0.17% | |
| Prohibition | Calvin G. Dodge | 1,571 | 0.15% | ||
| Majority | 16,455 | 1.55% | −0.09% | ||
| Turnout | 1,060,765 | ||||
| Democratic hold | Swing | ||||
Connecticut
Summarize
Perspective
| |||||||||||||||||


Dodd: 50–60% 60–70% 70–80% 80–90% Eddy: 50–60% 60–70% | |||||||||||||||||
| |||||||||||||||||


Incumbent Democrat Chris Dodd received the Democratic nomination with no opposition. Republican Roger Eddy of the Republican National Committee won the Republican nomination. Dodd handily defeated Eddy, 65%-35%.[10][5]
| Party | Candidate | Votes | % | |
|---|---|---|---|---|
| Democratic | Chris Dodd (Incumbent) | 632,695 | 64.8% | |
| Republican | Roger Eddy | 340,438 | 34.9% | |
| Independent | Edward J. McCallum Jr. | 3,800 | 0.4% | |
| Majority | 292,257 | 29.9% | ||
| Turnout | 976,933 | |||
| Democratic hold | ||||
Florida
Summarize
Perspective
| |||||||||||||||||
 County results Graham: 50–60% 60–70% Hawkins: 50–60% 60–70% | |||||||||||||||||
| |||||||||||||||||


Incumbent Republican Paula Hawkins won renomination with nominal opposition, but so did her Democratic opponent, popular Governor of Florida Bob Graham. Graham defeated Hawkins by nearly 9% on election day.[1][5]
| Party | Candidate | Votes | % | |
|---|---|---|---|---|
| Democratic | Bob Graham | 850,560 | 85.04% | |
| Democratic | Bob Kunst | 149,657 | 14.96% | |
| Total votes | 1,000,217 | 100.00% | ||
| Party | Candidate | Votes | % | |
|---|---|---|---|---|
| Republican | Paula Hawkins (Incumbent) | 491,767 | 88.73% | |
| Republican | Jon Larsen Shudlick | 62,443 | 11.27% | |
| Total votes | 554,210 | 100.00% | ||
| Party | Candidate | Votes | % | ±% | |
|---|---|---|---|---|---|
| Democratic | Bob Graham | 1,877,543 | 54.74% | +6.40% | |
| Republican | Paula Hawkins (Incumbent) | 1,552,376 | 45.26% | −6.40% | |
| Write-ins | 77 | 0.00% | |||
| Majority | 325,167 | 9.48% | +6.16% | ||
| Turnout | 3,429,996 | ||||
| Democratic gain from Republican | Swing | ||||
Georgia
Summarize
Perspective
| |||||||||||||||||
 County results Fowler: 50–60% 60–70% 70–80% Mattingly: 50–60% 60–70% | |||||||||||||||||
| |||||||||||||||||


Incumbent Republican Mack Mattingly decided to run for re-election and lost a close race to Democratic U.S. Congressman Wyche Fowler, who had defeated former White House Chief of Staff Hamilton Jordan in the Democratic primary.[1][5] Fowler would lose re-election in 1992.
| Party | Candidate | Votes | % | ±% | |
|---|---|---|---|---|---|
| Democratic | Wyche Fowler | 623,707 | 50.91% | +1.78% | |
| Republican | Mack Mattingly (Incumbent) | 601,241 | 49.08% | −1.79% | |
| Write-In Votes | 60 | 0.00% | N/A | ||
| Majority | 22,466 | 1.83% | +.09% | ||
| Turnout | 1,225,008 | ||||
| Democratic gain from Republican | Swing | 1.78% | |||
Hawaii
Summarize
Perspective
| |||||||||||||||||
 County results Inouye: 70–80% 80–90% | |||||||||||||||||
| |||||||||||||||||


Incumbent Democratic Daniel Inouye won re-election to a fifth term, 74%-26%, over Republican Frank Hutchinson, who had defeated Marvin Franklin in the Republican primary.[5]
| Party | Candidate | Votes | % | ±% | |
|---|---|---|---|---|---|
| Democratic | Daniel Inouye (Incumbent) | 241,887 | 73.57% | ||
| Republican | Frank Hutchinson | 86,910 | 26.43% | ||
| Majority | 154,977 | 47.14% | |||
| Turnout | 328,797 | ||||
| Democratic hold | Swing | ||||
Idaho
Summarize
Perspective
| |||||||||||||||||
 County results Symms: 50–60% 60–70% 70–80% Evans: 50–60% 60–70% | |||||||||||||||||
| |||||||||||||||||

.jpg)
Incumbent Republican Steve Symms won re-election to a second term over Democratic Governor John V. Evans. Evans was a popular governor, and the race was ultimately close, but Symms prevailed by just over 2%.[5]
| Party | Candidate | Votes | % | ±% | |
|---|---|---|---|---|---|
| Republican | Steve Symms (Incumbent) | 196,958 | 51.56% | +1.81% | |
| Democratic | John V. Evans | 185,066 | 48.44% | −0.33% | |
| Majority | 11,892 | 3.11% | +2.14% | ||
| Turnout | 382,024 | ||||
| Republican hold | Swing | ||||
Illinois
Summarize
Perspective
| |||||||||||||||||
 County results Dixon: 40–50% 50–60% 60–70% 70–80% Koehler: 40–50% 50–60% 60–70% | |||||||||||||||||
| |||||||||||||||||
.jpg)

The incumbent Democratic Alan J. Dixon won re-election to a second term over Republican State Representative Judy Koehler, who won the Republican nomination over George Ranney.[5] This was also the last time until 2022 that a winning Senate Candidate was elected to this seat twice.
Dixon easily won the senate race. Koehler fared poorly throughout most parts of the state, only winning 10 of the states 102 counties.
| Party | Candidate | Votes | % | ±% | |
|---|---|---|---|---|---|
| Democratic | Alan J. Dixon (Incumbent) | 2,033,783 | 65.1% | +9.1% | |
| Republican | Judy Koehler | 1,053,734 | 33.7% | −8.8% | |
| Independent | Einar V. Dyhrkopp | 15,804 | 0.5% | ||
| Libertarian | Don Parrish | 13,891 | 0.5% | ||
| Socialist Workers | Omari Musa | 5,671 | 0.2% | ||
| Majority | 980,049 | 31.4% | |||
| Turnout | 3,122,883 | ||||
| Democratic hold | Swing | ||||
Indiana
Summarize
Perspective
| |||||||||||||||||
 County results Quayle: 50-60% 60-70% 70-80% Long: 50–60% | |||||||||||||||||
| |||||||||||||||||


Incumbent Republican Dan Quayle won re-election to a second term over Democratic Valparaiso City Councilwoman Jill L. Long.[15][5]
| Party | Candidate | Votes | % | |
|---|---|---|---|---|
| Republican | Dan Quayle (Incumbent) | 936,143 | 60.57% | |
| Democratic | Jill L. Long | 595,192 | 38.51% | |
| Libertarian | Bradford Warren | 8,314 | 0.54% | |
| American | Rockland Snyder | 5,914 | 0.38% | |
| Majority | 340,951 | 22.06% | ||
| Turnout | 1,545,563 | |||
| Republican hold | ||||
Iowa
Summarize
Perspective
| |||||||||||||||||
 County results Grassley: 50-60% 60-70% 70-80% 80–90% Roehrick: 40–50% | |||||||||||||||||
| |||||||||||||||||

Incumbent Republican Chuck Grassley ran for re-election to a second term, which he won easily over Democratic nominee John P. Roehrick, an attorney.[5]
| Party | Candidate | Votes | % | |
|---|---|---|---|---|
| Democratic | John P. Roehrick | 88,347 | 83.83% | |
| Democratic | Juan Cortez | 16,987 | 16.12% | |
| Democratic | Write-ins | 60 | 0.06% | |
| Total votes | 105,394 | 100.00% | ||
| Party | Candidate | Votes | % | |
|---|---|---|---|---|
| Republican | Chuck Grassley (Incumbent) | 108,370 | 99.96% | |
| Republican | Write-ins | 38 | 0.04% | |
| Total votes | 108,408 | 100.00% | ||
| Party | Candidate | Votes | % | ±% | |
|---|---|---|---|---|---|
| Republican | Chuck Grassley (Incumbent) | 588,880 | 66.04% | +12.55% | |
| Democratic | John P. Roehrick | 299,406 | 33.57% | −11.97% | |
| Independent | John Masters | 3,370 | 0.38% | ||
| Write-ins | 106 | 0.01% | |||
| Majority | 289,474 | 32.46% | +24.51% | ||
| Turnout | 891,762 | ||||
| Republican hold | Swing | ||||
Kansas
Summarize
Perspective
| |||||||||||||||||
 County Results Dole: 50–60% 60–70% 70–80% | |||||||||||||||||
| |||||||||||||||||
.jpg)
Incumbent Republican Bob Dole ran for re-election to a fourth term, which he won easily over Democratic nominee Guy MacDonald, a school teacher, who had narrowly prevailed in a crowded field of Democratic candidates.[5]
| Party | Candidate | Votes | % | ±% | |
|---|---|---|---|---|---|
| Republican | Bob Dole (Incumbent) | 576,902 | 70.05% | ||
| Democratic | Guy MacDonald | 246,664 | 29.95% | ||
| Majority | 330,238 | 40.10% | |||
| Turnout | 823,566 | ||||
| Republican hold | Swing | ||||
Kentucky
Summarize
Perspective
| |||||||||||||||||
 Country results Ford: 50–60% 60–70% 70–80% 80–90% >90% | |||||||||||||||||
| |||||||||||||||||

Democrat Wendell Ford won re-election, He defeated Republican Jackson Andrews, who emerged from a competitive primary.[5]
| Party | Candidate | Votes | % | |
|---|---|---|---|---|
| Democratic | Wendell Ford (incumbent) | 503,775 | 74.40% | |
| Republican | Jackson Andrews | 173,330 | 25.60% | |
| Democratic hold | ||||
Louisiana
Summarize
Perspective
| |||||||||||||||||
 Parish Results Breaux: 50–60% 60–70% 70–80% Moore: 50–60% 60–70% | |||||||||||||||||
| |||||||||||||||||


Incumbent Democratic Russell B. Long decided to retire instead of seeking an eighth term. The open seat was won by Democrat U.S. Representative John Breaux, who beat Republican U.S. Representative Henson Moore by just over 5% after the two finished second and first in the open primary, respectively.[5]
| Party | Candidate | Votes | % | ±% | |
|---|---|---|---|---|---|
| Democratic | John Breaux | 723,586 | 52.82% | ||
| Republican | W. Henson Moore | 646,311 | 47.18% | ||
| Majority | 77,275 | 5.64% | |||
| Turnout | 1,369,897 | ||||
| Democratic hold | Swing | ||||
Maryland
Summarize
Perspective
| |||||||||||||||||
 County results Mikulski: 50–60% 60–70% 80–90% Chavez: 50–60% 60–70% | |||||||||||||||||
| |||||||||||||||||


Incumbent Republican Charles Mathias decided to retire, instead of seeking a fourth term. At the time of this announcement, it was expected that then-Governor Harry Hughes would run for the seat being vacated by retiring Senator Mathias. However, Hughes became caught up in the aftermath of the Maryland savings and loan crisis. He lost popularity with voters, opening the door for Mikulski's bid for the Senate. Congresswoman Barbara Mikulski received the Democratic nomination over fellow Congressman Michael D. Barnes and governor Harry Hughes, the last of whom finished third. Mikulski had previously run for the seat in 1974.
Chavez won the primary handily, defeating several Republican challengers. Later, she made comments that some Mikulski supporters interpreted as an attempt to draw attention to the issue of Mikulski's sexual orientation. In an article quoting Chavez's claim that Mikulski was a "San Francisco-style, George McGovern, liberal Democrat", The Washington Post reported that Chavez was directly implying that the never-married Mikulski was a lesbian.[citation needed] Chavez was accused of making Mikulski's sexual orientation a central issue of the political campaign. In defending her use of the phrase, Chavez stated the line "San Francisco Democrats" was a reference to Jeane Kirkpatrick's 1984 Republican National Convention "Blame America First" speech, in which Kirkpatrick coined the phrase "San Francisco Liberal."[citation needed]. The phrase "San Francisco liberal" was common at the time.
Mikulski eventually won the race with 61 percent of the vote.[5] She was the first female Democrat elected to the U.S. Senate in her own right (not appointed or filling a seat of a deceased husband). No Republican since Mathias has represented Maryland in the U.S. Senate.
| Party | Candidate | Votes | % | |
|---|---|---|---|---|
| Democratic | Barbara A. Mikulski | 307,876 | 49.50% | |
| Democratic | Michael D. Barnes | 195,086 | 31.37% | |
| Democratic | Harry Hughes | 88,908 | 14.30% | |
| Democratic | Debra Hanania Freeman | 9,350 | 1.50% | |
| Democratic | Edward M. Olszewski | 7,877 | 1.27% | |
| Democratic | A. Robert Kaufman | 6,505 | 1.05% | |
| Democratic | Boyd E. Sweatt | 3,580 | 0.58% | |
| Democratic | Leonard E. Trout Jr. | 2,742 | 0.44% | |
| Total votes | 621,924 | 100.00% | ||
| Party | Candidate | Votes | % | |
|---|---|---|---|---|
| Republican | Linda Chavez | 100,888 | 73.07% | |
| Republican | Michael Schaefer | 16,902 | 12.24% | |
| Republican | George Haley | 5,808 | 4.21% | |
| Republican | Melvin Perkins | 2,785 | 2.02% | |
| Republican | Nicholas T. Nonnenmacher | 2,751 | 1.99% | |
| Republican | Richard Sullivan | 2,328 | 1.69% | |
| Republican | Howard D. Greyber | 1,678 | 1.22% | |
| Republican | Monroe Cornish | 1,497 | 1.08% | |
| Republican | Herbert Stone Rosenberg | 1,337 | 0.97% | |
| Republican | Horace Stuart Rich | 1,199 | 0.87% | |
| Republican | Abraham H. Kalish | 901 | 0.65% | |
| Total votes | 138,074 | 100.00% | ||
| Party | Candidate | Votes | % | ±% | |
|---|---|---|---|---|---|
| Democratic | Barbara A. Mikulski | 675,225 | 60.69% | +26.85% | |
| Republican | Linda Chavez | 437,411 | 39.31% | −26.85% | |
| Majority | 237,814 | 21.37% | −10.96% | ||
| Total votes | 1,017,151 | 100.00% | |||
| Democratic gain from Republican | Swing | ||||
Missouri
Summarize
Perspective
| |||||||||||||||||
 County results Bond: 50-60% 60-70% 70-80% Woods: 50–60% 60–70% | |||||||||||||||||
| |||||||||||||||||

.jpg)
Incumbent Democrat Tom Eagleton decided to retire instead of seeking a fourth term. Republican Governor Kit Bond won the open seat, beating Democratic Lieutenant Governor Harriett Woods.[5]
| Party | Candidate | Votes | % | |
|---|---|---|---|---|
| Republican | Kit Bond | 777,612 | 52.6% | |
| Democratic | Harriett Woods | 699,624 | 47.4% | |
| Majority | 77,988 | 5.2% | ||
| Turnout | 1,477,236 | |||
| Republican gain from Democratic | ||||
Nevada
Summarize
Perspective
| |||||||||||||||||
 County results Reid: 40–50% 60–70% Santini: 40–50% 50–60% 60–70% 70–80% | |||||||||||||||||
| |||||||||||||||||


Incumbent Republican Paul Laxalt decided to retire instead of seeking a third term. U.S. Representative Democratic nominee Harry Reid won the open seat over Republican former U.S. Representative James David Santini.[1][5] Reid had previously run for the seat in 1974.
| Party | Candidate | Votes | % | ±% | |
|---|---|---|---|---|---|
| Democratic | Harry Reid | 130,955 | 50.00% | +12.61% | |
| Republican | Jim Santini | 116,606 | 44.52% | −14.01% | |
| None of These Candidates | 9,472 | 3.62% | +2.33% | ||
| Libertarian | Kent Cromwell | 4,899 | 1.87% | −0.94% | |
| Majority | 14,349 | 5.48% | −15.66% | ||
| Turnout | 261,932 | ||||
| Democratic gain from Republican | Swing | ||||
New Hampshire
Summarize
Perspective
| |||||||||||||||||


Rudman: 40–50% 50–60% 60–70% 70–80% 80–90% Peabody: 40–50% 50–60% >90% | |||||||||||||||||
| |||||||||||||||||


Incumbent Republican Warren Rudman won re-election to a second term, beating the Democratic former Governor of Massachusetts Endicott Peabody.[5]
| Party | Candidate | Votes | % | |
|---|---|---|---|---|
| Republican | Warren Rudman (Incumbent) | 154,090 | 63.0% | |
| Democratic | Endicott Peabody | 79,222 | 32.4% | |
| Independent | Bruce Valley | 11,423 | 4.7% | |
| Majority | 74,868 | 30.6% | ||
| Turnout | 244,735 | |||
| Republican hold | ||||
New York
Summarize
Perspective
| |||||||||||||||||
 County results D'Amato: 40–50% 50–60% 60–70% 70–80% Green: 40–50% 50–60% 60–70% | |||||||||||||||||
| |||||||||||||||||

.jpg)
Incumbent Republican Al D'Amato won re-election to a second term over Democrat Mark Green, the Chief Speechwriter for U.S. Senator Gary Hart and former congressional candidate.[5] Green had won a contested primary over the more moderate John S. Dyson. D'Amato won most counties in the state, losing just 5 counties. This was D'Amato's largest margin of victory during his Senate career.
| Party | Candidate | Votes | % | |
|---|---|---|---|---|
| Republican | Al D'Amato (Incumbent) | 2,030,260 | ||
| Conservative | Al D'Amato | 212,101 | ||
| Right to Life | Al D'Amato | 135,386 | ||
| total | Al D'Amato | 2,378,197 | 56.9% | |
| Democratic | Mark Green | 1,723,216 | 41.2% | |
| Liberal | John S. Dyson | 60,099 | 1.4% | |
| New Alliance | Fred Newman | 10,559 | 0.3% | |
| Socialist Workers | Michael Shur | 7,376 | 0.2% | |
| Others | 305,412 | |||
| Majority | 654,981 | 15.7% | ||
| Turnout | 4,179,447 | |||
| Republican hold | ||||
North Carolina
Summarize
Perspective
There were two elections in North Carolina.
Incumbent Republican Jim Broyhill, who had been appointed in June 1986 to serve out the rest of John Porter East's term, faced off against the popular Democratic former Governor Terry Sanford. There were two separate elections held on the same day: a special election for what little remained of the 99th United States Congress (November 1986 – January 1987) and a regular election for a new six-year term (beginning in January 1987).[20] Sanford won both elections.
The primary elections would nominate candidates to the special and the regular election.
North Carolina (regular)
| |||||||||||||||||
 County results Sanford: 50–60% 60–70% 70–80% Broyhill: 50–60% 60–70% 70–80% | |||||||||||||||||
| |||||||||||||||||

.jpg)
Terry Sanford, then the outgoing president of Duke University, first said in September 1985 that he was planning to run for the U.S. Senate the next year but quickly withdrew, as it appeared that the party wanted a "fresh" face, most likely in the person of UNC System President William Friday.[21] Then, Friday declined to run, as did other well-known politicians like former Gov. Jim Hunt.[22] Former North Carolina Secretary of Commerce Lauch Faircloth then made it known that he would run, but he was considered too conservative by many party leaders, who encouraged Sanford to enter the race in order to defeat Faircloth.[21] Sanford agreed to run, which led Faircloth and another candidate, Judge Marvin K. Blount Jr., to withdraw before filing their candidacies. Six years later, Faircloth did run for the Senate against Sanford, but this time as a Republican.
Sen. East declined to run for a second term, citing his health. Longtime U.S. Representative Jim Broyhill entered the race with much of the establishment support, but David Funderburk had the backing of the organization of Senator Jesse Helms.[22] Funderburk charged Broyhill with being insufficiently conservative, but in the end, Broyhill won the nomination handily in the May primary. The next month, Sen. East committed suicide, and Gov. James G. Martin appointed Broyhill to his seat.
Sanford narrowly defeated incumbent Broyhill on both election ballots, though he received a slightly smaller margin of victory to finish the remainder of East's term due to a lower turnout.[5]
| Party | Candidate | Votes | % | |
|---|---|---|---|---|
| Democratic | Terry Sanford | 409,394 | 60.25% | |
| Democratic | John Ingram | 111,557 | 16.42% | |
| Democratic | Fountain Odom | 49,689 | 7.31% | |
| Democratic | William Belk | 33,821 | 4.98% | |
| Democratic | Theodore Kinney | 27,228 | 4.01% | |
| Democratic | Betty Wallace | 17,001 | 2.50% | |
| Democratic | Katherine Harper | 12,998 | 1.91% | |
| Democratic | Walt Atkins | 8,306 | 1.22% | |
| Democratic | Others | 9,493 | 1.40% | |
| Turnout | 679,487 | |||
| Party | Candidate | Votes | % | |
|---|---|---|---|---|
| Republican | Jim Broyhill (incumbent) | 139,570 | 66.52% | |
| Republican | David Funderburk | 63,593 | 30.31% | |
| Republican | Frazier Glenn Miller Jr. | 6,662 | 3.18% | |
| Turnout | 148,574 | |||
| Party | Candidate | Votes | % | ±% | |
|---|---|---|---|---|---|
| Democratic | Terry Sanford | 823,662 | 51.76% | +2.38% | |
| Republican | Jim Broyhill (Incumbent) | 767,668 | 48.24% | −1.72% | |
| Majority | 55,994 | 3.54% | |||
| Turnout | 1,591,330 | ||||
| Democratic gain from Republican | Swing | ||||
North Carolina (special)
| |||||||||||||||||
 County results Sanford: 50–60% 60–70% 70–80% Broyhill: 50–60% 60–70% 70–80% | |||||||||||||||||
| |||||||||||||||||

This was a special election for what little remained of the 99th United States Congress (November 1986 – January 1987), being held contemporaneously with a regular election for a new six-year term (beginning in January 1987).[20][5]
| Party | Candidate | Votes | % | |
|---|---|---|---|---|
| Democratic | Terry Sanford | 780,967 | 50.88% | |
| Republican | Jim Broyhill (Incumbent) | 753,881 | 49.12% | |
| Majority | 27,086 | 1.76% | ||
| Turnout | 1,534,875 | |||
| Democratic gain from Republican | ||||
North Dakota
Summarize
Perspective
| |||||||||||||||||
 County results Conrad: 40–50% 50–60% 60–70% Andrews: 40–50% 50–60% | |||||||||||||||||
| |||||||||||||||||


Incumbent Republican U.S. Senator Mark Andrews lost re-election to a second term to Dem-NPL nominee Kent Conrad, State Tax Commissioner. Andrews lost re-election by just over 2,000[1][5] votes after a rigorous campaign involving personal attacks.[27]
| Party | Candidate | Votes | % | |
|---|---|---|---|---|
| Democratic | Kent Conrad | 143,932 | 49.80% | |
| Republican | Mark Andrews (Incumbent) | 141,812 | 49.07% | |
| Independent | Anna B. Bourgois | 3,269 | 1.13% | |
| Majority | ||||
| Turnout | 289,013 | |||
| Democratic gain from Republican | ||||
Ohio
Summarize
Perspective
| |||||||||||||||||
 County results Glenn: 50–60% 60–70% 70–80% Kindness: 50–60% 60–70% | |||||||||||||||||
| |||||||||||||||||


Incumbent Democratic U.S. Senator John Glenn won re-election to a third term over Republican U.S. Congressman Tom Kindness.[5]
| Party | Candidate | Votes | % | |
|---|---|---|---|---|
| Democratic | John Glenn (Incumbent) | 1,949,208 | 62.5% | |
| Republican | Tom Kindness | 1,171,893 | 37.6% | |
| Independent | Kathleen M. Button | 59 | 0.0% | |
| Independent | William M. Harris | 29 | 0.0% | |
| Majority | 777,315 | 24.1% | ||
| Turnout | 3,121,189 | |||
| Democratic hold | ||||
Oklahoma
Summarize
Perspective
| |||||||||||||||||
 County results Nickles: 50-60% 60-70% 70-80% Jones: 50–60% 60–70% | |||||||||||||||||
| |||||||||||||||||


Incumbent Republican Don Nickles won re-election to his second term, over Democratic U.S. Congressman James R. Jones, who defeated James Gentry in the primary.[5]
| Party | Candidate | Votes | % | |
|---|---|---|---|---|
| Republican | Don Nickles (Incumbent) | 493,436 | 55.2% | |
| Democratic | James R. Jones | 400,230 | 44.8% | |
| Majority | 93,206 | 10.4% | ||
| Turnout | 893,666 | |||
| Republican hold | ||||
Oregon
Summarize
Perspective
| |||||||||||||||||
 County results Packwood: 40-50% 50-60% 60-70% 70-80% Bauman: 50–60% 70–80% | |||||||||||||||||
| |||||||||||||||||


Incumbent Bob Packwood ran for re-election, though he faced a significant primary challenge from Joe Lutz.[30] U.S. Congressman Jim Weaver received the Democratic nomination. A populist Democratic congressman from Eugene, Oregon, he was a darling of the environmentalists. Weaver supported the Oregon Wilderness Act of 1984. Packwood was confident despite the popular opponent, because had more money and a better campaign organization.[31] After winning the party nomination, Weaver was the subject of a House Ethics Committee probe into his campaign finances, and withdrew his candidacy. Rick Bauman was selected to replace Weaver on the ballot, and lost handily to Packwood.[5]
| Party | Candidate | Votes | % | |
|---|---|---|---|---|
| Democratic | Jim Weaver | 183,334 | 61.56% | |
| Democratic | Rod Monroe | 44,553 | 14.96% | |
| Democratic | Rick Bauman | 41,939 | 14.08% | |
| Democratic | Steve Anderson | 26,130 | 8.77% | |
| Democratic | miscellaneous | 1,868 | 0.63% | |
| Total votes | 297,824 | 100.00% | ||
| Party | Candidate | Votes | % | |
|---|---|---|---|---|
| Republican | Bob Packwood (incumbent) | 171,985 | 57.62% | |
| Republican | Joe Lutz | 126,315 | 42.32% | |
| Republican | miscellaneous | 166 | 0.06% | |
| Total votes | 298,466 | 100.00% | ||
| Party | Candidate | Votes | % | |
|---|---|---|---|---|
| Republican | Bob Packwood (Incumbent) | 656,317 | 62.95% | |
| Democratic | Rick Bauman | 375,735 | 36.04% | |
| Independent | Write-in | 10,503 | 1.01% | |
| Majority | 280,582 | 26.91% | ||
| Total votes | 1,042,555 | 100.00% | ||
| Republican hold | ||||
Pennsylvania
Summarize
Perspective
| |||||||||||||||||
 County results Specter: 50–60% 60–70% 70–80% Edgar: 40–50% 50–60% | |||||||||||||||||
| |||||||||||||||||


Incumbent Republican Arlen Specter, who had been elected in 1980, ran for re-election and faced Democrat Robert W. Edgar in the general election.
Specter was viewed somewhat tepidly by the Pennsylvania electorate entering the race, although both men shared similar moderate profiles. Additionally, economic woes had dragged down the popularity of Republican candidates in the industrial states. Don Bailey, the state's incumbent Auditor General, who projected a strong blue collar image and had moderate positions that were often relatively close to Specter's, and Edgar, a Methodist minister and sitting Congressman, who had more liberal viewpoints and was with the Vietnam War-era peace movement and anti-corruption movement following the Watergate scandals, ran for the Democratic nomination.[35] However, issues played a very minor role in the primary, which instead showcased the state's geographical divide, with Delaware County-based Edgar narrowly defeating Westmoreland County-based Bailey.[36]
Specter defeated Edgar in the general election by nearly 13% of the vote.[36][5]
| Party | Candidate | Votes | % | |
|---|---|---|---|---|
| Republican | Arlen Specter (Incumbent) | 1,906,537 | 56.4% | |
| Democratic | Robert W. Edgar | 1,448,219 | 42.9% | |
| Independent | Lance S. Haver | 23,470 | 0.7% | |
| Majority | 458,318 | 13.5% | ||
| Turnout | 3,378,226 | |||
| Republican hold | ||||
South Carolina
Summarize
Perspective
| |||||||||||||||||
 County results Hollings: 50–60% 60–70% 70–80% 80–90% McMaster: 50–60% | |||||||||||||||||
| |||||||||||||||||


Popular incumbent Democratic Senator Fritz Hollings easily defeated Republican U.S. Attorney and future Governor Henry McMaster, who defeated Henry Jordan for the Republican nomination, to win his fifth (his fourth full) term.[5]
| Party | Candidate | Votes | % | ±% | |
|---|---|---|---|---|---|
| Republican | Henry McMaster | 27,695 | 53.4% | ||
| Republican | Henry Jordan | 24,164 | 46.6% | ||
The race was not seriously contested and was not a target by the Republicans. With little financial assistance, McMaster was unable to mount a credible challenge to Hollings's re-election in what became a difficult year for Republicans.
| Party | Candidate | Votes | % | ±% | |
|---|---|---|---|---|---|
| Democratic | Fritz Hollings (Incumbent) | 465,511 | 63.1% | −7.3% | |
| Republican | Henry McMaster | 262,976 | 35.6% | +6.0% | |
| Libertarian | Steven B. Vandervelde | 4,788 | 0.7% | +0.7% | |
| American | Ray Hillyard | 4,588 | 0.6% | +0.6% | |
| No party | Write-Ins | 199 | 0.0% | 0.0% | |
| Majority | 202,535 | 27.5% | −13.3% | ||
| Turnout | 738,062 | 56.6% | −13.9% | ||
| Democratic hold | Swing | ||||
South Dakota
Summarize
Perspective
| |||||||||||||||||
 County results Daschle: 50–60% 60–70% 70–80% 80–90% Abdnor: 50–60% 60–70% 70–80% | |||||||||||||||||
| |||||||||||||||||


Incumbent Republican James Abdnor ran for re-election to a second term, but was defeated by Democratic Congressman Tom Daschle.[37][5]
Daschle was uncontested for the Democratic nomination and therefore was able to focus on the general election early, while Abdnor had to fight a challenge from an incumbent governor, Bill Janklow.
| Party | Candidate | Votes | % | |
|---|---|---|---|---|
| Republican | James Abdnor (Incumbent) | 63,414 | 54.51% | |
| Republican | Bill Janklow | 52,924 | 45.49% | |
| Total votes | 116,338 | 100.00% | ||
| Party | Candidate | Votes | % | ±% | |
|---|---|---|---|---|---|
| Democratic | Tom Daschle | 152,657 | 51.60% | +12.21% | |
| Republican | James Abdnor (Incumbent) | 143,173 | 48.40% | −9.80% | |
| Majority | 9,484 | 3.21% | −15.60% | ||
| Turnout | 295,830 | ||||
| Democratic gain from Republican | Swing | ||||
Utah
Summarize
Perspective
| |||||||||||||||||
 County results Garn: 60–70% 70–80% 80–90% Oliver: 50–60% | |||||||||||||||||
| |||||||||||||||||

Republican Jake Garn, originally elected in 1974, ran for re-election to a third term. He faced nominal opposition from Democrat Craig S. Oliver in the general election, defeating him 72%-27%.[5]
| Party | Candidate | Votes | % | ±% | |
|---|---|---|---|---|---|
| Republican | Jake Garn (Incumbent) | 314,608 | 72.31% | ||
| Democratic | Craig S. Oliver (D) | 115,523 | 26.55% | ||
| Libertarian | Hugh A. Butler (L) | 3,023 | 0.69% | ||
| Socialist Workers | Mary Zins | 1,863 | 0.43% | ||
| None | Write-Ins | 94 | 0.02% | ||
| Majority | 199,085 | 45.76% | |||
| Turnout | 435,111 | ||||
| Republican hold | Swing | ||||
Vermont
Summarize
Perspective
| |||||||||||||||||


Leahy: 40-50% 50-60% 60-70% 70-80% Snelling: 40-50% 50-60% 60-70% | |||||||||||||||||
| |||||||||||||||||


Incumbent Democrat Patrick Leahy won re-election to a third term over Republican former Governor of Vermont Richard A. Snelling and Liberty Unionist sociologist and perennial candidate Jerry Levy. The race was initially expected to be competitive, with Ronald Reagan encouraging Snelling to run.[39]
Both Leahy and Snelling were well-respected and highly popular in Vermont, and the general feeling was that they would both make good senators. However, Snelling was felt to be at a disadvantage for several reasons, including the fact that his main campaign plank was deficit reduction, which The Caledonian-Record noted Leahy was already a well-known advocate for, and the fact that Leahy had acquired a reputation as one of the Senate's most knowledgeable figures on the issue of nuclear proliferation, an issue which the Brattleboro Reformer noted that Snelling had no experience with.[40]
Nonetheless, Leahy defeated Snelling in a 63%-35% landslide.[5] Leahy would face one more tough re-election challenge in 1992 against Republican Jim Douglas, handily winning each term thereafter.
| Party | Candidate | Votes | % | |
|---|---|---|---|---|
| Democratic | Patrick Leahy (inc.) | 21,255 | 97.63% | |
| Democratic | Write-ins | 516 | 2.37% | |
| Total votes | 21,771 | 100.00% | ||
| Party | Candidate | Votes | % | |
|---|---|---|---|---|
| Liberty Union | Jerry Levy | 147 | 93.04% | |
| Liberty Union | Write-ins | 11 | 6.96% | |
| Total votes | 158 | 100.00% | ||
| Party | Candidate | Votes | % | |
|---|---|---|---|---|
| Republican | Richard A. Snelling | 21,477 | 75.11% | |
| Republican | Anthony N. Doria | 6,493 | 22.71% | |
| Republican | Write-ins | 625 | 2.19% | |
| Total votes | 28,595 | 100.00% | ||
| Party | Candidate | Votes | % | ±% | |
|---|---|---|---|---|---|
| Democratic | Patrick Leahy (Incumbent) | 124,123 | 63.16% | +13.34% | |
| Republican | Richard A. Snelling | 67,798 | 34.50% | −14.00% | |
| Conservative Party (US) | Anthony N. Doria | 2,963 | 1.51% | ||
| Liberty Union | Jerry Levy | 1,583 | 0.81% | ||
| Write-ins | 65 | 0.02% | |||
| Majority | 56,325 | 28.66% | +27.34% | ||
| Turnout | 196,532 | ||||
| Democratic hold | Swing | ||||
Washington
Summarize
Perspective
| |||||||||||||||||
 County results Adams: 40–50% 50–60% 60–70% 70–80% Gorton: 40–50% 50–60% 60–70% | |||||||||||||||||
| |||||||||||||||||
.jpg)

Incumbent Republican Senator Slade Gorton lost re-election to former Transportation Secretary Brock Adams. Gorton later won Washington's other Senate seat in 1988 and 1994 before losing re-election again in 2000.
| Party | Candidate | Votes | % | |
|---|---|---|---|---|
| Democratic | Brock Adams | 677,471 | 50.66% | |
| Republican | Slade Gorton (Incumbent) | 650,931 | 48.67% | |
| Socialist Workers | Jill Fein | 8,965 | 0.67% | |
| Majority | 26,540 | 1.99% | ||
| Turnout | 1,337,367 | |||
| Democratic gain from Republican | ||||
Wisconsin
Summarize
Perspective
| |||||||||||||||||
 County results Kasten: 50–60% 60–70% Garvey: 50–60% | |||||||||||||||||
| |||||||||||||||||


Incumbent Republican Bob Kasten ran unopposed in the Republican primary. Ed Garvey, former Deputy Attorney General of Wisconsin and executive director of the NFLPA, defeated Matt Flynn in the Democratic primary.[43] Kasten defeated Garvey in the general election by just over 3%.[5]
| Party | Candidate | Votes | % | |
|---|---|---|---|---|
| Republican | Bob Kasten (Incumbent) | 754,573 | 50.9% | |
| Democratic | Ed Garvey | 702,963 | 47.4% | |
| Majority | 51,610 | 3.5% | ||
| Turnout | 1,457,536 | |||
| Republican hold | ||||
See also
References
External links
Wikiwand - on
Seamless Wikipedia browsing. On steroids.