One third of Welwyn Hatfield Borough Council in Hertfordshire, England is elected each year, followed by one year without election. Since the last boundary changes in 2016 the council has comprised 48 councillors representing 16 wards, each of which elects three councillors.[1]
Council elections
- 1973 Welwyn Hatfield District Council election
- 1976 Welwyn Hatfield District Council election (New ward boundaries)[2]
- 1979 Welwyn Hatfield District Council election
- 1980 Welwyn Hatfield District Council election
- 1982 Welwyn Hatfield District Council election
- 1983 Welwyn Hatfield District Council election
- 1984 Welwyn Hatfield District Council election
- 1986 Welwyn Hatfield District Council election (District boundary changes took place but the number of seats remained the same)[3]
- 1987 Welwyn Hatfield District Council election
- 1988 Welwyn Hatfield District Council election
- 1990 Welwyn Hatfield District Council election
- 1991 Welwyn Hatfield District Council election (New ward boundaries)[4]
- 1992 Welwyn Hatfield District Council election
- 1994 Welwyn Hatfield District Council election (District boundary changes took place but the number of seats remained the same)[5]
- 1995 Welwyn Hatfield District Council election
- 1996 Welwyn Hatfield District Council election
- 1998 Welwyn Hatfield District Council election
- 1999 Welwyn Hatfield District Council election (New ward boundaries increased the number of seats by one)[6][7]
- 2000 Welwyn Hatfield District Council election
- 2002 Welwyn Hatfield District Council election
- 2003 Welwyn Hatfield District Council election
- 2004 Welwyn Hatfield District Council election
- 2006 Welwyn Hatfield District Council election
- 2007 Welwyn Hatfield Borough Council election
- 2008 Welwyn Hatfield Borough Council election (New ward boundaries)[8][9]
- 2010 Welwyn Hatfield Borough Council election
- 2011 Welwyn Hatfield Borough Council election
- 2012 Welwyn Hatfield Borough Council election
- 2014 Welwyn Hatfield Borough Council election
- 2015 Welwyn Hatfield Borough Council election
- 2016 Welwyn Hatfield Borough Council election (New ward boundaries)[1]
- 2018 Welwyn Hatfield Borough Council election
- 2019 Welwyn Hatfield Borough Council election
- 2021 Welwyn Hatfield Borough Council election
- 2022 Welwyn Hatfield Borough Council election
- 2023 Welwyn Hatfield Borough Council election
- 2024 Welwyn Hatfield Borough Council election
Results maps
 2016 results map
 2018 results map
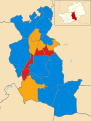 2019 results map
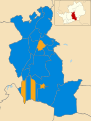 2021 results map
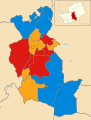 2022 results map
 2023 results map
 2024 results map


By-election results
1994-1998
| Party | Candidate | Votes | % | ±% | |
|---|---|---|---|---|---|
| Conservative | 486 | 49.5 | +10.4 | ||
| Labour | 292 | 29.8 | −22.4 | ||
| Liberal Democrats | 109 | 11.1 | +2.4 | ||
| No to Sleaze, No to Slough | 94 | 9.6 | +9.6 | ||
| Majority | 194 | 19.7 | |||
| Turnout | 981 | 25.0 | |||
| Conservative gain from Labour | Swing | ||||
| Party | Candidate | Votes | % | ±% | |
|---|---|---|---|---|---|
| Conservative | 517 | 42.9 | +21.0 | ||
| Labour | 454 | 37.7 | −28.2 | ||
| Liberal Democrats | 156 | 13.0 | +0.7 | ||
| Other | 77 | 6.4 | +6.4 | ||
| Majority | 63 | 5.2 | |||
| Turnout | 1,204 | ||||
| Conservative gain from Labour | Swing | ||||
1998-2002
| Party | Candidate | Votes | % | ±% | |
|---|---|---|---|---|---|
| Labour | 726 | 75.0 | +8.3 | ||
| Conservative | 241 | 24.9 | +4.7 | ||
| Majority | 485 | 50.1 | |||
| Turnout | 967 | 23.0 | |||
| Labour hold | Swing | ||||
| Party | Candidate | Votes | % | ±% | |
|---|---|---|---|---|---|
| Labour | 528 | 83.7 | +15.4 | ||
| Conservative | 103 | 16.3 | −1.2 | ||
| Majority | 425 | 67.4 | |||
| Turnout | 631 | 13.0 | |||
| Labour hold | Swing | ||||
| Party | Candidate | Votes | % | ±% | |
|---|---|---|---|---|---|
| Labour | 802 | ||||
| Labour | 797 | ||||
| Labour | 772 | ||||
| Conservative | 282 | ||||
| Conservative | 282 | ||||
| Conservative | 272 | ||||
| Liberal Democrats | 82 | ||||
| Liberal Democrats | 81 | ||||
| Liberal Democrats | 69 | ||||
| Turnout | 3,439 | 29.0 | |||
| Labour hold | Swing | ||||
| Labour hold | Swing | ||||
| Labour hold | Swing | ||||
| Party | Candidate | Votes | % | ±% | |
|---|---|---|---|---|---|
| Conservative | 831 | 51.6 | |||
| Labour | 381 | 23.7 | |||
| Liberal Democrats | 276 | 17.2 | |||
| UKIP | 121 | 7.5 | |||
| Majority | 450 | 27.9 | |||
| Turnout | 1,609 | 30.1 | |||
| Conservative hold | Swing | ||||
| Party | Candidate | Votes | % | ±% | |
|---|---|---|---|---|---|
| Labour | 611 | 58.8 | +1.7 | ||
| Conservative | 363 | 34.9 | +4.4 | ||
| Liberal Democrats | 65 | 6.3 | −6.2 | ||
| Majority | 248 | 23.9 | |||
| Turnout | 1,039 | 22.7 | |||
| Labour hold | Swing | ||||
2002-2006
| Party | Candidate | Votes | % | ±% | |
|---|---|---|---|---|---|
| Conservative | Howard Morgan | 539 | 50.7 | +7.9 | |
| Labour | 398 | 37.4 | −4.9 | ||
| Liberal Democrats | 126 | 11.9 | −3.0 | ||
| Majority | 141 | 13.3 | |||
| Turnout | 1,063 | 24.7 | |||
| Conservative gain from Labour | Swing | ||||
| Party | Candidate | Votes | % | ±% | |
|---|---|---|---|---|---|
| Conservative | Clare Berry | 484 | 46.8 | −3.9 | |
| Labour | Stuart Jackson | 444 | 42.9 | +5.5 | |
| Liberal Democrats | Mike Larkins | 106 | 10.3 | −1.6 | |
| Majority | 40 | 3.9 | |||
| Turnout | 1,034 | 23.8 | |||
| Conservative hold | Swing | ||||
| Party | Candidate | Votes | % | ±% | |
|---|---|---|---|---|---|
| Conservative | Christine Wheeler | 689 | 46.0 | +0.4 | |
| Labour | Christopher Cory | 521 | 34.8 | −5.1 | |
| Liberal Democrats | Ian Skidmore | 288 | 19.2 | +4.8 | |
| Majority | 168 | 11.2 | |||
| Turnout | 1,498 | 34.6 | |||
| Conservative hold | Swing | ||||
| Party | Candidate | Votes | % | ±% | |
|---|---|---|---|---|---|
| Labour | Samuel Smith | 546 | 38.2 | −0.2 | |
| Conservative | Sara Johnston | 456 | 32.0 | −2.8 | |
| Liberal Democrats | Eirwen Smith | 425 | 29.8 | +3.0 | |
| Majority | 90 | 6.2 | |||
| Turnout | 1,427 | 32.8 | |||
| Labour hold | Swing | ||||
| Party | Candidate | Votes | % | ±% | |
|---|---|---|---|---|---|
| Liberal Democrats | Anthony Skottowe | 1,124 | 56.5 | +11.0 | |
| Conservative | Lance Stanbury | 702 | 35.2 | −8.4 | |
| Labour | Sarah Carthew | 165 | 8.3 | −2.6 | |
| Majority | 422 | 21.3 | |||
| Turnout | 1,498 | 40.1 | |||
| Liberal Democrats hold | Swing | ||||
2006-2010
| Party | Candidate | Votes | % | ±% | |
|---|---|---|---|---|---|
| Conservative | Doug Berry | 539 | 40.7 | ||
| Liberal Democrats | John Elvy | 484 | 36.5 | ||
| BNP | Mark Fuller | 214 | 16.2 | ||
| Labour | Bridgit Croft | 88 | 6.6 | ||
| Majority | 55 | 4.2 | |||
| Turnout | 1,325 | 46.6 | |||
| Conservative hold | Swing | ||||
| Party | Candidate | Votes | % | ±% | |
|---|---|---|---|---|---|
| Labour | Maureen Cook | 425 | 33.2 | −8.3 | |
| Liberal Democrats | Hazel Laming | 329 | 25.7 | +10.5 | |
| Conservative | Stan Laver-Walton | 319 | 24.9 | −18.4 | |
| BNP | Mark Fuller | 138 | 10.8 | +10.8 | |
| Independent | Timothy Butler | 69 | 5.4 | +5.4 | |
| Majority | 96 | 7.5 | |||
| Turnout | 1,280 | 28.5 | |||
| Labour gain from Conservative | Swing | ||||
| Party | Candidate | Votes | % | ±% | |
|---|---|---|---|---|---|
| Conservative | Tony Kingsbury | 954 | 50.1 | −6.2 | |
| Liberal Democrats | Hazel Laming | 579 | 30.4 | +9.4 | |
| Labour | Cathy Watson | 370 | 19.4 | −3.2 | |
| Majority | 375 | 19.7 | |||
| Turnout | 1,903 | 40.4 | |||
| Conservative hold | Swing | ||||
| Party | Candidate | Votes | % | ±% | |
|---|---|---|---|---|---|
| Labour | Kieran Thorpe | 431 | 38.0 | ||
| Conservative | Sarah Langley | 413 | 36.4 | ||
| Liberal Democrats | Simon Archer | 291 | 25.6 | ||
| Majority | 18 | 1.6 | |||
| Turnout | 1,135 | 32.2 | |||
| Labour hold | Swing | ||||
2010-2014
| Party | Candidate | Votes | % | ±% | |
|---|---|---|---|---|---|
| Labour | Tony Crump | 580 | 39.1 | −10.8 | |
| Conservative | Madeleine Sawle | 458 | 30.8 | −4.2 | |
| UKIP | Kevin Daley | 277 | 18.7 | +18.7 | |
| Green | Susan Groom | 104 | 7.0 | −2.5 | |
| Liberal Democrats | Frank Marsh | 66 | 4.4 | −1.2 | |
| Majority | 122 | 8.2 | |||
| Turnout | 1,485 | ||||
| Labour hold | Swing | ||||
2014-2018
| Party | Candidate | Votes | % | ±% | |
|---|---|---|---|---|---|
| Conservative | Nathaniel Chapman | 502 | 34.1 | −1.3 | |
| Labour | Astrid Thorpe | 454 | 30.8 | −6.9 | |
| Liberal Democrats | Anthony Dennis | 437 | 29.6 | +17.7 | |
| Green | Lynne Allison | 81 | 5.5 | −9.5 | |
| Majority | 48 | 3.3 | |||
| Turnout | 1,474 | ||||
| Conservative hold | Swing | ||||
| Party | Candidate | Votes | % | ±% | |
|---|---|---|---|---|---|
| Conservative | Terry Mitchinson | 643 | 38.3 | −7.5 | |
| Liberal Democrats | Ayesha Rohale | 620 | 36.9 | +21.4 | |
| Labour | Lucy Musk | 418 | 24.9 | +2.6 | |
| Majority | 23 | 1.4 | |||
| Turnout | 1,681 | ||||
| Conservative hold | Swing | ||||
| Party | Candidate | Votes | % | ±% | |
|---|---|---|---|---|---|
| Labour | Tara-Mary Lyons | 1,359 | 40.1 | +2.2 | |
| Conservative | Peter Hebden | 1,352 | 39.9 | −10.0 | |
| Liberal Democrats | Jane Quinton | 677 | 20.0 | +7.8 | |
| Majority | 7 | 0.2 | |||
| Turnout | 3,388 | ||||
| Labour gain from Conservative | Swing | ||||
| Party | Candidate | Votes | % | ±% | |
|---|---|---|---|---|---|
| Liberal Democrats | Siobhan Elam | 1105 | 52.4 | +16.7 | |
| Conservative | Drew Richardson | 691 | 32.8 | −9.3 | |
| Labour | Belinda Yeldon | 260 | 12.3 | −3.5 | |
| Majority | 375 | 19.7 | |||
| Turnout | 2,111 | 38.5 | |||
| Liberal Democrats hold | Swing | ||||
2018-2022
| Party | Candidate | Votes | % | ±% | |
|---|---|---|---|---|---|
| Labour | Kieran Thorpe | 599 | 53.7 | +0.9 | |
| Conservative | Mark Smith | 273 | 24.5 | −8.9 | |
| Liberal Democrats | Richard Griffiths | 183 | 16.4 | +2.6 | |
| Abolish the TV Licence Party | Melvyn Jones | 61 | 5.5 | +5.5 | |
| Majority | 326 | 29.2 | |||
| Turnout | 1,116 | ||||
| Labour hold | Swing | ||||
References
External links
Wikiwand - on
Seamless Wikipedia browsing. On steroids.