Loading AI tools
Walsall Metropolitan Borough Council elections are held three years out of every four, with a third of the council elected each time. Walsall Metropolitan Borough Council, which styles itself "Walsall Council", is the local authority for the metropolitan district of Walsall in the West Midlands, England. Since the last boundary changes in 2004, 60 councillors have been elected from 20 wards.[1]
- 1998 Walsall Metropolitan Borough Council election
- 1999 Walsall Metropolitan Borough Council election
- 2000 Walsall Metropolitan Borough Council election
- 2002 Walsall Metropolitan Borough Council election
- 2003 Walsall Metropolitan Borough Council election
- 2004 Walsall Metropolitan Borough Council election (whole council elected after boundary changes)[2][1]
- 2006 Walsall Metropolitan Borough Council election
- 2007 Walsall Metropolitan Borough Council election
- 2008 Walsall Metropolitan Borough Council election
- 2010 Walsall Metropolitan Borough Council election
- 2011 Walsall Metropolitan Borough Council election
- 2012 Walsall Metropolitan Borough Council election
- 2014 Walsall Metropolitan Borough Council election
- 2015 Walsall Metropolitan Borough Council election
- 2016 Walsall Metropolitan Borough Council election
- 2018 Walsall Metropolitan Borough Council election
- 2019 Walsall Metropolitan Borough Council election
- 2021 Walsall Metropolitan Borough Council election
- 2022 Walsall Metropolitan Borough Council election
- 2023 Walsall Metropolitan Borough Council election
- 2024 Walsall Metropolitan Borough Council election
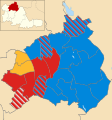 2004 results map
 2006 results map
 2007 results map
 2008 results map
 2010 results map
 2011 results map
 2012 results map
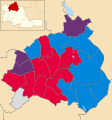 2014 results map
 2015 results map
 2016 results map
 2018 results map
 2019 results map
 2021 results map
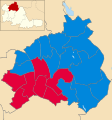 2022 results map
 2023 results map
 2024 results map


1994-1998
| Party | Candidate | Votes | % | ±% | |
|---|---|---|---|---|---|
| Labour | 734 | 37.8 | |||
| Independent | 563 | 28.9 | |||
| Conservative | 411 | 21.1 | |||
| Democratic Labour | 195 | 10.0 | |||
| Liberal Democrats | 32 | 1.6 | |||
| National Front | 13 | 0.7 | |||
| Majority | 171 | 8.9 | |||
| Turnout | 1,948 | 21.4 | |||
| Labour gain from Independent | Swing | ||||
2002-2006
| Party | Candidate | Votes | % | ±% | |
|---|---|---|---|---|---|
| Conservative | 1,251 | 47.9 | −10.1 | ||
| Independent | 750 | 28.7 | +18.9 | ||
| Labour | 264 | 10.1 | −8.5 | ||
| Liberal Democrats | 178 | 6.8 | −6.8 | ||
| UKIP | 87 | 3.3 | +3.3 | ||
| Independent | 84 | 3.2 | +3.2 | ||
| Majority | 501 | 19.2 | |||
| Turnout | 2,614 | 26.7 | |||
| Conservative hold | Swing | ||||
| Party | Candidate | Votes | % | ±% | |
|---|---|---|---|---|---|
| Conservative | 1,009 | 41.1 | −2.9 | ||
| Independent | 539 | 22.0 | +0.8 | ||
| Liberal Democrats | 416 | 17.0 | +6.0 | ||
| Labour | 285 | 11.6 | +0.0 | ||
| UKIP | 204 | 8.3 | +8.3 | ||
| Majority | 470 | 19.1 | |||
| Turnout | 2,453 | 23.3 | |||
| Conservative hold | Swing | ||||
| Party | Candidate | Votes | % | ±% | |
|---|---|---|---|---|---|
| Conservative | Eddie Hughes | 1,009 | 35.3 | −16.3 | |
| BNP | William Locke | 746 | 26.1 | +26.1 | |
| Labour | Ann Wilson | 650 | 22.7 | −12.8 | |
| Independent | Lynette Benford | 268 | 9.4 | +9.4 | |
| Socialist Alliance | Louise Bradburn | 188 | 6.6 | +6.6 | |
| Majority | 263 | 9.2 | |||
| Turnout | 2,861 | 28.9 | |||
| Conservative hold | Swing | ||||
| Party | Candidate | Votes | % | ±% | |
|---|---|---|---|---|---|
| Labour | 621 | 35.9 | −12.4 | ||
| Conservative | 612 | 35.4 | +0.7 | ||
| Independent | 356 | 20.6 | +7.9 | ||
| Socialist Alliance | 74 | 4.3 | +4.3 | ||
| Liberal Democrats | 66 | 3.8 | −0.5 | ||
| Majority | 9 | 0.5 | |||
| Turnout | 1,729 | 21.7 | |||
| Labour hold | Swing | ||||
| Party | Candidate | Votes | % | ±% | |
|---|---|---|---|---|---|
| Labour | Graham Wilkes | 688 | 37.1 | +5.6 | |
| Independent | Christine Bott | 367 | 19.7 | −9.0 | |
| BNP | Kevin Smith | 325 | 17.5 | +17.5 | |
| Conservative | Chad Pitt | 273 | 14.7 | +0.9 | |
| Democratic Labour | Allan Johnston | 120 | 6.5 | +6.5 | |
| UKIP | Derek Bennett | 72 | 3.9 | +3.9 | |
| Independent | Peter Winterton | 11 | 0.6 | +0.6 | |
| Majority | 321 | 17.4 | |||
| Turnout | 1,856 | 20.8 | |||
| Labour hold | Swing | ||||
| Party | Candidate | Votes | % | ±% | |
|---|---|---|---|---|---|
| Labour | Carl Creaney | 862 | 45.4 | +1.4 | |
| Conservative | Keir Pedley | 486 | 25.6 | −2.4 | |
| Liberal Democrats | Robert Pearce | 399 | 21.0 | −7.4 | |
| BNP | William Vaughan | 151 | 7.6 | +7.6 | |
| Majority | 376 | 19.8 | |||
| Turnout | 1,898 | 19.5 | |||
| Labour hold | Swing | ||||
2006-2010
| Party | Candidate | Votes | % | ±% | |
|---|---|---|---|---|---|
| Conservative | Michael Flower | 1,157 | 58.4 | +12.5 | |
| Labour | Ian Pearson | 309 | 15.6 | +0.5 | |
| BNP | Dominic Bugler | 222 | 11.2 | −7.5 | |
| Liberal Democrats | Mark Greveson | 160 | 8.1 | −2.4 | |
| UKIP | Anthony Lenton | 132 | 6.7 | −3.0 | |
| Majority | 848 | 42.8 | |||
| Turnout | 1,980 | 17.0 | |||
| Conservative hold | Swing | ||||
| Party | Candidate | Votes | % | ±% | |
|---|---|---|---|---|---|
| Conservative | Kamran Aftab | 764 | 43.9 | +12.9 | |
| Labour | Richard Worrall | 661 | 37.9 | −16.7 | |
| BNP | Malcolm Moore | 90 | 5.2 | +5.2 | |
| Liberal Democrats | Christine Cockayne | 72 | 4.1 | +4.1 | |
| Democratic Labour | Alan Davies | 69 | 4.0 | −2.3 | |
| UKIP | Elizabeth Hazell | 52 | 3.0 | +3.0 | |
| Green | Paul Booker | 34 | 2.0 | −6.1 | |
| Majority | 103 | 5.9 | |||
| Turnout | 1,742 | 19.6 | |||
| Conservative gain from Labour | Swing | ||||
| Party | Candidate | Votes | % | ±% | |
|---|---|---|---|---|---|
| Conservative | Ronald Carpenter | 808 | 49.8 | −11.2 | |
| Labour | Lee Jeavons | 411 | 25.3 | +5.6 | |
| Liberal Democrats | Leslie Smith | 178 | 11.0 | −1.5 | |
| UKIP | Timothy Melville | 165 | 10.2 | +10.2 | |
| Green | Karl MacNaughton | 61 | 3.8 | −3.1 | |
| Majority | 398 | 24.5 | |||
| Turnout | 1,623 | 18.0 | |||
| Conservative hold | Swing | ||||
2010-2014
| Party | Candidate | Votes | % | ±% | |
|---|---|---|---|---|---|
| Labour | Frederick Westley | 1,142 | 53.6 | +18.5 | |
| Conservative | Theresa Smith | 800 | 37.5 | −3.2 | |
| UKIP | Paul Valdmanis | 91 | 4.3 | +4.3 | |
| Liberal Democrats | Christine Cockayne | 71 | 3.3 | −6.5 | |
| Green | Zoe Henderson | 28 | 1.3 | −0.4 | |
| Majority | 342 | 16.0 | |||
| Turnout | 2,132 | 22.0 | |||
| Labour gain from Conservative | Swing | ||||
| Party | Candidate | Votes | % | ±% | |
|---|---|---|---|---|---|
| Conservative | Lorna Rattigan | 639 | 42.0 | −1.8 | |
| Labour | Richard Worrall | 611 | 40.1 | +13.1 | |
| BNP | William Vaughan | 141 | 9.3 | +9.3 | |
| UKIP | Tim Melville | 90 | 5.9 | −2.3 | |
| Monster Raving Loony | Mark Beech | 42 | 2.8 | +2.8 | |
| Majority | 28 | 1.8 | |||
| Turnout | 1,523 | 16.0 | |||
| Conservative hold | Swing | ||||
| Party | Candidate | Votes | % | ±% | |
|---|---|---|---|---|---|
| Labour | Julie Fitzpatrick | 922 | 48.0 | +5.2 | |
| Conservative | Les Beeley | 834 | 43.5 | +1.1 | |
| UKIP | Derek Bennett | 98 | 5.1 | −3.0 | |
| English Democrat | Chris Newey | 49 | 2.6 | +2.6 | |
| Green | Leandra Gebrakedan | 16 | 0.8 | +0.8 | |
| Majority | 88 | 4.6 | +4.1 | ||
| Turnout | 1,919 | ||||
| Labour gain from Conservative | Swing | ||||
| Party | Candidate | Votes | % | ±% | |
|---|---|---|---|---|---|
| Labour | Tina Jukes | 835 | 52.8 | ||
| Conservative | Kamran Afrab | 512 | 32.4 | ||
| English Democrat | Chris Newey | 130 | 8.2 | ||
| UKIP | Liz Hazell | 59 | 3.7 | −7.3 | |
| Green | Leandra Gebrakedan | 46 | 2.9 | ||
| Majority | 323 | ||||
| Turnout | 1,582 | ||||
| Party | Candidate | Votes | % | ±% | |
|---|---|---|---|---|---|
| Labour | Patti Lane | 1,049 | 50.2 | ||
| Conservative | Abi Pitt | 783 | 37.5 | ||
| UKIP | Liz Hazell | 195 | 9.3 | ||
| Liberal Democrats | Christine Cockayne | 61 | 2.9 | ||
| Majority | 266 | ||||
| Turnout | 2,088 | ||||
2013-2017
| Party | Candidate | Votes | % | ±% | |
|---|---|---|---|---|---|
| Conservative | Timothy Wilson | 1,254 | 49.7 | ||
| UKIP | Liz Hazell | 615 | 24.4 | ||
| Labour | Bob Grainger | 470 | 18.6 | ||
| Liberal Democrats | Roy Sheward | 114 | 4.5 | ||
| English Democrat | Chris Newey | 72 | 2.5 | ||
| Majority | 639 | ||||
| Turnout | 2,525 | ||||
2014-2018
| Party | Candidate | Votes | % | ±% | |
|---|---|---|---|---|---|
| Labour | Chris Jones | 1,075 | 47.8 | ||
| Conservative | Gazanfer Ali | 710 | 31.6 | ||
| UKIP | Paul White | 445 | 19.8 | ||
| English Democrat | Chris Newey | 20 | 0.9 | ||
| Majority | 365 | ||||
| Turnout | 2,250 | ||||
2018-2022
| Party | Candidate | Votes | % | ±% | |
|---|---|---|---|---|---|
| Labour | Simran Kaur Cheema | 698 | 64.6 | ||
| Conservative | Mohammed Saghir | 382 | 35.4 | ||
| Majority | 316 | ||||
| Turnout | 1,080 | ||||
Cheema was unable to take her seat, due to being employed by Walsall Libraries at the time.[18]
Wikiwand in your browser!
Seamless Wikipedia browsing. On steroids.
Every time you click a link to Wikipedia, Wiktionary or Wikiquote in your browser's search results, it will show the modern Wikiwand interface.
Wikiwand extension is a five stars, simple, with minimum permission required to keep your browsing private, safe and transparent.