User:Mrfebruary
From Wikipedia, the free encyclopedia
I had thought the lions of wrath,
my only adversaries,
that love would melt to tears,
their ice crystal eyes
| This user is from Wellington. |
 New Zealand Greenhouse Gas Emissions 1990 to 2017
 Baring Head
 New Zealand T7 land temperature anomaly 1909 2018
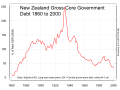 New Zealand Government Gross Debt as percent of GDP 1860 to 2000
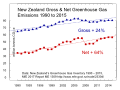 NZ Gross & Net Greenhouse Gas Emissions 1990 to 2015
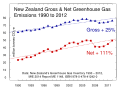 NZ Gross & Net Greenhouse Gas Emissions 1990 to 2012
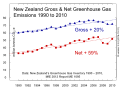 NZ Gross & Net Greenhouse Gas Emissions 1990 to 2010
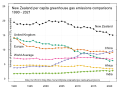 NZ and others per capita emissions of greenhouse gases
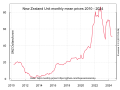 NZ emission unit prices
 New Zealand Land Temperature Anomalies
 New Zealand Greenhouse Gas Emissions by Sector
 NZ Gross Energy and Agricultural Greenhouse Gas Emissions 1861 to 2012
 Kyoto-Related Fossil-Fuel Carbon Dioxide Emissions 1990-2007
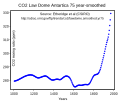 Carbon dioxide 1000 to 2006, Law Dome ice cores, Antarctica
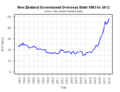 New Zealand Government Net Overseas Debt 1993 to 2010.png (PNG version)
 NZ_sector_ghg_1990_2007.svg (SVG version)
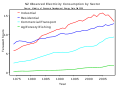 New Zealand Observed Electricity Consumption by Sector
 New Zealand Electricity Generation
 Canterbury Regional Council Consent Applications Backlog
 New Zealand Carbon Dioxide emissions per capita 1971-2007
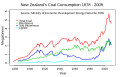 NZ coal consumption 1878 2009
 Australia Temperature Anomalies 1910 2009
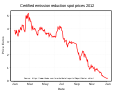 Cers spot prices 2012


| Mr February |
More information NZ Greenhouse Gas Emissions Profile 2010 ...
| NZ Greenhouse Gas Emissions Profile 2010[1] | ||||
|---|---|---|---|---|
| sector | percent | |||
| Agriculture | 47.1% | |||
| Energy | 43.4% | |||
| Industry | 6.7% | |||
| Waste | 2.8% | |||
Close
More information NZ Greenhouse Gas Emissions Profile 2010 ...
| NZ Greenhouse Gas Emissions Profile 2010 | ||||
|---|---|---|---|---|
| greenhouse gas | percent | |||
| Carbon Dioxide | 46% | |||
| Methane | 37% | |||
| Nitrous Oxide | 15% | |||
| HFCs | 2% | |||
| PFCs and SF 6 | 0% | |||
Close
- "New Zealand's Greenhouse Gas Inventory 1990–2010". Ministry for the Environment. 12 April 2012. Retrieved 12 November 2012.