Three Rivers District Council elections are held three years out of four to elect members of Three Rivers District Council in Hertfordshire, England. Since the last boundary changes in 2014 the council has comprised 39 councillors representing 13 wards, each of which elects three councillors, one at each election such that a third of the council is elected each time. Elections to Hertfordshire County Council are held in the fourth year of the cycle when there are no district council elections.[1]
Council elections
- 1973 Three Rivers District Council election
- 1976 Three Rivers District Council election (New ward boundaries)[2]
- 1979 Three Rivers District Council election
- 1980 Three Rivers District Council election
- 1982 Three Rivers District Council election
- 1983 Three Rivers District Council election
- 1984 Three Rivers District Council election
- 1986 Three Rivers District Council election (District boundary changes took place but the number of seats remained the same)[3]
- 1987 Three Rivers District Council election
- 1988 Three Rivers District Council election
- 1990 Three Rivers District Council election
- 1991 Three Rivers District Council election (Some new ward boundaries & district boundary changes also took place)[4]
- 1992 Three Rivers District Council election
- 1994 Three Rivers District Council election
- 1995 Three Rivers District Council election
- 1996 Three Rivers District Council election
- 1998 Three Rivers District Council election
- 1999 Three Rivers District Council election (New ward boundaries)[5][6]
- 2000 Three Rivers District Council election
- 2002 Three Rivers District Council election
- 2003 Three Rivers District Council election
- 2004 Three Rivers District Council election
- 2006 Three Rivers District Council election
- 2007 Three Rivers District Council election
- 2008 Three Rivers District Council election
- 2009 Three Rivers District Council election
- 2010 Three Rivers District Council election
- 2011 Three Rivers District Council election
- 2012 Three Rivers District Council election
- 2014 Three Rivers District Council election (New ward boundaries)[7]
- 2015 Three Rivers District Council election
- 2016 Three Rivers District Council election
- 2018 Three Rivers District Council election
- 2019 Three Rivers District Council election
- 2021 Three Rivers District Council election
- 2022 Three Rivers District Council election
- 2023 Three Rivers District Council election
- 2024 Three Rivers District Council election
Results maps
 2014 results map
 2015 results map
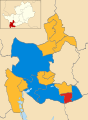 2016 results map
 2018 results map
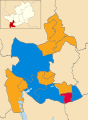 2019 results map
 2021 results map
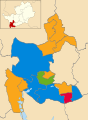 2022 results map
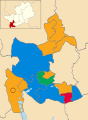 2023 results map
 2024 results map


By-elections
1994-1998
| Party | Candidate | Votes | % | ±% | |
|---|---|---|---|---|---|
| Liberal Democrats | 403 | 50.5 | |||
| Labour | 255 | 32.0 | |||
| Conservative | 139 | 17.4 | |||
| Majority | 148 | 18.5 | |||
| Turnout | 797 | 29.7 | |||
| Liberal Democrats hold | Swing | ||||
| Party | Candidate | Votes | % | ±% | |
|---|---|---|---|---|---|
| Liberal Democrats | 581 | 48.1 | |||
| Conservative | 464 | 38.4 | |||
| Labour | 164 | 13.6 | |||
| Majority | 117 | 9.7 | |||
| Turnout | 1,209 | 34.7 | |||
| Liberal Democrats hold | Swing | ||||
1998-2002
| Party | Candidate | Votes | % | ±% | |
|---|---|---|---|---|---|
| Labour | David Saxon | 210 | 51.9 | −3.9 | |
| Liberal Democrats | Raymond Tully | 84 | 20.7 | +2.2 | |
| Conservative | Graham Denman | 74 | 18.3 | −7.3 | |
| BNP | Ian Edward | 37 | 9.1 | +9.1 | |
| Majority | 126 | 31.2 | |||
| Turnout | 405 | 16.9 | |||
| Labour hold | Swing | ||||
2002-2006
| Party | Candidate | Votes | % | ±% | |
|---|---|---|---|---|---|
| Labour | Kerron Cross | 188 | 38.8 | −17.0 | |
| Conservative | Lynda Lewis | 154 | 31.8 | +6.2 | |
| Liberal Democrats | Alison Scarth | 143 | 29.5 | +11.0 | |
| Majority | 34 | 7.0 | |||
| Turnout | 485 | 19.8 | |||
| Labour hold | Swing | ||||
| Party | Candidate | Votes | % | ±% | |
|---|---|---|---|---|---|
| Conservative | Mark Weedon | 1,178 | 56.3 | −5.9 | |
| Liberal Democrats | Leslie Mead | 629 | 30.1 | +4.1 | |
| Labour | Graham Dale | 285 | 13.6 | +0.0 | |
| Majority | 549 | 26.2 | |||
| Turnout | 2,092 | 66.5 | |||
| Conservative hold | Swing | ||||
2006-2010
| Party | Candidate | Votes | % | ±% | |
|---|---|---|---|---|---|
| Liberal Democrats | Keith Williams | 857 | 63.3 | −8.7 | |
| Conservative | Chris Hawes | 369 | 27.3 | +5.7 | |
| Labour | Colin Gray | 128 | 9.5 | +3.0 | |
| Majority | 488 | 36.0 | |||
| Turnout | 1,354 | 33.4 | |||
| Liberal Democrats hold | Swing | ||||
| Party | Candidate | Votes | % | ±% | |
|---|---|---|---|---|---|
| Labour | Stephen King | 487 | 53.9 | +21.7 | |
| Conservative | Ty Harris | 190 | 21.0 | −4.6 | |
| BNP | Deirdre Gates | 170 | 18.8 | −11.5 | |
| Liberal Democrats | Dennis Rogers | 56 | 6.2 | −1.4 | |
| Majority | 297 | 32.9 | |||
| Turnout | 903 | 35.0 | |||
| Labour hold | Swing | ||||
2014-2018
| Party | Candidate | Votes | % | ±% | |
|---|---|---|---|---|---|
| Liberal Democrats | Alex Michaels | 626 | 60.9 | +24.0 | |
| Conservative | Dee Ward | 196 | 19.1 | −22.9 | |
| Labour | Bruce Prochnik | 119 | 11.6 | −9.6 | |
| UKIP | David Bennett | 69 | 6.7 | +6.7 | |
| Green | Roberta Curran | 18 | 1.8 | +1.8 | |
| Majority | 430 | 41.8 | |||
| Turnout | 1,028 | ||||
| Liberal Democrats gain from Conservative | Swing | ||||
| Party | Candidate | Votes | % | ±% | |
|---|---|---|---|---|---|
| Liberal Democrats | Phil Williams | 1,428 | 63.7 | +4.6 | |
| Conservative | Colin Payne | 597 | 26.6 | −2.0 | |
| Labour | Jack Hazlewood | 162 | 7.2 | +0.1 | |
| UKIP | Hazel Day | 28 | 1.2 | −4.0 | |
| Green | Tab McLaughlin | 27 | 1.2 | +1.2 | |
| Majority | 831 | 37.1 | |||
| Turnout | 2,242 | ||||
| Liberal Democrats hold | Swing | ||||
| Party | Candidate | Votes | % | ±% | |
|---|---|---|---|---|---|
| Liberal Democrats | Keith Martin | 672 | 41.3 | −6.5 | |
| Conservative | Roy Clements | 461 | 28.3 | +2.7 | |
| Labour | Brendan O'Brien | 428 | 26.3 | +8.8 | |
| UKIP | Mick Matthewson | 35 | 2.2 | −7.0 | |
| Green | Matt Jones | 31 | 1.9 | +1.9 | |
| Majority | 211 | 13.0 | |||
| Turnout | 1,627 | ||||
| Liberal Democrats gain from Conservative | Swing | ||||
2022-2026
| Party | Candidate | Votes | % | ±% | |
|---|---|---|---|---|---|
| Liberal Democrats | Harry Davies | 694 | 57.5 | +4.5 | |
| Conservative | Oliver Neville | 355 | 29.4 | +1.8 | |
| Green | Roger Stafford | 102 | 8.5 | −1.8 | |
| Labour | Martin Waldron | 55 | 4.6 | −4.5 | |
| Majority | 339 | 28.1 | |||
| Turnout | 1,206 | ||||
| Liberal Democrats hold | Swing | ||||
| Party | Candidate | Votes | % | ±% | |
|---|---|---|---|---|---|
| Conservative | Mike Sims | 1,694 | 43.2 | −0.5 | |
| Liberal Democrats | Pav Dhyani | 1,329 | 33.9 | −7.8 | |
| Labour | Martin Waldron | 513 | 13.1 | +5.2 | |
| Green | Roger Stafford | 383 | 9.8 | +3.1 | |
| Majority | 365 | 9.3 | +7.3 | ||
| Turnout | 3,945 | 68.4 | +24.9 | ||
| Conservative hold | Swing | +3.7 | |||
| Party | Candidate | Votes | % | ±% | |
|---|---|---|---|---|---|
| Conservative | Vicky Edwards | 593 | 40.5 | +20.4 | |
| Liberal Democrats | Alex Turner | 500 | 34.2 | −24.3 | |
| Green | Jane Powell | 233 | 15.9 | +8.4 | |
| Labour | Pierce Culliton | 137 | 9.4 | −4.4 | |
| Majority | 93 | 6.4 | |||
| Turnout | 1,463 | ||||
| Conservative gain from Liberal Democrats | Swing | ||||
See also
References
External links
Wikiwand - on
Seamless Wikipedia browsing. On steroids.