
Seven basic tools of quality
Fixed set of visual exercises for troubleshooting issues related to quality / From Wikipedia, the free encyclopedia
The seven basic tools of quality are a fixed set of visual exercises identified as being most helpful in troubleshooting issues related to quality.[1] They are called basic because they are suitable for people with little formal training in statistics and because they can be used to solve the vast majority of quality-related issues.[2]
Examples

 Check sheet
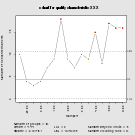 Control chart
 Histogram
 Scatter diagram
 Flow chart
 Run chart


