Portal:Tropical cyclones
Wikipedia portal for content related to Tropical cyclones / From Wikipedia, the free encyclopedia
Portal maintenance status: (June 2018)
|
The Tropical Cyclones Portal

A tropical cyclone is a storm system characterized by a large low-pressure center, a closed low-level circulation and a spiral arrangement of numerous thunderstorms that produce strong winds and heavy rainfall. Tropical cyclones feed on the heat released when moist air rises, resulting in condensation of water vapor contained in the moist air. They are fueled by a different heat mechanism than other cyclonic windstorms such as Nor'easters, European windstorms and polar lows, leading to their classification as "warm core" storm systems. Most tropical cyclones originate in the doldrums, approximately ten degrees from the Equator.
The term "tropical" refers to both the geographic origin of these systems, which form almost exclusively in tropical regions of the globe, as well as to their formation in maritime tropical air masses. The term "cyclone" refers to such storms' cyclonic nature, with anticlockwise rotation in the Northern Hemisphere and clockwise rotation in the Southern Hemisphere. Depending on its location and intensity, a tropical cyclone may be referred to by names such as "hurricane", "typhoon", "tropical storm", "cyclonic storm", "tropical depression" or simply "cyclone".
Types of cyclone: 1. A "Typhoon" is a tropical cyclone located in the North-west Pacific Ocean which has the most cyclonic activity and storms occur year-round. 2. A "Hurricane" is also a tropical cyclone located at the North Atlantic Ocean or North-east Pacific Ocean which have an average storm activity and storms typically form between May 15 and November 30. 3. A "Cyclone" is a tropical cyclone that occurs in the South Pacific and Indian Oceans.
Selected named cyclone - show another

Hurricane Katrina was a devastating and deadly Category 5 Atlantic hurricane that caused 1,836 fatalities and damages estimated between $97.4 billion to $145.5 billion in late August 2005, particularly in the city of New Orleans and its surrounding area. At the time, it was the costliest tropical cyclone on record, later tied by Hurricane Harvey in 2017. Katrina was the twelfth tropical cyclone, the fifth hurricane, and the third major hurricane of the 2005 Atlantic hurricane season. It was also the fourth-most intense Atlantic hurricane to make landfall in the contiguous United States, gauged by barometric pressure.
Katrina began on August 23, 2005, with the merger of a tropical wave and the remnants of Tropical Depression Ten. Early the following day, the depression intensified into a tropical storm and headed generally westward toward Florida. On August 25, two hours before making landfall at Hallandale Beach, it strengthened into a hurricane. After briefly weakening to tropical storm strength over southern Florida, Katrina entered the Gulf of Mexico on August 26 and rapidly intensified. The storm strengthened into a Category 5 hurricane over the warm waters of the Gulf of Mexico before weakening to a high-end Category 3 hurricane at its second landfall on August 29 over southeast Louisiana and Mississippi. (Full article...)Selected article - show another

A typhoon is a tropical cyclone that develops between 180° and 100°E in the Northern Hemisphere and which produces sustained hurricane-force winds of at least 119 km/h (74 mph). This region is referred to as the Northwestern Pacific Basin, accounting for almost one third of the world's tropical cyclones. The term hurricane refers to a tropical cyclone (again with sustained winds of at least 119 km/h (74 mph)) in the north central and northeast Pacific, and the north Atlantic. In all of the preceding regions, weaker tropical cyclones are called tropical storms. For organizational purposes, the northern Pacific Ocean is divided into three regions: the eastern (North America to 140°W), central (140°W to 180°), and western (180° to 100°E). The Regional Specialized Meteorological Center (RSMC) for tropical cyclone forecasts is in Japan, with other tropical cyclone warning centres for the northwest Pacific in Hawaii (the Joint Typhoon Warning Center), the Philippines, and Hong Kong. Although the RSMC names each system, the main name list itself is coordinated among 18 countries that have territories threatened by typhoons each year.
Within most of the northwestern Pacific, there are no official typhoon seasons as tropical cyclones form throughout the year. Like any tropical cyclone, there are several main requirements for typhoon formation and development. It must be in sufficiently warm sea surface temperatures, atmospheric instability, high humidity in the lower-to-middle levels of the troposphere, have enough Coriolis effect to develop a low pressure centre, a pre-existing low level focus or disturbance, and a low vertical wind shear. Although the majority of storms form between June and November, a few storms may occur between December and May (although tropical cyclone formation is very rare during that time). On average, the northwestern Pacific features the most numerous and intense tropical cyclones globally. Like other basins, they are steered by the subtropical ridge towards the west or northwest, with some systems recurving near and east of Japan. The Philippines receive the brunt of the landfalls, with China and Japan being less often impacted. However, some of the deadliest typhoons in history have struck China. Southern China has the longest record of typhoon impacts for the region, with a thousand-year sample via documents within their archives. Taiwan has received the wettest known typhoon on record for the northwest Pacific tropical cyclone basins. However, Vietnam recognises its typhoon season as lasting from the beginning of June through to the end of November, with an average of four to six typhoons hitting the country annually. (Full article...)Selected image - show another

Selected season - show another

The 1983 Atlantic hurricane season was the least active Atlantic hurricane season since 1930. The season officially began on June 1, 1983, and lasted until November 30, 1983. These dates conventionally delimit the period of each year when most storms form in the Atlantic basin. The season had very little activity, with only seven tropical depressions, four of which reached tropical storm strength or higher. This led to the lowest accumulated cyclone energy count since 1977.
The season began later than normal; the first tropical depression formed on July 23 and the second on July 27. Neither tropical depressions strengthened and they dissipated soon thereafter. Hurricane Alicia formed as Tropical Depression Three on August 15, quickly intensified into a hurricane on August 16 and made landfall in Texas on August 18. Alicia caused $3 billion in damage in Texas. Hurricane Barry formed on August 25, crossed Florida and strengthened into a hurricane. Barry made landfall near the Mexico–United States border, and dissipated over land on August 30. (Full article...)Related portals
Currently active tropical cyclones

Italicized basins are unofficial.
- North Atlantic (2024)
- No active systems
- East and Central Pacific (2024)
- No active systems
- West Pacific (2024)
- No active systems
- North Indian Ocean (2024)
- No active systems
- Mediterranean (2023–24)
- No active systems
- South-West Indian Ocean (2023–24)
- No active systems
- Australian region (2023–24)
- No active systems
- South Pacific (2023–24)
- No active systems
- South Atlantic (2023–24)
- No active systems
Last updated: 21:54, 8 May 2024 (UTC)
Tropical cyclone anniversaries

May 14
- 1997 - Cyclone Rhonda reached its peak intensity in the open Indian Ocean with winds of 185 km/h (115 mph).
- 2007 - Cyclone Akash (pictured) damages a total of US$982 million over in Bangladesh and Burma, also killing a total of 14.
- 2020 - Typhoon Vongfong makes landfall over Visayas, Philippines as a Category 3 typhoon.

May 15
- 1982 - Tropical Storm Claudia (pictured) affects the Solomon Islands as a weak cyclone.
- 1996 - Typhoon Bart reaches Category 4 typhoon intensity just northeast of Luzon.
- 2024 - The 2024 East Pacific hurricane season officially begins.

May 16
- 1989 - Typhoon Brenda (pictured) passed over the Philippines, causing torrential flooding that killed at least 140 people.
- 2004 - Typhoon Nida reaches peak intensity as an intense typhoon, off the coast of eastern Philippines, causing minor damage.
- 2015 - Typhoon Dolphin reaches peak intensity, impacting the Mariana Islands with $14 million in damages.
Did you know…


- …that the Joint Typhoon Warning Center considers that Typhoon Vera (pictured) of 1986 is actually two distinct systems, formed from two separated low-level circulations?
- …that Hurricane Agatha (pictured) was the strongest Pacific hurricane to make landfall in Mexico in May since records began in 1949?
- …that Cyclone Raquel (track pictured) travelled between the Australian and South Pacific basins between the 2014–15 and 2015–16 seasons, spanning both seasons in both basins?
- …that Cyclone Amphan (pictured) in 2020 was the first storm to be classified as a Super Cyclonic Storm in the Bay of Bengal since 1999?
General images - load new batch
 Image 1The aftermath of Hurricane Katrina in Gulfport, Mississippi. (from Tropical cyclone preparedness)
 Image 2Comparison between extratropical and tropical cyclones on surface analysis (from Cyclone)
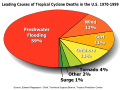 Image 3Percentages of hurricane deaths in the United States from 1970 to 1999. (from Effects of tropical cyclones)
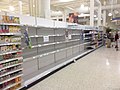 Image 4All but the most expensive bottles of water were sold out at this Publix supermarket before Hurricane Irma; in the week preceding the storm, water sold out soon after shipments arrived (from Tropical cyclone preparedness)
 Image 5Hurricane Isabel (2003)'s effect on the North Carolina Outer Banks (from Effects of tropical cyclones)
 Image 6Flooding in Port Arthur, Texas caused by Hurricane Harvey. Harvey was the wettest and second-costliest tropical cyclone in United States history. (from Effects of tropical cyclones)
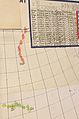 Image 8Chart with concurrent information for Hurricane Arlene and Tropical Storm Bret logged and plotted (from Tropical cyclone preparedness)
 Image 9An example of a chart for Matthew showing its five-day forecast track (from Tropical cyclone preparedness)
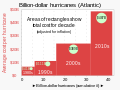 Image 10The number of $1 billion Atlantic hurricanes almost doubled from the 1980s to the 2010s, and inflation-adjusted costs have increased more than elevenfold. The increases have been attributed to climate change and to greater numbers of people moving to coastal areas. (from Effects of tropical cyclones)
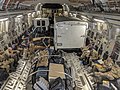 Image 11Personnel and equipment from the National Guard of the United States en route to Hurricane Florence response efforts in 2018
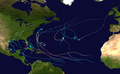
 Image 13Hurricane Catarina, a rare South Atlantic tropical cyclone viewed from the International Space Station on March 26, 2004 (from Cyclone)
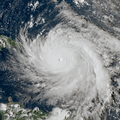
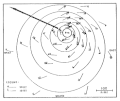 Image 15The dangerous semicircle is the upper-right corner, with the arrow marking the direction of motion of a Northern Hemisphere storm. Note that typhoons, etc. are asymmetrical, and semicircle is a convenient misnomer. (from Effects of tropical cyclones)
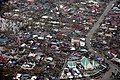 Image 16Aerial image of destroyed houses in Tacloban, following Typhoon Haiyan (from Effects of tropical cyclones)
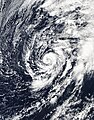
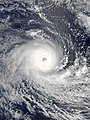
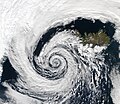 Image 19An extratropical cyclone near Iceland (from Cyclone)
- Image 21The aftermath of Hurricane Katrina in Gulfport, Mississippi. Katrina was the costliest tropical cyclone in United States history. (from Effects of tropical cyclones)
 Image 22Surface weather map of the 1935 Labor Day hurricane moving up the west coast of Florida (from Tropical cyclone observation)
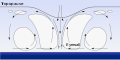 Image 23Tropical cyclones form when the energy released by the condensation of moisture in rising air causes a positive feedback loop over warm ocean waters. (from Cyclone)
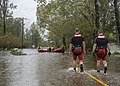 Image 25Hurricane response involves working in hazardous conditions, including contamination and electrocution hazards from floodwater.
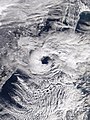
 Image 27Radar image of Hurricane Erika making landfall over Northeastern Mexico (from Tropical cyclone observation)
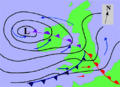 Image 28A fictitious synoptic chart of an extratropical cyclone affecting the UK and Ireland. The blue arrows between isobars indicate the direction of the wind, while the "L" symbol denotes the centre of the "low". Note the occluded, cold and warm frontal boundaries. (from Cyclone)
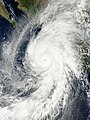
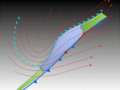 Image 31The initial extratropical low-pressure area forms at the location of the red dot on the image. It is usually perpendicular (at a right angle to) the leaf-like cloud formation seen on satellite during the early stage of cyclogenesis. The location of the axis of the upper level jet stream is in light blue. (from Cyclone)
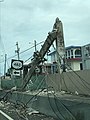 Image 33Broken concrete utility pole in Puerto Rico after Hurricane Maria in 2017, which ranks fourth in costliest US tropical cyclones. (from Effects of tropical cyclones)


_(50).jpg)
.png)


.jpg)


.jpg)


.jpg)


.jpg)


 Featured list - show another

The 2003 Atlantic hurricane season was an active Atlantic hurricane season with tropical activity before and after the official bounds of the season – the first such occurrence in 33 years. The season officially began on June 1, 2003 and ended on November 30. However, a pre-season storm, Tropical Storm Ana, led to the season starting on April 20, and storm activity continued through December 11. The timeline includes information which was not operationally released, meaning that information from post-storm reviews by the National Hurricane Center, such as information on a storm that was not operationally warned upon, has been included. This timeline documents tropical cyclone formations, strengthening, weakening, landfalls, extratropical transitions, as well as dissipations during the season.
This season had 21 tropical depressions, of which, 16 became named storms. Of these, 7 strengthened into hurricanes with 3 intensifying into major hurricanes. Hurricane Fabian, Hurricane Isabel, and Hurricane Juan had their names retired due to the impact caused in Bermuda, the eastern United States, and Nova Scotia respectively. Both Fabian and Juan were the worst hurricanes to hit their respective areas, causing $450 million in damages and 16 fatalities. Hurricane Isabel was the strongest, deadliest, and costliest storm of the season. Isabel peaked as a Category 5 hurricane over the open waters of the Atlantic; however, it weakened to a Category 2 before impacting the east coast of the United States, causing $3.6 billion in damages and 51 fatalities. (Full article...)Topics
Subcategories

Related WikiProjects
WikiProject Tropical cyclones is the central point of coordination for Wikipedia's coverage of tropical cyclones. Feel free to help!
WikiProject Weather is the main center point of coordination for Wikipedia's coverage of meteorology in general, and the parent project of WikiProject Tropical cyclones. Three other branches of WikiProject Weather in particular share significant overlaps with WikiProject Tropical cyclones:
- The Non-tropical storms task force coordinates most of Wikipedia's coverage on extratropical cyclones, which tropical cyclones often transition into near the end of their lifespan.
- The Floods task force takes on the scope of flooding events all over the world, with rainfall from tropical cyclones a significant factor in many of them.
- WikiProject Severe weather documents the effects of extreme weather such as tornadoes, which landfalling tropical cyclones can produce.
Things you can do
 |
Here are some tasks awaiting attention:
|
Wikimedia
The following Wikimedia Foundation sister projects provide more on this subject:
-
 Commons
Free media repository -
 Wikibooks
Free textbooks and manuals -
 Wikidata
Free knowledge base -
 Wikinews
Free-content news -
 Wikiquote
Collection of quotations -
 Wikisource
Free-content library -
 Wikiversity
Free learning tools -
 Wikivoyage
Free travel guide -
 Wiktionary
Dictionary and thesaurus


