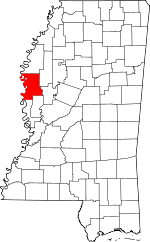
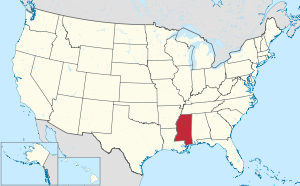
Washington County is a county located in the U.S. state of Mississippi. As of the 2020 census, the population was 44,922.[1] Its county seat is Greenville.[2] The county is named in honor of the first president of the United States, George Washington. It is located next to the Arkansas border.
Washington County | |
|---|---|
 | |
 Location within the U.S. state of Mississippi | |
 Mississippi's location within the U.S. | |
| Coordinates: 33°17′N 90°57′W | |
| Country | |
| State | |
| Founded | 1827 |
| Named for | George Washington |
| Seat | Greenville |
| Largest city | Greenville |
| Area | |
| • Total | 761 sq mi (1,970 km2) |
| • Land | 725 sq mi (1,880 km2) |
| • Water | 36 sq mi (90 km2) 4.8% |
| Population (2020) | |
| • Total | 44,922 |
| • Density | 59/sq mi (23/km2) |
| Time zone | UTC−6 (Central) |
| • Summer (DST) | UTC−5 (CDT) |
| Congressional district | 2nd |
| Website | www |
The Greenville, MS Micropolitan Statistical Area includes all of Washington County. It is located in the Mississippi Delta.
History
This section needs additional citations for verification. (October 2022) |
Located in the Mississippi Delta, Washington County was first developed for cotton cultivation in the antebellum years. Most plantations were developed to have access to the rivers, which were the major transportation routes. Cotton was based on slave labor.
In an 1860 Census,[3] Washington County had an enslaved population of 92.3%, the second-highest anywhere in the country, only behind Issaquena County, Mississippi (92.5%). In the period from 1877 to 1950, Washington County had 12 documented lynchings of African Americans.[4] Most occurred around the turn of the 20th century, as part of white imposition of Jim Crow conditions and suppression of black voting.
Geography
According to the U.S. Census Bureau, the county has a total area of 761 square miles (1,970 km2), of which 725 square miles (1,880 km2) is land and 36 square miles (93 km2) (4.8%) is water.[5]
Adjacent counties
- Bolivar County (north)
- Sunflower County (northeast)
- Humphreys County (east)
- Sharkey County (southeast)
- Issaquena County (south)
- Chicot County, Arkansas (west)
- Desha County, Arkansas (northwest)
National protected areas
Demographics
| Census | Pop. | Note | %± |
|---|---|---|---|
| 1830 | 1,976 | — | |
| 1840 | 7,287 | 268.8% | |
| 1850 | 8,389 | 15.1% | |
| 1860 | 15,679 | 86.9% | |
| 1870 | 14,569 | −7.1% | |
| 1880 | 25,367 | 74.1% | |
| 1890 | 40,414 | 59.3% | |
| 1900 | 49,216 | 21.8% | |
| 1910 | 48,933 | −0.6% | |
| 1920 | 51,092 | 4.4% | |
| 1930 | 54,310 | 6.3% | |
| 1940 | 67,576 | 24.4% | |
| 1950 | 70,504 | 4.3% | |
| 1960 | 78,638 | 11.5% | |
| 1970 | 70,581 | −10.2% | |
| 1980 | 72,344 | 2.5% | |
| 1990 | 67,935 | −6.1% | |
| 2000 | 62,977 | −7.3% | |
| 2010 | 51,137 | −18.8% | |
| 2020 | 44,922 | −12.2% | |
| 2023 (est.) | 41,946 | [6] | −6.6% |
| U.S. Decennial Census[7] 1790-1960[8] 1900-1990[9] 1990-2000[10] 2010-2013[11] | |||
2020 census
| Race | Num. | Perc. |
|---|---|---|
| White | 11,180 | 24.89% |
| Black or African American | 31,919 | 71.05% |
| Native American | 48 | 0.11% |
| Asian | 302 | 0.67% |
| Pacific Islander | 5 | 0.01% |
| Other/Mixed | 884 | 1.97% |
| Hispanic or Latino | 584 | 1.3% |
As of the 2020 United States Census, there were 44,922 people, 17,988 households, and 11,232 families residing in the county.
2010 census
As of the 2010 United States Census, there were 51,137 people living in the county. 71.3% were Black or African American, 27.0% White, 0.6% Asian, 0.1% Native American, 0.4% of some other race and 0.6% of two or more races. 1.0% were Hispanic or Latino (of any race).
2000 census
As of the census[13] of 2000, there were 62,977 people, 22,158 households, and 15,931 families living in the county. The population density was 87 people per square mile (34 people/km2). There were 24,381 housing units at an average density of 34 units per square mile (13 units/km2). The racial makeup of the county was 69.57% Black or African American, 33.97% White, 0.09% Native American, 0.53% Asian, 0.02% Pacific Islander, 0.25% from other races, and 0.57% from two or more races. 0.84% of the population were Hispanic or Latino of any race.
According to the census[13] of 2000, the largest ancestry groups in Washington County were African 69.57%, English 21.4%, Scottish 8.2% and Scots-Irish 3.1%
Washington County by 2005 was 67.2% African-American in population. Latinos constituted 1.1% of the population in the county while non-Hispanic whites made up 31.7% of the population.
As of the census[13] of 2000, there were 22,158 households, out of which 36.30% had children under the age of 18 living with them, 40.60% were married couples living together, 26.00% had a female householder with no husband present, and 28.10% were non-families. 24.60% of all households were made up of individuals, and 10.00% had someone living alone who was 65 years of age or older. The average household size was 2.80 and the average family size was 3.35.
In the county, the population was spread out, with 31.50% under the age of 18, 10.10% from 18 to 24, 26.50% from 25 to 44, 20.50% from 45 to 64, and 11.50% who were 65 years of age or older. The median age was 32 years. For every 100 females there were 87.70 males. For every 100 females age 18 and over, there were 80.30 males.
The median income for a household in the county was $25,757, and the median income for a family was $30,324. Males had a median income of $28,266 versus $20,223 for females. The per capita income for the county was $13,430. About 24.90% of families and 29.20% of the population were below the poverty line, including 38.40% of those under age 18 and 24.60% of those age 65 or over.
Washington County's demographics are rooted in the region's mid-nineteenth-century ascendance in cotton production and, accordingly, importation of people as slaves. According to the historian Sven Beckert, the county had "more than ten slaves for every white inhabitant" in 1840, and "every white family in the county held on average more than eighty slaves" by 1850.[14]
1990 census
As of the census of 1990, there were 67,935 people living in the county. The racial makeup of the county was 57.46% (39,035) Black or African American, 41.47% (28,174) White, 0.08% (53) Native American, 0.36% (244) Asian, and 0.02% (13) from other races. 0.61% (416) were Hispanic or Latino of any race.
Transportation
Major highways
Airport
Mid Delta Regional Airport, owned by the City of Greenville, is located in an unincorporated area in the county.[15]
Education
- Public School Districts[16]
- Private Schools
- Deer Creek School (Arcola)
- Greenville Christian School
- Saint Joseph Catholic High School (Greenville)
- Washington School (Greenville)
Pillow Academy in unincorporated Leflore County, near Greenwood, enrolls some students from Washington County.[17] It originally was a segregation academy.[18]
Communities
Cities
- Greenville (third and current county seat)
- Hollandale
- Leland
Towns
Census-designated places
Unincorporated communities
Ghost towns
- New Mexico (first county seat)
- Port Anderson
- Princeton (second county seat)
Politics
| Year | Republican | Democratic | Third party(ies) | |||
|---|---|---|---|---|---|---|
| No. | % | No. | % | No. | % | |
| 2020 | 5,300 | 29.39% | 12,503 | 69.33% | 231 | 1.28% |
| 2016 | 5,244 | 31.17% | 11,380 | 67.64% | 201 | 1.19% |
| 2012 | 5,651 | 28.66% | 13,981 | 70.92% | 83 | 0.42% |
| 2008 | 6,347 | 32.41% | 13,148 | 67.14% | 88 | 0.45% |
| 2004 | 7,731 | 39.45% | 11,569 | 59.03% | 297 | 1.52% |
| 2000 | 7,367 | 40.20% | 10,405 | 56.77% | 556 | 3.03% |
| 1996 | 6,762 | 38.77% | 10,053 | 57.64% | 625 | 3.58% |
| 1992 | 7,598 | 38.59% | 10,588 | 53.78% | 1,503 | 7.63% |
| 1988 | 10,229 | 49.45% | 10,222 | 49.41% | 236 | 1.14% |
| 1984 | 12,454 | 53.19% | 10,617 | 45.34% | 343 | 1.46% |
| 1980 | 8,978 | 44.63% | 10,722 | 53.30% | 417 | 2.07% |
| 1976 | 7,474 | 41.18% | 9,650 | 53.17% | 1,025 | 5.65% |
| 1972 | 9,634 | 63.78% | 4,623 | 30.61% | 847 | 5.61% |
| 1968 | 3,500 | 22.85% | 5,520 | 36.03% | 6,300 | 41.12% |
| 1964 | 5,611 | 73.68% | 2,004 | 26.32% | 0 | 0.00% |
| 1960 | 2,292 | 34.44% | 3,105 | 46.66% | 1,258 | 18.90% |
| 1956 | 1,973 | 35.94% | 2,722 | 49.58% | 795 | 14.48% |
| 1952 | 3,301 | 55.77% | 2,618 | 44.23% | 0 | 0.00% |
| 1948 | 271 | 9.10% | 260 | 8.73% | 2,448 | 82.18% |
| 1944 | 454 | 18.41% | 2,012 | 81.59% | 0 | 0.00% |
| 1940 | 292 | 11.05% | 2,349 | 88.91% | 1 | 0.04% |
| 1936 | 94 | 4.19% | 2,143 | 95.63% | 4 | 0.18% |
| 1932 | 100 | 5.57% | 1,691 | 94.21% | 4 | 0.22% |
| 1928 | 246 | 14.12% | 1,496 | 85.88% | 0 | 0.00% |
| 1924 | 143 | 10.06% | 1,277 | 89.80% | 2 | 0.14% |
| 1920 | 60 | 7.17% | 776 | 92.71% | 1 | 0.12% |
| 1916 | 47 | 5.30% | 836 | 94.36% | 3 | 0.34% |
| 1912 | 20 | 2.42% | 731 | 88.39% | 76 | 9.19% |
See also
Footnotes
Further reading
Wikiwand in your browser!
Seamless Wikipedia browsing. On steroids.
Every time you click a link to Wikipedia, Wiktionary or Wikiquote in your browser's search results, it will show the modern Wikiwand interface.
Wikiwand extension is a five stars, simple, with minimum permission required to keep your browsing private, safe and transparent.
