Hammersmith South was a borough constituency in the Metropolitan Borough of Hammersmith in west London . It returned one Member of Parliament (MP) to the House of Commons of the Parliament of the United Kingdom , elected by the first-past-the-post system.
Quick Facts County, 1918–1955 ...
Close
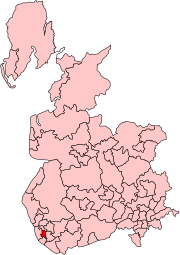
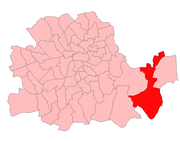
Hammersmith South in the Parliamentary County of London 1918-50 Hammersmith South in the Parliamentary County of London 1950-55 A map showing the wards of Hammersmith Metropolitan Borough as they appeared in 1916. The constituency was created when the Hammersmith constituency was divided for the 1918 general election . It was abolished for the 1955 general election .
1918–1950 : The Metropolitan Borough of Hammersmith wards numbers one, two and three.
1950–1955 : The Metropolitan Borough of Hammersmith wards of Addison, Broadway, Brook Green, Grove, Olympia, Ravenscourt, and St Stephen's.
More information Election, Member ...
Close
Elections in the 1910s
More information Party, Candidate ...
Close
Elections in the 1920s
William Bull More information Party, Candidate ...
Close
More information Party, Candidate ...
Close
Christopher Addison More information Party, Candidate ...
Close
More information Party, Candidate ...
Close
Elections in the 1930s
More information Party, Candidate ...
Close
More information Party, Candidate ...
Close
Elections in the 1940s
More information Party, Candidate ...
Close
More information Party, Candidate ...
Close
Elections in the 1950s
More information Party, Candidate ...
Close
More information Party, Candidate ...
Close
British parliamentary election results, 1950-1973 by FWS Craig
The Times' Guide to the House of Commons . 1950.
British parliamentary election results, 1950-1973 by FWS Craig
The Times' Guide to the House of Commons . 1951.
Leigh Rayment's Historical List of MPs – Constituencies beginning with "H" (part 1)


.jpg)