File:Temperature_Bar_Chart_Africa--1901-2020--2021-07-14.png
From Wikipedia, the free encyclopedia
Size of this preview: 800 × 450 pixels. Other resolutions: 320 × 180 pixels | 640 × 360 pixels | 1,024 × 576 pixels | 1,280 × 720 pixels | 2,560 × 1,440 pixels | 3,780 × 2,126 pixels.
Original file (3,780 × 2,126 pixels, file size: 59 KB, MIME type: image/png)
| This is a file from the Wikimedia Commons. Information from its description page there is shown below. Commons is a freely licensed media file repository. You can help. |
Summary
| DescriptionTemperature Bar Chart Africa--1901-2020--2021-07-14.png |
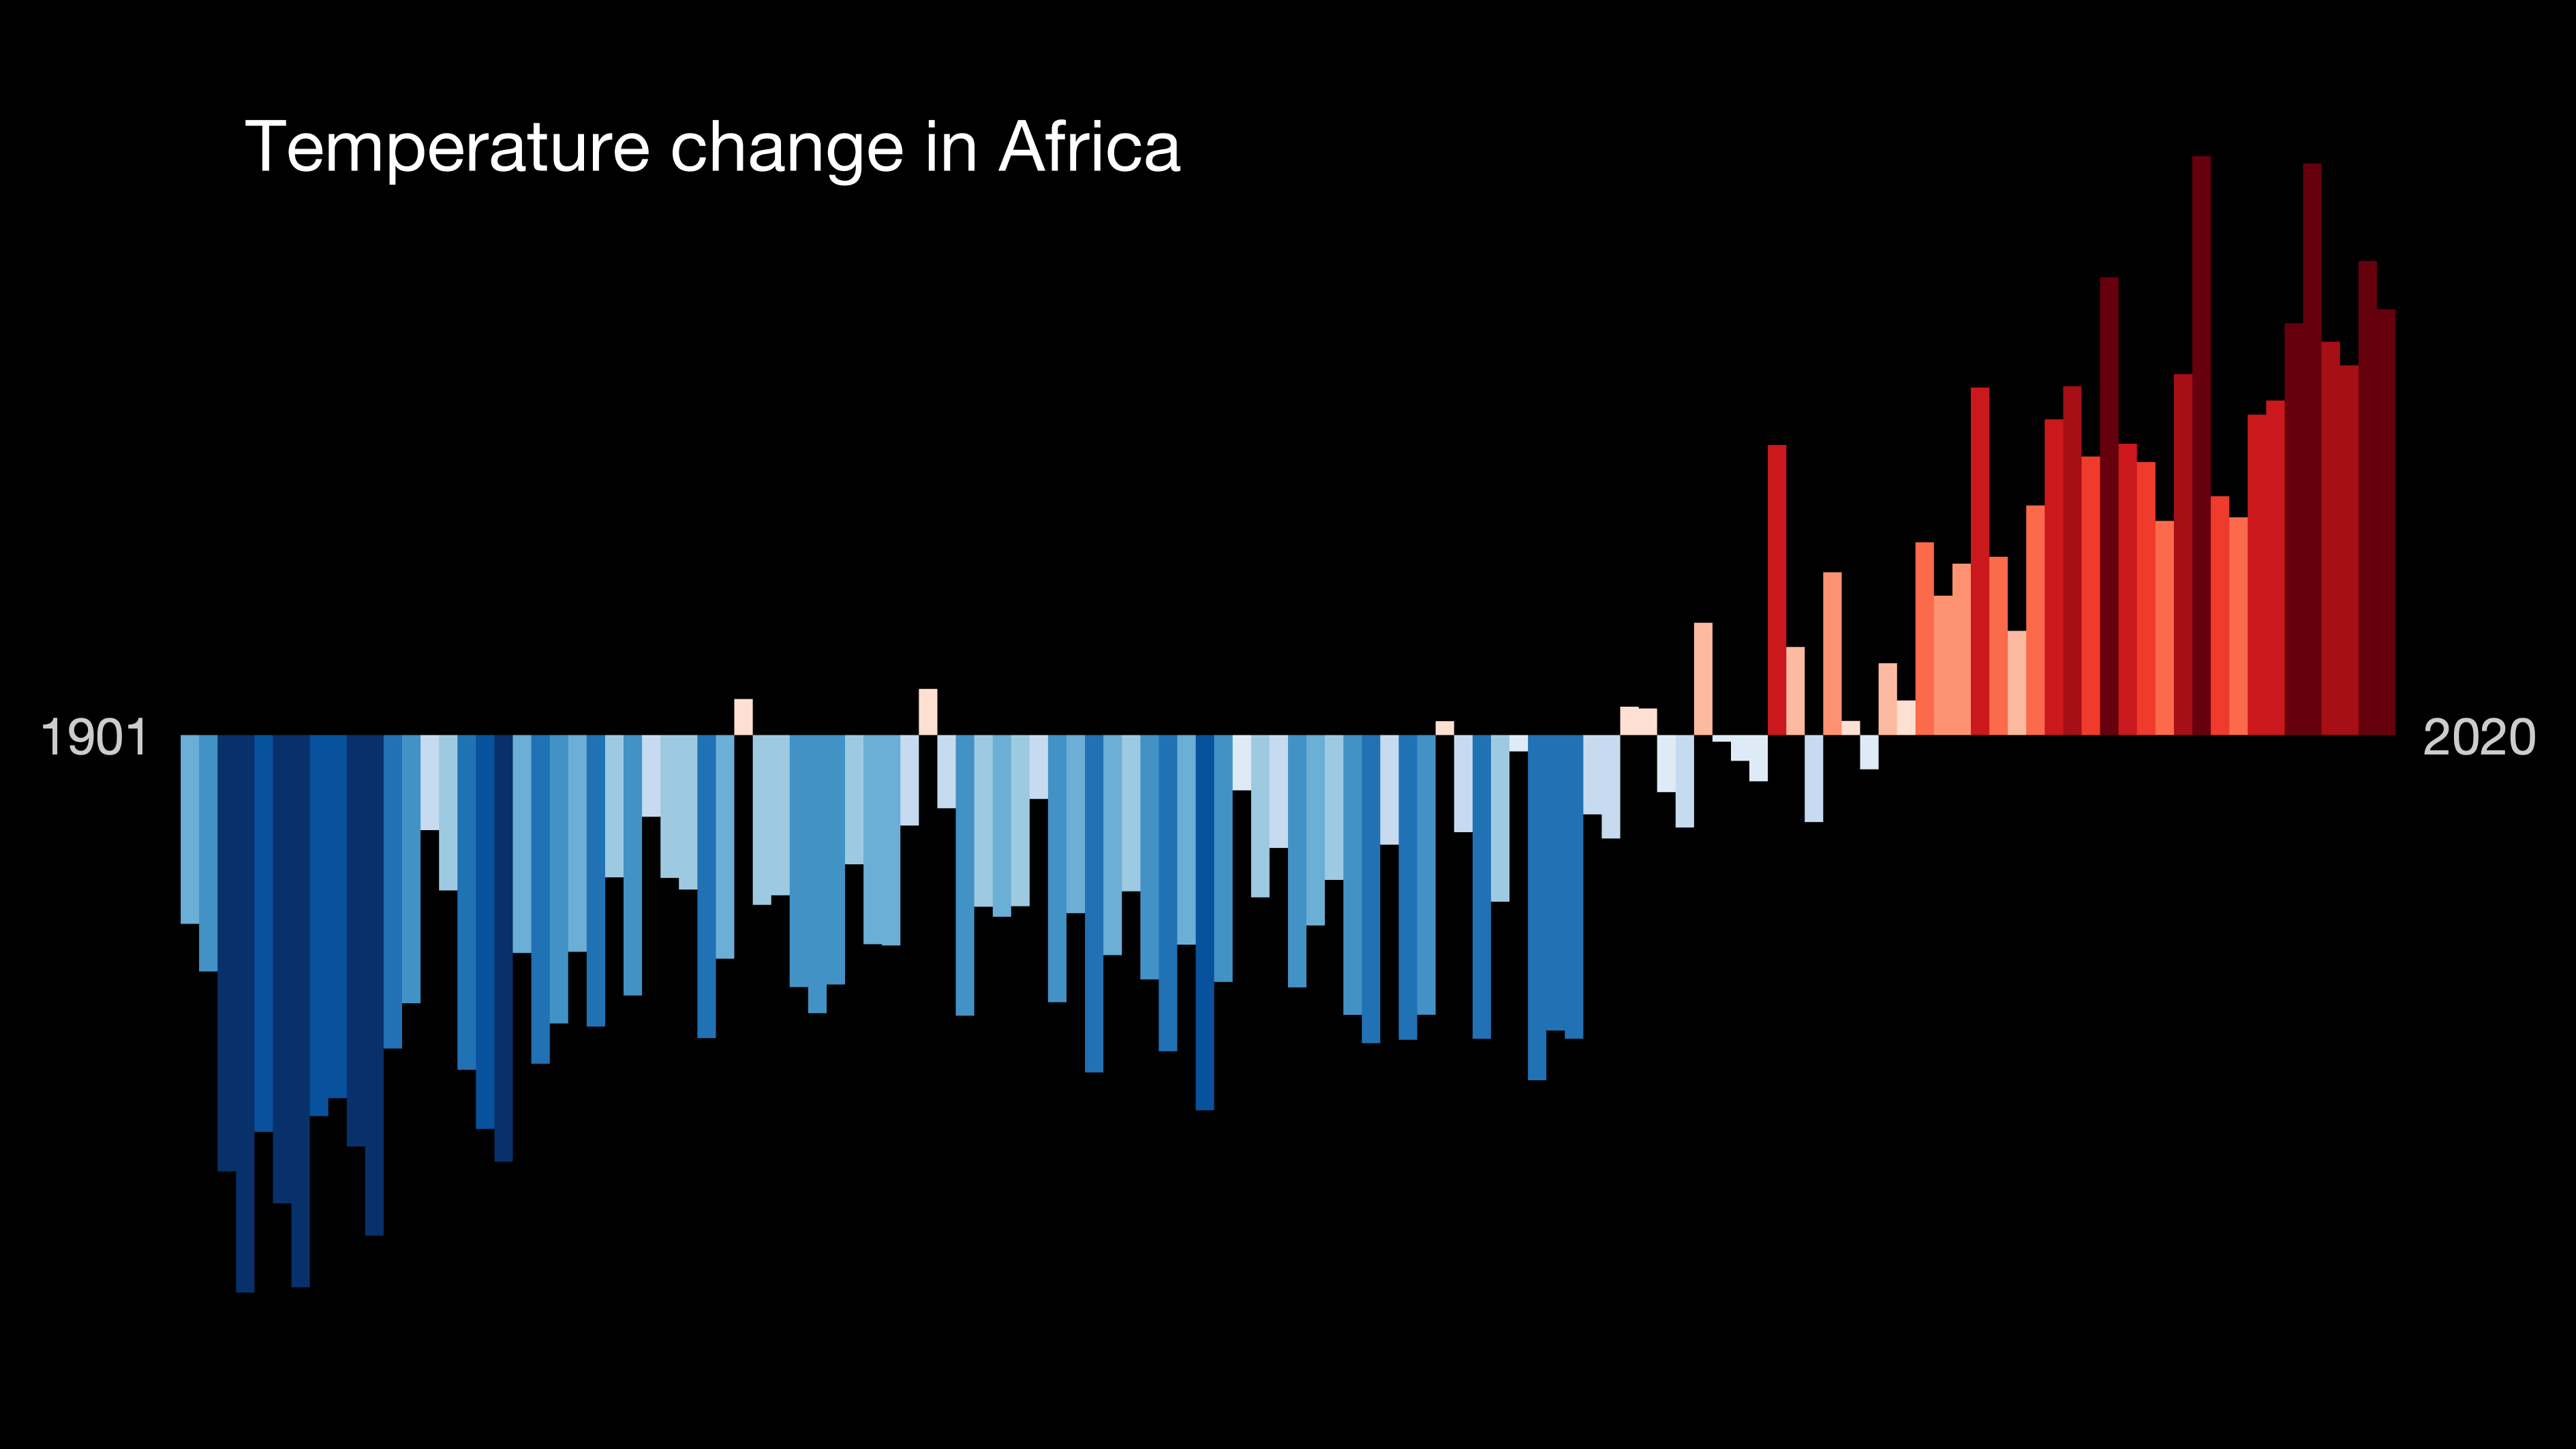
English: This bar chart is a visual representation of the change in temperature in the past 100+ years. Each stripe represents the temperature averaged over a year. The average temperature in 1971–2000 is set as the boundary between blue and red colors, and the color scale varies from ±2.6 standard deviations of the annual average temperatures between the years mentioned in the file name. Data source: Berkeley Earth. For more information visit https://showyourstripes.info/faq
Français : Graphique à barres, décrivant visuellement le changement de température durant un siècle : Chaque bande représente la température moyenne sur une année. La température moyenne de 1971 à 2000 est définie comme la limite entre les couleurs bleue et rouge, et l'échelle de couleurs varie de ± 2,6 écarts-types des températures moyennes annuelles entre les années (mentionnées dans le nom du fichier). Source : Berkeley Earth / https://showyourstripes.info/faq |
| Date | |
| Source | https://showyourstripes.info/ |
| Author | Ed Hawkins, University of Reading |
Licensing
This file is licensed under the Creative Commons Attribution 4.0 International license.
- You are free:
- to share – to copy, distribute and transmit the work
- to remix – to adapt the work
- Under the following conditions:
- attribution – You must give appropriate credit, provide a link to the license, and indicate if changes were made. You may do so in any reasonable manner, but not in any way that suggests the licensor endorses you or your use.
Captions
Temperature bar chart for Africa
Graphique montrant le changement de température en Afrique entre 1901 et 2021, la couleur rouge étant plus chaude et le bleu plus froid que la moyenne (la température moyenne (1971-2000) = la limite entre les couleurs bleue et rouge).
Items portrayed in this file
depicts
1 July 2021
image/png
File history
Click on a date/time to view the file as it appeared at that time.
| Date/Time | Thumbnail | Dimensions | User | Comment | |
|---|---|---|---|---|---|
| current | 08:42, 14 July 2021 | | 3,780 × 2,126 (59 KB) | DiagramLover | Uploaded a work by Ed Hawkins, University of Reading from https://showyourstripes.info/ with UploadWizard |
File usage
The following pages on the English Wikipedia use this file (pages on other projects are not listed):
Global file usage
The following other wikis use this file:
- Usage on af.wikipedia.org
- Usage on fr.wikipedia.org
- Usage on hy.wikipedia.org
- Usage on sl.wikipedia.org
- Usage on sr.wikipedia.org
- Usage on zh.wikipedia.org
Metadata
This file contains additional information, probably added from the digital camera or scanner used to create or digitize it.
If the file has been modified from its original state, some details may not fully reflect the modified file.
| Horizontal resolution | 118.11 dpc |
|---|---|
| Vertical resolution | 118.11 dpc |
| File change date and time | 11:11, 2 June 2021 |
| Software used | |
| Date and time of digitizing |
|