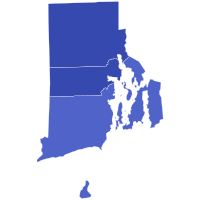
The 2016 United States presidential election in Rhode Island took place on November 8, 2016, as part of the 2016 United States presidential election in which all 50 states plus the District of Columbia participated. Rhode Island voters chose four electors to represent them in the Electoral College via a popular vote.
| ||||||||||||||||||||||||||
| Turnout | 60.2%[1] | |||||||||||||||||||||||||
|---|---|---|---|---|---|---|---|---|---|---|---|---|---|---|---|---|---|---|---|---|---|---|---|---|---|---|
| ||||||||||||||||||||||||||
| ||||||||||||||||||||||||||
 | ||||||||||||||||||||||||||

Although a "safe blue state", Trump improved on Mitt Romney's performance four years prior; Romney had lost the state by 27 points, whereas Trump lost by less than 16 points. This makes it the smallest win by a Democrat since Democratic nominee Michael Dukakis in 1988. In 2012, Romney won only three towns in Rhode Island.[2] Donald Trump won 14 towns and even narrowly flipped Kent County, making this the first time a Republican has won a county in the state since Ronald Reagan in 1984.
Primaries
Democratic primary
Four candidates appeared on the Democratic presidential primary ballot:[3]
- Bernie Sanders
- Hillary Clinton
- Rocky De La Fuente
- Mark Stewart
| Rhode Island Democratic primary, April 26, 2016 | |||||
|---|---|---|---|---|---|
| Candidate | Popular vote | Estimated delegates | |||
| Count | Percentage | Pledged | Unpledged | Total | |
| Bernie Sanders | 66,993 | 54.71% | 13 | 0 | 13 |
| Hillary Clinton | 52,749 | 43.08% | 11 | 9 | 20 |
| Mark Stewart | 236 | 0.19% | 0 | 0 | 0 |
| Rocky De La Fuente | 145 | 0.12% | 0 | 0 | 0 |
| Write-in | 673 | 0.55% | 0 | 0 | 0 |
| Uncommitted | 1,662 | 1.36% | 0 | 0 | 0 |
| Total | 122,458 | 100% | 24 | 9 | 33 |
| Source: The Green Papers, Rhode Island Board of Elections and Rhode Island Democratic Party - Official Pledged Delegates Allocation | |||||
Republican primary
Three candidates appeared on the Republican presidential primary ballot:[3]
| Candidate | Votes | Percentage | Actual delegate count | ||
|---|---|---|---|---|---|
| Bound | Unbound | Total | |||
| Donald Trump | 39,221 | 63.7% | 12 | 0 | 12 |
| John Kasich | 14,963 | 24.3% | 5 | 0 | 5 |
| Ted Cruz | 6,416 | 10.4% | 2 | 0 | 2 |
| Uncommitted | 417 | 0.7% | 0 | 0 | 0 |
| Marco Rubio (withdrawn) | 382 | 0.6% | 0 | 0 | 0 |
| Write-in | 215 | 0.3% | 0 | 0 | 0 |
| Unprojected delegates: | 0 | 0 | 0 | ||
| Total: | 61,614 | 100.00% | 19 | 0 | 19 |
| Source: Rhode Island Board of Elections | |||||
General election
Predictions
| Source | Ranking | As of |
|---|---|---|
| Los Angeles Times[4] | Safe D | November 6, 2016 |
| CNN[5] | Safe D | November 4, 2016 |
| Cook Political Report[6] | Safe D | November 7, 2016 |
| Electoral-vote.com[7] | Safe D | November 8, 2016 |
| Rothenberg Political Report[8] | Safe D | November 7, 2016 |
| Sabato's Crystal Ball[9] | Safe D | November 7, 2016 |
| RealClearPolitics[10] | Likely D | November 8, 2016 |
| Fox News[11] | Safe D | November 7, 2016 |
Results
| Party | Candidate | Votes | % | |
|---|---|---|---|---|
| Democratic | Hillary Clinton | 252,525 | 54.41% | |
| Republican | Donald Trump | 180,543 | 38.90% | |
| Libertarian | Gary Johnson | 14,746 | 3.18% | |
| Green | Jill Stein | 6,220 | 1.34% | |
| Write-in | Evan McMullin | 759 | 0.16% | |
| American Delta | Rocky De La Fuente | 671 | 0.14% | |
| Write-in | Mike Maturen | 46 | 0.01% | |
| Write-in | Darrell Castle | 30 | 0.01% | |
| Write-in | Other write-ins | 8,604 | 1.85% | |
| Total votes | 464,144 | 100.00% | ||
Results by county
| County | Hillary Clinton Democratic |
Donald Trump Republican |
Various candidates Other parties |
Margin | Total votes cast | ||||
|---|---|---|---|---|---|---|---|---|---|
| # | % | # | % | # | % | # | % | ||
| Bristol | 14,609 | 57.35% | 8,965 | 35.19% | 1,901 | 7.46% | 5,644 | 22.16% | 25,475 |
| Kent | 37,788 | 46.05% | 38,336 | 46.72% | 5,929 | 7.23% | -548 | -0.67% | 82,053 |
| Newport | 22,851 | 55.67% | 15,077 | 36.73% | 3,117 | 7.60% | 7,774 | 18.94% | 41,045 |
| Providence | 142,899 | 57.51% | 90,882 | 36.58% | 14,693 | 5.91% | 52,017 | 20.93% | 248,474 |
| Washington | 33,741 | 50.84% | 27,230 | 41.03% | 5,398 | 8.13% | 6,511 | 9.81% | 66,369 |
| Totals | 252,525 | 54.41% | 180,543 | 38.90% | 31,076 | 6.69% | 71,982 | 15.51% | 464,144 |
Counties that flipped from Democratic to Republican
Results by congressional district
Clinton won both congressional districts.[15]
| District | Clinton | Trump | Representative |
|---|---|---|---|
| 1st | 60.5% | 34.9% | David Cicilline |
| 2nd | 51.1% | 44.02% | James Langevin |
Results by Municipality

Analysis
Donald Trump flipped several municipalities that had not voted for a Republican presidential candidate since the 1980s including, Burrillville, Coventry, Exeter, Foster, Glocester, Hopkinton, Johnston, Lincoln, North Smithfield, Richmond, Smithfield, and West Warwick. Meanwhile, Hillary Clinton was able to flip East Greenwich which voted for Mitt Romney in 2012.
See also
References
External links
Wikiwand in your browser!
Seamless Wikipedia browsing. On steroids.
Every time you click a link to Wikipedia, Wiktionary or Wikiquote in your browser's search results, it will show the modern Wikiwand interface.
Wikiwand extension is a five stars, simple, with minimum permission required to keep your browsing private, safe and transparent.


