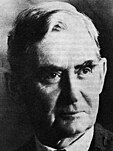
General elections were held in South Africa on 20 October 1915 to elect the 130 members of the House of Assembly. This was the second Union Parliament. The governing South African Party (SAP) of General Louis Botha emerged from the elections as the largest party, but did not receive an overall majority.
| |||||||||||||||||||||||||||||||||||||||||||||||||||||||||||||||||
All 130 seats in the House of Assembly 66 seats needed for a majority | |||||||||||||||||||||||||||||||||||||||||||||||||||||||||||||||||
|---|---|---|---|---|---|---|---|---|---|---|---|---|---|---|---|---|---|---|---|---|---|---|---|---|---|---|---|---|---|---|---|---|---|---|---|---|---|---|---|---|---|---|---|---|---|---|---|---|---|---|---|---|---|---|---|---|---|---|---|---|---|---|---|---|---|
| Registered | 365,307 | ||||||||||||||||||||||||||||||||||||||||||||||||||||||||||||||||
| Turnout | 71.57% | ||||||||||||||||||||||||||||||||||||||||||||||||||||||||||||||||
| |||||||||||||||||||||||||||||||||||||||||||||||||||||||||||||||||
 Results by province | |||||||||||||||||||||||||||||||||||||||||||||||||||||||||||||||||
| |||||||||||||||||||||||||||||||||||||||||||||||||||||||||||||||||
Botha formed a minority government, which survived with some parliamentary support from the official opposition Unionist Party.[1]
The South Africa Act 1909 had provided for a delimitation commission to define the boundaries for each electoral division. The representation by province, under the second delimitation report of 1913, is set out in the table below. The figures in brackets are the number of electoral divisions in the previous (1910) delimitation. If there is no figure in brackets then the number was unchanged.[2]
| Provinces | Cape | Natal | Orange Free State | Transvaal | Total |
|---|---|---|---|---|---|
| Divisions | 51 | 17 | 17 | 45 (36) | 130 (121) |
Since the last general election, the National Party (NP) had split away from the South African Party (SAP). The formal foundation of the new party had been in 1914.
Eight of the 130 seats were uncontested. There were unopposed returns for 5 Unionist Party, 2 SAP and 1 NP candidates.
In the 122 contested constituencies, the candidates nominated included 86 SAP, 83 NP, 39 Unionist and 49 Labour.[3]
General Botha stood for a policy of conciliation between Afrikaans and English speaking white people. The SAP was mostly supported by moderates of both races. General Hertzog led a republican party which supported a two streams policy – the two white races developing separately. The Unionists were anxious to maintain the imperial connection. The Unionists accordingly preferred the continuation in power of the SAP to the prospect of an NP government.[4]
The vote totals in the table below may not give a complete picture of the balance of political opinion, because of unopposed elections (where no votes were cast) and because most contested seats were not fought by a candidate from all major parties.
The 27 NP candidates elected represented three of the four provinces - 7 from Cape Province, 16 from the Orange Free State and 4 from Transvaal.[5]
 | |||||
|---|---|---|---|---|---|
| Party | Votes | % | Seats | +/– | |
| South African Party | 94,285 | 36.67 | 54 | –12 | |
| National Party | 75,623 | 29.41 | 27 | New | |
| Unionist Party | 49,917 | 19.42 | 39 | +3 | |
| Labour Party | 24,755 | 9.63 | 4 | +1 | |
| Socialist League | 140 | 0.05 | 0 | New | |
| Independents | 12,383 | 4.82 | 6 | –10 | |
| Total | 257,103 | 100.00 | 130 | +9 | |
| Valid votes | 257,103 | 98.34 | |||
| Invalid/blank votes | 4,330 | 1.66 | |||
| Total votes | 261,433 | 100.00 | |||
| Registered voters/turnout | 365,307 | 71.57 | |||
| Source: Nohlen et al.[6] | |||||
Wikiwand in your browser!
Seamless Wikipedia browsing. On steroids.
Every time you click a link to Wikipedia, Wiktionary or Wikiquote in your browser's search results, it will show the modern Wikiwand interface.
Wikiwand extension is a five stars, simple, with minimum permission required to keep your browsing private, safe and transparent.


