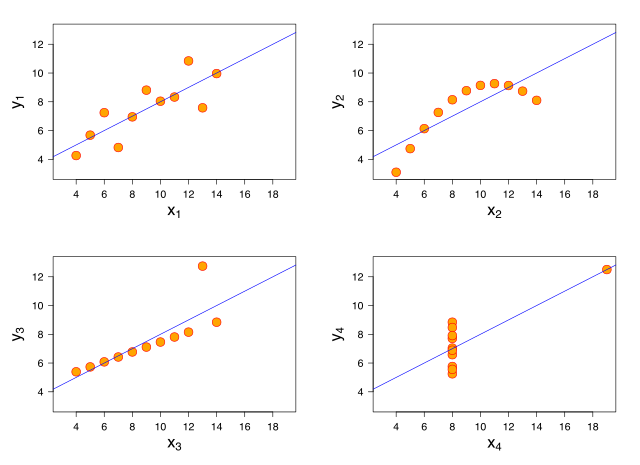
安斯庫姆四重奏
由统计学家弗朗西斯·安斯库姆所构造的4组数据 来自维基百科,自由的百科全书
安斯庫姆四重奏(Anscombe's quartet)是四組基本的統計特性一致的數據,但由它們繪製出的圖表則截然不同。每一組數據都包括了11個(x,y)點。這四組數據由統計學家弗朗西斯·安斯庫姆(Francis Anscombe)於1973年構造,他的目的是用來說明在分析數據前先繪製圖表的重要性,以及離群值對統計的影響之大。

這四組數據的共同統計特性如下:
在四幅圖中,由第一組數據繪製的圖表(左上圖)是看起來最「正常」的,可以看出兩個隨機變量之間的相關性。從第二組數據的圖表(右上圖)則可以明顯地看出兩個隨機變量間的關係是非線性的。第三組中(左下圖),雖然存在着線性關係,但由於一個離群值的存在,改變了線性回歸線,也使得相關係數從1降至0.81。最後,在第四個例子中(右下圖),儘管兩個隨機變量間沒有線性關係,但僅僅由於一個離群值的存在就使得相關係數變得很高。
愛德華·塔夫特(Edward Tufte)在他所著的《圖表設計的現代主義革命》(The Visual Display of Quantitative Information)一書的第一頁中,就使用安斯庫姆四重奏來說明繪製數據圖表的重要性。
四組數據的具體取值如下所示。其中前三組數據的x值都相同。
| 一 | 二 | 三 | 四 | ||||
|---|---|---|---|---|---|---|---|
| x | y | x | y | x | y | x | y |
| 10.0 | 8.04 | 10.0 | 9.14 | 10.0 | 7.46 | 8.0 | 6.58 |
| 8.0 | 6.95 | 8.0 | 8.14 | 8.0 | 6.77 | 8.0 | 5.76 |
| 13.0 | 7.58 | 13.0 | 8.74 | 13.0 | 12.74 | 8.0 | 7.71 |
| 9.0 | 8.81 | 9.0 | 8.77 | 9.0 | 7.11 | 8.0 | 8.84 |
| 11.0 | 8.33 | 11.0 | 9.26 | 11.0 | 7.81 | 8.0 | 8.47 |
| 14.0 | 9.96 | 14.0 | 8.10 | 14.0 | 8.84 | 8.0 | 7.04 |
| 6.0 | 7.24 | 6.0 | 6.13 | 6.0 | 6.08 | 8.0 | 5.25 |
| 4.0 | 4.26 | 4.0 | 3.10 | 4.0 | 5.39 | 19.0 | 12.50 |
| 12.0 | 10.84 | 12.0 | 9.13 | 12.0 | 8.15 | 8.0 | 5.56 |
| 7.0 | 4.82 | 7.0 | 7.26 | 7.0 | 6.42 | 8.0 | 7.91 |
| 5.0 | 5.68 | 5.0 | 4.74 | 5.0 | 5.73 | 8.0 | 6.89 |
參見
參考文獻
- F.J. Anscombe, "Graphs in Statistical Analysis," American Statistician, 27 (February 1973), 17-21.
- Tufte, Edward R. (2001). The Visual Display of Quantitative Information, 2nd Edition, Cheshire, CT: Graphics Press. ISBN 0961392142
- Sangit Chatterjee and Aykut Firat (2007). "Generating Data with Identical Statistics but Dissimilar Graphics: A Follow up to the Anscombe Dataset", American Statistician, 61(3), 248-254. doi:10.1198/000313007X220057
外部連結
Wikiwand - on
Seamless Wikipedia browsing. On steroids.

 ...
...