科学可视化
来自维基百科,自由的百科全书
科学可视化(英语:scientific visualization 或 scientific visualisation)是科学之中的一个跨学科研究与应用领域,主要关注的是三维现象的可视化,如建筑学、气象学、医学或生物学方面的各种系统。重点在于对体、面以及光源等等的逼真渲染,或许甚至还包括某种动态(时间)成分[1]。

科学可视化侧重于利用计算机图形学来创建客观的视觉图像,将数学方程等文字资讯转换大量压缩呈现在一张图纸上,从而帮助人们理解那些采取错综复杂而又往往规模庞大的方程、数字等等形式所呈现的科学概念或结果[2],除有助于公众吸收之外,重要的是便于专家快速了解状况,在同样时间内做出有效的筛选和判断。
概述
美国计算机科学家布鲁斯·麦考梅克在其1987年关于科学可视化的定义之中,首次阐述了科学可视化的目标和范围:“利用计算机图形学来创建视觉图像,帮助人们理解科学技术概念或结果的那些错综复杂而又往往规模庞大的数字表现形式”[2] 。
1982年2月,美国国家科学基金会在华盛顿召开了科学可视化技术的首次会议,会议认为“科学家不仅需要分析由计算机得出的计算数据,而且需要了解在计算过程中的数据变换,而这些都需要借助于计算机图形学以及图像处理技术”。
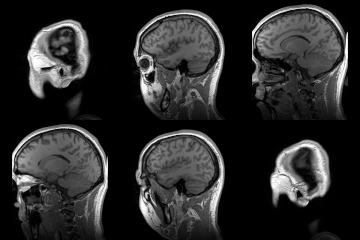
此类数字型表现形式或数据集可能会是液体流型或分子动力学之类计算机模拟的输出,或者经验数据(如利用地理学、气象学或天体物理学设备所获得的记录)。就医学数据(CT、MRI、PET等),常常听说的一条术语就是“医学可视化”[3]。
科学可视化本身并不是最终目的,而是许多科学技术工作的一个构成要素。这些工作之中通常会包括对于科学技术数据和模型的解释、操作与处理。科学工作者对数据加以可视化,旨在寻找其中的种种模式、特点、关系以及异常情况;换句话说,也就是为了帮助理解。因此,应当把可视化看作是任务驱动型,而不是数据驱动型[3][4]。
历史
科学的可视化与科学本身一样历史悠久。传说,阿基米德被害时正在沙子上绘制几何图形。就像其中包含等值线(isolines)的地磁图以及表示海上主要风向的箭头图那样,天象图也产生于中世纪。很久以前,人们就已经理解了视知觉在理解数据方面的作用[5] 。作为一个利用计算机的学科,科学可视化领域如今依然还属于新事物。其发端于美国国家科学基金会1987年关于“科学计算领域之中的可视化”的报告[6]。
总结
视角
科学可视化的起源可以追溯到真空管计算机时代,并与计算机图形学的发展齐头并进。早期的软件曾经都是自己编制的,且设备昂贵。当时,研究人员所做的是对科学现象的动态情况加以建模,而好莱坞则开始注重那些让各种事物看起来华丽缤纷的算法。1980年代中期,当高性能计算技术造就了人们对于分析、发现及通讯手段的更高需求的时候,形式与功能才走到了一起[7]。形形色色的传感器和超级计算机模拟为人们提供了数量如此庞大的数据,以致人们不得不求助于新的,远为精密复杂的可视化算法和工具[5] 。
1986年10月,美国国家科学基金会主办了一次名为“图形学、图像处理及工作站专题讨论”(原文:Panel on Graphics, Image Processing and Workstations)的会议,旨在针对那些开展高级科学计算(scientific computing,又称为“计算科学”)工作的研究机构,提出关于图形硬件和软件采购方面的建议。图形学和影像学技术方法在计算科学方面的应用,当时乃是一项新的领域;上述专题组成员把该领域称为“科学计算之中的可视化”(英文:Visualization in Scientific Computing,ViSC)。该专题组认为,科学可视化乃是正在兴起的一项重大的基于计算机的技术,需要联邦政府大力加强对它的支持[8]。

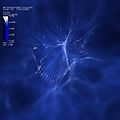
颜色表示的是相应速度原子的数量。红色表示相应速度的原子数量较少;白色表示相应速度的原子数量较多。最低速度显示白色或浅蓝色。
左:发生玻色-爱因斯坦凝聚之前;中:玻色-爱因斯坦凝聚刚刚开始;右:几乎所有剩余的原子都处于玻色-爱因斯坦凝聚状态。
1987年,首届“科学计算之中的可视化”研讨会召集了众多来自学术界、行业以及政府部门的研究人员。其报告概括总结了科学可视化——这幅“科学画卷“(英文:scientific imagery)的全景及其未来需求[9]。布鲁斯·麦考梅克在1987年的报告中称:
科学工作者需要数字的一种替代形式。无论是现在还是未来,图像的运用在技术上都是现实可行的,并将成为知识的一个必备前提。对于科学工作者来说,要保证分析工作的完整性,促进深入细致地开展检查审核工作以及与他人沟通交流如此深入细致的结果,绝对不可或缺的就是对计算结果和复杂模拟的可视化能力……科学计算的目的在于观察或审视,而不是列举。据估计,与视觉相关的大脑神经元多达50%。科学计算之中的可视化正是旨在让这种神经机制发挥起作用来[10]。
这份报告所阐明的一点就是,可视化具有培育和促进主要科学突破的潜力。这有助于将计算机图形学、图像处理、 计算机视觉、计算机辅助设计、信号处理以及关于人机界面的研究工作统一起来。在与各种会议、期刊杂志以及商业展览相配合的情况下,这培育和促进了相关的研究与开发工作,包括从高级科学计算工作站硬件、软件以及网络技术,直至录像磁带、书籍、CD光盘等等[7]。此后,科学可视化获得了极大的发展,并且于二十世纪90年代,成为了举世公认的一门学科[5]。
1990年代初期,先后出现了许多不同的科学可视化方法和手段。
- 1991年,埃德·弗格森把“科学可视化”定义为一种方法学,即科学可视化是“一门多学科性的方法学,其利用的是很大程度上相互独立而又彼此不断趋向融合的诸多领域,包括计算机图形学、图像处理、计算机视觉、计算机辅助设计、信号处理以及用户界面研究。其特有的目标的就是作为科学计算与科学洞察之间的一种催化剂而发挥作用。为满足那些日益增长的,对于处理极其活跃而又非常密集的数据源的需求,科学可视化应运而生”[12]。
目前,《大英百科全书》依然把科学可视化作为计算机图形学的组成部分。这部百科全书利用图片和动画的形式来展现对于各种科学事件的模拟,如恒星的诞生、龙卷风的演变等等……[14]。
最近,2007年召开的ACM SIGGRAPH科学可视化研讨会,就科学可视化的原理和应用开展了教育培训活动[15]。其中,所介绍的基本概念包括可视化、人类知觉、科学方法以及关于数据的方方面面,如数据的采集、分类、存储和检索(retrieval)。他们所已经确定的可视化技术方法包括二维、三维以及多维可视化技术方法,如色彩变换(color transformations)、高维数据集符号、气体和液体信息可视化、立体渲染、等值线(isolines)和等值面、着色、颗粒跟踪、动画、虚拟环境技术以及交互式驾驶(interactive steering)。进一步延伸的主题则包括交互技术、已有的可视化系统与工具、可视化方面的美学问题,而相关主题则包括数学方法、计算机图形学以及通用的计算机科学[15]。
现如今,一些定义有时还对“科学可视化”与“信息可视化”之间差别作出了规定。比如,ETH Zurich提出,科学可视化提供的是图形化表现形式数值型数据,以便对这些数据进行定性和定量分析。与全自动分析(比如,借助于统计学方法)相比,科学可视化最终的分析步骤则是留给了用户,从而对人类视觉系统的能力加以了利用。科学可视化不同于与之相关的信息可视化领域,因为科学可视化侧重于那些代表时空连续函数之样本的数据,而不是那些内在离散的数据[16]。
科学可视化方面的主题
|
计算机动画是利用计算机创建动态图像的艺术、方法、技术和科学[26]。如今,计算机动画的创建工作越来越多地采用三维计算机图形学手段,尽管二维计算机图形学当前依然广泛应用于体裁化、低带宽以及更快实时渲染的需求。有时,动画的目标载体就是计算机本身,而有时其目标则是别的介质(medium),如电影胶片。另外,计算机动画有时又称为电脑成像技术或计算机生成图像;在用于电影胶片的时候,甚至还会被称为电脑特效。
计算机模拟,又称为计算机仿真,是指计算机程序或计算机网络试图对于特定系统模型的模拟[27]。对于许许多多系统的数学建模来说,计算机模拟都已经成为有效实用的组成部分。比如,这些系统包括物理学、计算物理学、化学以及生物学领域的天然系统;经济学、心理学以及社会科学领域的人类系统。在工程设计过程以及新技术当中,计算机模拟旨在深入认识和理解这些系统的运行情况或者观察它们的行为表现[28]。对某一系统同时进行可视化与模拟的过程,称为视觉化[29]。
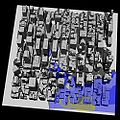
根据规模的不同,计算机模拟所需的时间也各不相同,包括从只需运行几分钟的计算机程序,到需要运行数小时的基于网络的计算机群,直至需要持续不断运行数日之久的大型模拟。计算机模拟所模拟事件的规模已经远远超出了传统铅笔纸张式数学建模所能企及的任何可能(甚至是任何可以想像的事情):十多年前,关于一支军队进攻另一军队的沙漠战役模拟,采用了美国国防部高性能计算现代化项目(High Performance Computing Modernization Program)的多台超级计算机。其中,在其模拟的科威特周围地区范围内,所建模的坦克、卡车以及其他的交通工具就多达66,239辆[30]。

信息可视化的研究对象是大规模非数字型信息的视觉表达(representation)问题。此类信息如软件系统之中众多的文件或者代码行[31]、图书馆与文献书目数据库以及国际互联网上的关系网络等等[32]。
信息可视化集中关注的是建立以直观的方式传达抽象信息的手段和方法。可视化的表达形式与交互技术则是利用人类眼睛通往心灵深处的广阔带宽优势,使得用户能够目睹、探索以至立即理解大量的信息[33]。
界面技术与感知所要揭示的就是,新的界面以及对于基本感知(perception)问题的深入理解,将会如何为科学可视化领域创造新的机遇[5]。
在计算机图形学当中,渲染是指利用计算机程序,依据模型生成图像的过程。其中,模型是采用严格定义的语言或数据结构而对于三维对象的一种描述;这种模型之中一般都会含有几何学、视角、纹理、照明以及阴影(shading)方面的信息;渲染所产生的图像则是一种数字图像或位图(又称光栅图)[34]。“渲染”一词可能是对艺术家渲染画面场景的一种类比。另外,渲染还用于描述为了生成最终的视频输出而在视频编辑文件之中计算效果的过程。表面渲染(surface rendering),又称为表面绘制。立体渲染,又称为体渲染、体绘制或者立体绘制,指的是一种用于展现三维离散采样数据集之二维投影(2D projection)的技术方法。典型的三维数据集就是利用CT[19]、MRI[20]或PET[17][35]技术所采集和重建出来的一组二维切片图像。通常情况下,这些图像都是按照某种规则的模式(比如,每毫秒一层)而采集和重建的;因而,在同样的规则模式下,这些图像分别都具有相同的像素数量。这些是一类关于规则立体网格的例子;其中,每个立体元素或者说体素分别采用单独一个取值来表示,而这种取值是通过在相应体素周围毗邻区域采样而获得的。重要的渲染技术方法包括:
- 扫描线渲染[36][37][38]与栅格化
- 图像的高级表达形式之中必然含有不同于像素方面的一些要素。这些要素被称为基元[39]。例如,就示意图(schematic drawing)的绘制而言,线段和曲线可能就属于是其中的基元。在图形用户界面之中,基元则可能是窗口和按钮。在三维渲染当中,基元则可能是位于三维空间之中的三角形和多边形。
- 光线投射
- 光线投射(ray casting)主要用于实时模拟,如三维计算机游戏和卡通动画之中所采用的模拟手段(其中,细节并不重要,或者为了在计算阶段获得更好的性能,采用手工方式仿造细节的办法更为有效)[40]。当有大量的帧需要实现动画效果的时候,尤其是如此。在不额外采用任何其他技巧的情况下,最终所获得的表面都会带有一种特征性的“平板”效果,就好像场景之中的那些对象全都涂上了哑光(matte finish)似的。
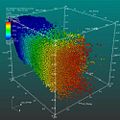
立体可视化(volume visualization),又称为体视化或三维可视化,研究的是一套旨在实现在无须数学上表达另一面(背面)的情况下查看对象的技术方法。立体可视化最初用于医学成像,而如今已经成为许多学科领域的一项基本技术。当前,对于各种现象的描绘,如云彩、水流、分子结构以及生物结构,立体可视化已经成为不可或缺的一项技术方法。许多立体可视化算法都具有高昂的计算代价,需要大量的数据存储能力。目前,硬件和软件方面的种种进展正在不断促进着立体可视化和实时性能的发展[5]。
科学可视化的应用
本节将列举一系列关于当今可以如何运用科学可视化的示例[44]。
- 地形地貌的渲染:目前,存在着不止一种用于渲染生成地形地貌图像的算法[50][51][52]。VisIt能够读取地理信息系统领域的几种常见格式的文件,从而使用户能够在其可视化形式之中渲染诸如地形地貌数据之类的栅格型数据。上述精选图片(左一)显示的是一幅其中包括有美国加利福尼亚邓斯缪尔附近山区数据的DEM数据集。图中所添加的海拔线(elevation lines)有助于描绘海拔上的变化。
- 表面形貌(topographical surfaces)的计算机绘制(mapping):利用计算机绘制表面形貌,数学家们可以检验有关在应力条件下各种材料(materials)将会如何发生变化的理论。这项成像任务乃是NSF所资助的,美国芝加哥伊利诺伊大学电子可视化实验室(Electronic Visualization Laboratory,EVL)的工作之一。
- 曲线图:VisIt可以利用读取自文件的数据来绘制曲线。借助于相应的操作符(lineout)或查询,尚可用于从高维数据集(higher dimensional datasets)之中提取和绘制曲线数据。这幅精选图片(左二)之中的曲线是利用VisIt的lineout功能所绘制的,且对应于分布在DEM数据海拔线之上的海拔数据。Lineout使用户能够以交互的方式绘制线条,从而详细指定用于提取数据的路径。继而,VisIt即可把最终所获得的数据绘制成曲线[56]。
- 保时捷911模型:NASTRAN模型。该精选图片(左一)是从NASTRAN批量数据文件之中导入的保时捷911模型的网格图[56]。VisIt可读取NASTRAN批量数据文件的有限子集。通常,这种有限子集足以导入模型之中的那些适合于可视化的几何学特征。
- YF-17 飞机制图:该精选图片(左二)显示的是用于呈现YF-17喷气式飞机CGNS数据集的图形。该数据集由一个非结构化网格构成。在创建该图像时,VisIt利用该数据集的Mach(马赫数)变量来绘制伪彩图(pseudocolor plot),该网格的网格图以及速度场切片的矢量图[56]。
科学可视化主要贡献者
- 布鲁斯·麦考梅克
- 布鲁斯·麦考梅克(1930 - 2007年)是一位美国计算机科学家。二十世纪50年代,他曾在MIT、剑桥大学以及哈佛大学从事过物理学研究。二十世纪60年代,他发起并指导了图像处理计算机项目,并率先建立了血流以及人视网膜黄斑退化(macular degeneracy)的成像技术。二十世纪80年代,他组织并主持了首届大脑绘图机设计研讨会(Brain Mapping Machine Design Workshop)(1985年)。在两年之后的1987年,他在美国国家科学基金会图形学、图像处理与工作站顾问委员会(National Science Foundation Advisory Panel on Graphics, Image Processing, and Workstations)上提出并倡导“科学可视化”的概念和思想[58]。
- 托马斯·德房蒂
- 托马斯·德房蒂(生于1948年)是一位美国计算机图形学研究人员以及电子可视化实验室的主任。他曾从事过数学和计算机信息科学方面的研究,并于1973年获得了计算机图形学研究方面的博士学位。后来,他加入了芝加哥伊利诺伊大学的教职员队伍,并继而陆续获得了众多的荣誉。与他人一起共同创立了电子可视化实验室,并在电影《星球大战》的计算机动画当中采样了EVL的硬件与软件[59]。德房蒂对SIGGRAPH的组织工作和大会的成长与发展做出了巨大的贡献。
- 玛克辛·布朗
- 玛克辛·布朗是一位美国计算机科学家以及电子可视化实验室的副主任。她也曾从事过数学方面的研究,并于二十世纪70年代从事计算机科学方面的研究工作。她在计算机图形学和超级计算(supercomputing)领域有着较长的工作历史,并对SIGGRAPH的许多方面都作出了贡献。


- 克利福德·皮寇弗
- 克利福德·皮寇弗是科学、数学以及科幻小说方面的一位美国作家、编辑和专栏作家。他的主要兴趣是通过融合艺术、科学、数学以及人类活动当中的其他看似互不相同的领域,寻找新的,拓展创造性的方式[60]。二十世纪90年代,他编写过几部书籍,如《Frontiers of Scientific Visualization》(意为“科学可视化之前沿”)(1994)和《Visualizing Biological Information》(意为“生物学信息之可视化”)(1995)。
- 劳伦斯·罗森布罗姆
- 劳伦斯·罗森布罗姆(生于1949年)是一位美国数学家以及美国国家科学基金会图形学与可视化计划的主任。罗森布罗姆的研究兴趣包括移动增强现实(mobile augmented reality)、科学可视化和不确定性可视化,虚拟现实显示,以及虚拟现实/增强现实系统的应用[61]。其研究小组取得进展的方面包括移动增强现实、科学可视化和不确定性可视化、虚拟现实显示、虚拟现实/增强现实系统的应用以及对于图形学系统之中人类表现的理解。
本领域的其他可视化专家包括:
- 唐娜·考克斯
- 帕特·汉恩拉罕
- 比尔·希巴德
- 吉姆·霍夫曼
- 克里斯·李洁明 (W3C)
- 朱利安·隆巴迪
- 迪特马尔·绍柏
- 詹妮弗·斯特拉尔
要了解更多可视化专家,请参见计算机图形学研究人员
科学可视化组织机构
科学可视化领域的重要实验室包括:
- 电子可视化实验室(Electronic Visualization Laboratory, EVL)
- 美国国家航空航天局戈达德科学可视化工作室(NASA Goddard Scientific Visualization Studio)[62]
科学可视化领域的重要会议包括:
- 欧洲图形学大会(Eurographics)
- 图形学大会(Graphicon):前苏联举办的最大规模的图形学会议
- IEEE可视化会议(IEEE Visualization conferences)
- SIGGRAPH图形学大会: 全球最大规模的计算机图形学会议
关于其他科学可视化组织机构,请参见:计算机图形学组织机构
参考文献
延伸阅读
外部链接
参见
Wikiwand - on
Seamless Wikipedia browsing. On steroids.


