File:New_Madrid_and_Wabash_seizmic_zones-USGS_mod.png
维基百科,自由的 encyclopedia
本预览的尺寸:547 × 599像素。 其他分辨率:219 × 240像素 | 438 × 480像素 | 748 × 819像素。
原始文件 (748 × 819像素,文件大小:430 KB,MIME类型:image/png)
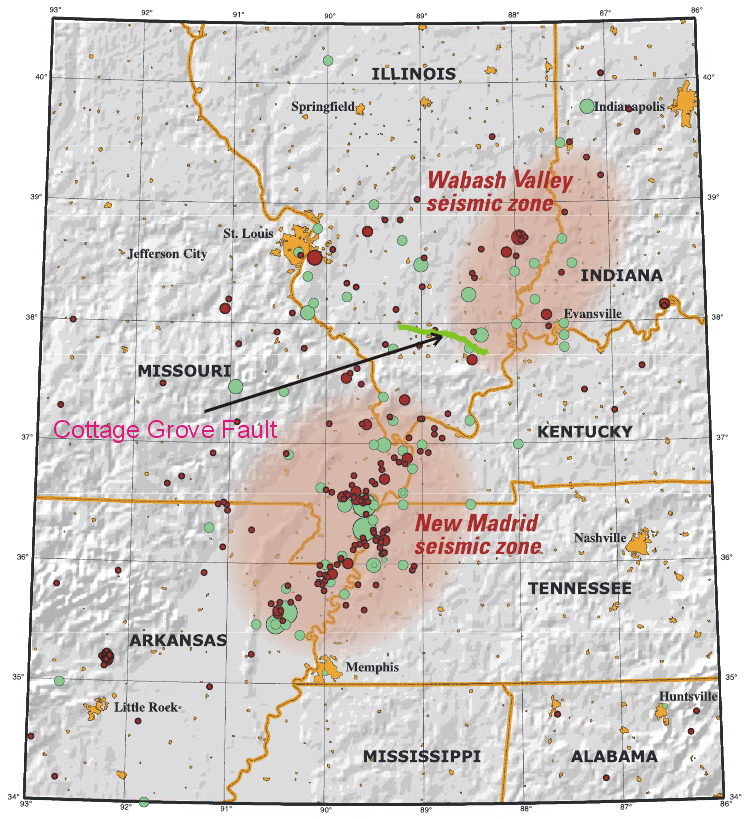
| 描述New Madrid and Wabash seizmic zones-USGS mod.png | This map of the New Madrid and Wabash Valley seismic zones shows earthquakes as circles. Red circles indicate earthquakes that occurred from 1974 to 2002 with magnitudes larger than 2.5 located using modern instruments (University of Memphis). Green circles denote earthquakes that occurred prior to 1974 (USGS Professional Paper 1527). Larger earthquakes are represented by larger circles. The Cottage Grove Fault is indicated by the green line. |
| 日期 | (UTC) |
| 来源 | |
| 作者 |
|
| 这是一张修改过的图片,这意味着它已在原版本的基础上通过软件进行了编辑,改动内容:Added Cottage Fault。其原始版本为:New Madrid and Wabash seizmic zones-USGS.png。修改者:Ruslik0。
|
| Public domainPublic domainfalsefalse |
|
Bahasa Indonesia ∙ català ∙ čeština ∙ Deutsch ∙ eesti ∙ English ∙ español ∙ français ∙ galego ∙ italiano ∙ Nederlands ∙ português ∙ polski ∙ sicilianu ∙ suomi ∙ Tiếng Việt ∙ Türkçe ∙ български ∙ македонски ∙ русский ∙ മലയാളം ∙ 한국어 ∙ 日本語 ∙ 中文 ∙ 中文(简体) ∙ 中文(繁體) ∙ العربية ∙ فارسی ∙ +/− |
原始上传日志
This image is a derivative work of the following images:
- File:New_Madrid_and_Wabash_seizmic_zones-USGS.png licensed with PD-USGov-USGS
- 2008-04-25T02:30:32Z Kbh3rd 748x819 (478218 Bytes) {{Information |Description=This map of the New Madrid and Wabash Valley seismic zones shows earthquakes as circles. Red circles indicate earthquakes that occurred from 1974 to
Uploaded with derivativeFX
说明
添加一行文字以描述该文件所表现的内容
此文件中描述的项目
描绘内容
440,546 字节
819 像素
748 像素
image/png
文件历史
点击某个日期/时间查看对应时刻的文件。
| 日期/时间 | 缩略图 | 大小 | 用户 | 备注 | |
|---|---|---|---|---|---|
| 当前 | 2009年6月11日 (四) 12:10 | | 748 × 819(430 KB) | Ruslik0 | Improved version |
| 2009年6月11日 (四) 10:13 |  | 748 × 819(431 KB) | Ruslik0 | {{Information |Description=This map of the New Madrid and Wabash Valley seismic zones shows earthquakes as circles. Red circles indicate earthquakes that occurred from 1974 to 2002 with magnitudes la |
文件用途
以下页面使用本文件:
全域文件用途
以下其他wiki使用此文件:
- en.wikipedia.org上的用途
- es.wikipedia.org上的用途
- pt.wikipedia.org上的用途
- tr.wikipedia.org上的用途
- uk.wikipedia.org上的用途