File:2005_Atlantic_hurricane_season_summary_map.png
维基百科,自由的 encyclopedia
本预览的尺寸:800 × 495像素。 其他分辨率:320 × 198像素 | 640 × 396像素 | 1,024 × 634像素 | 1,280 × 792像素 | 2,560 × 1,585像素 | 4,000 × 2,476像素。
原始文件 (4,000 × 2,476像素,文件大小:6.4 MB,MIME类型:image/png)
| 描述2005 Atlantic hurricane season summary map.png |
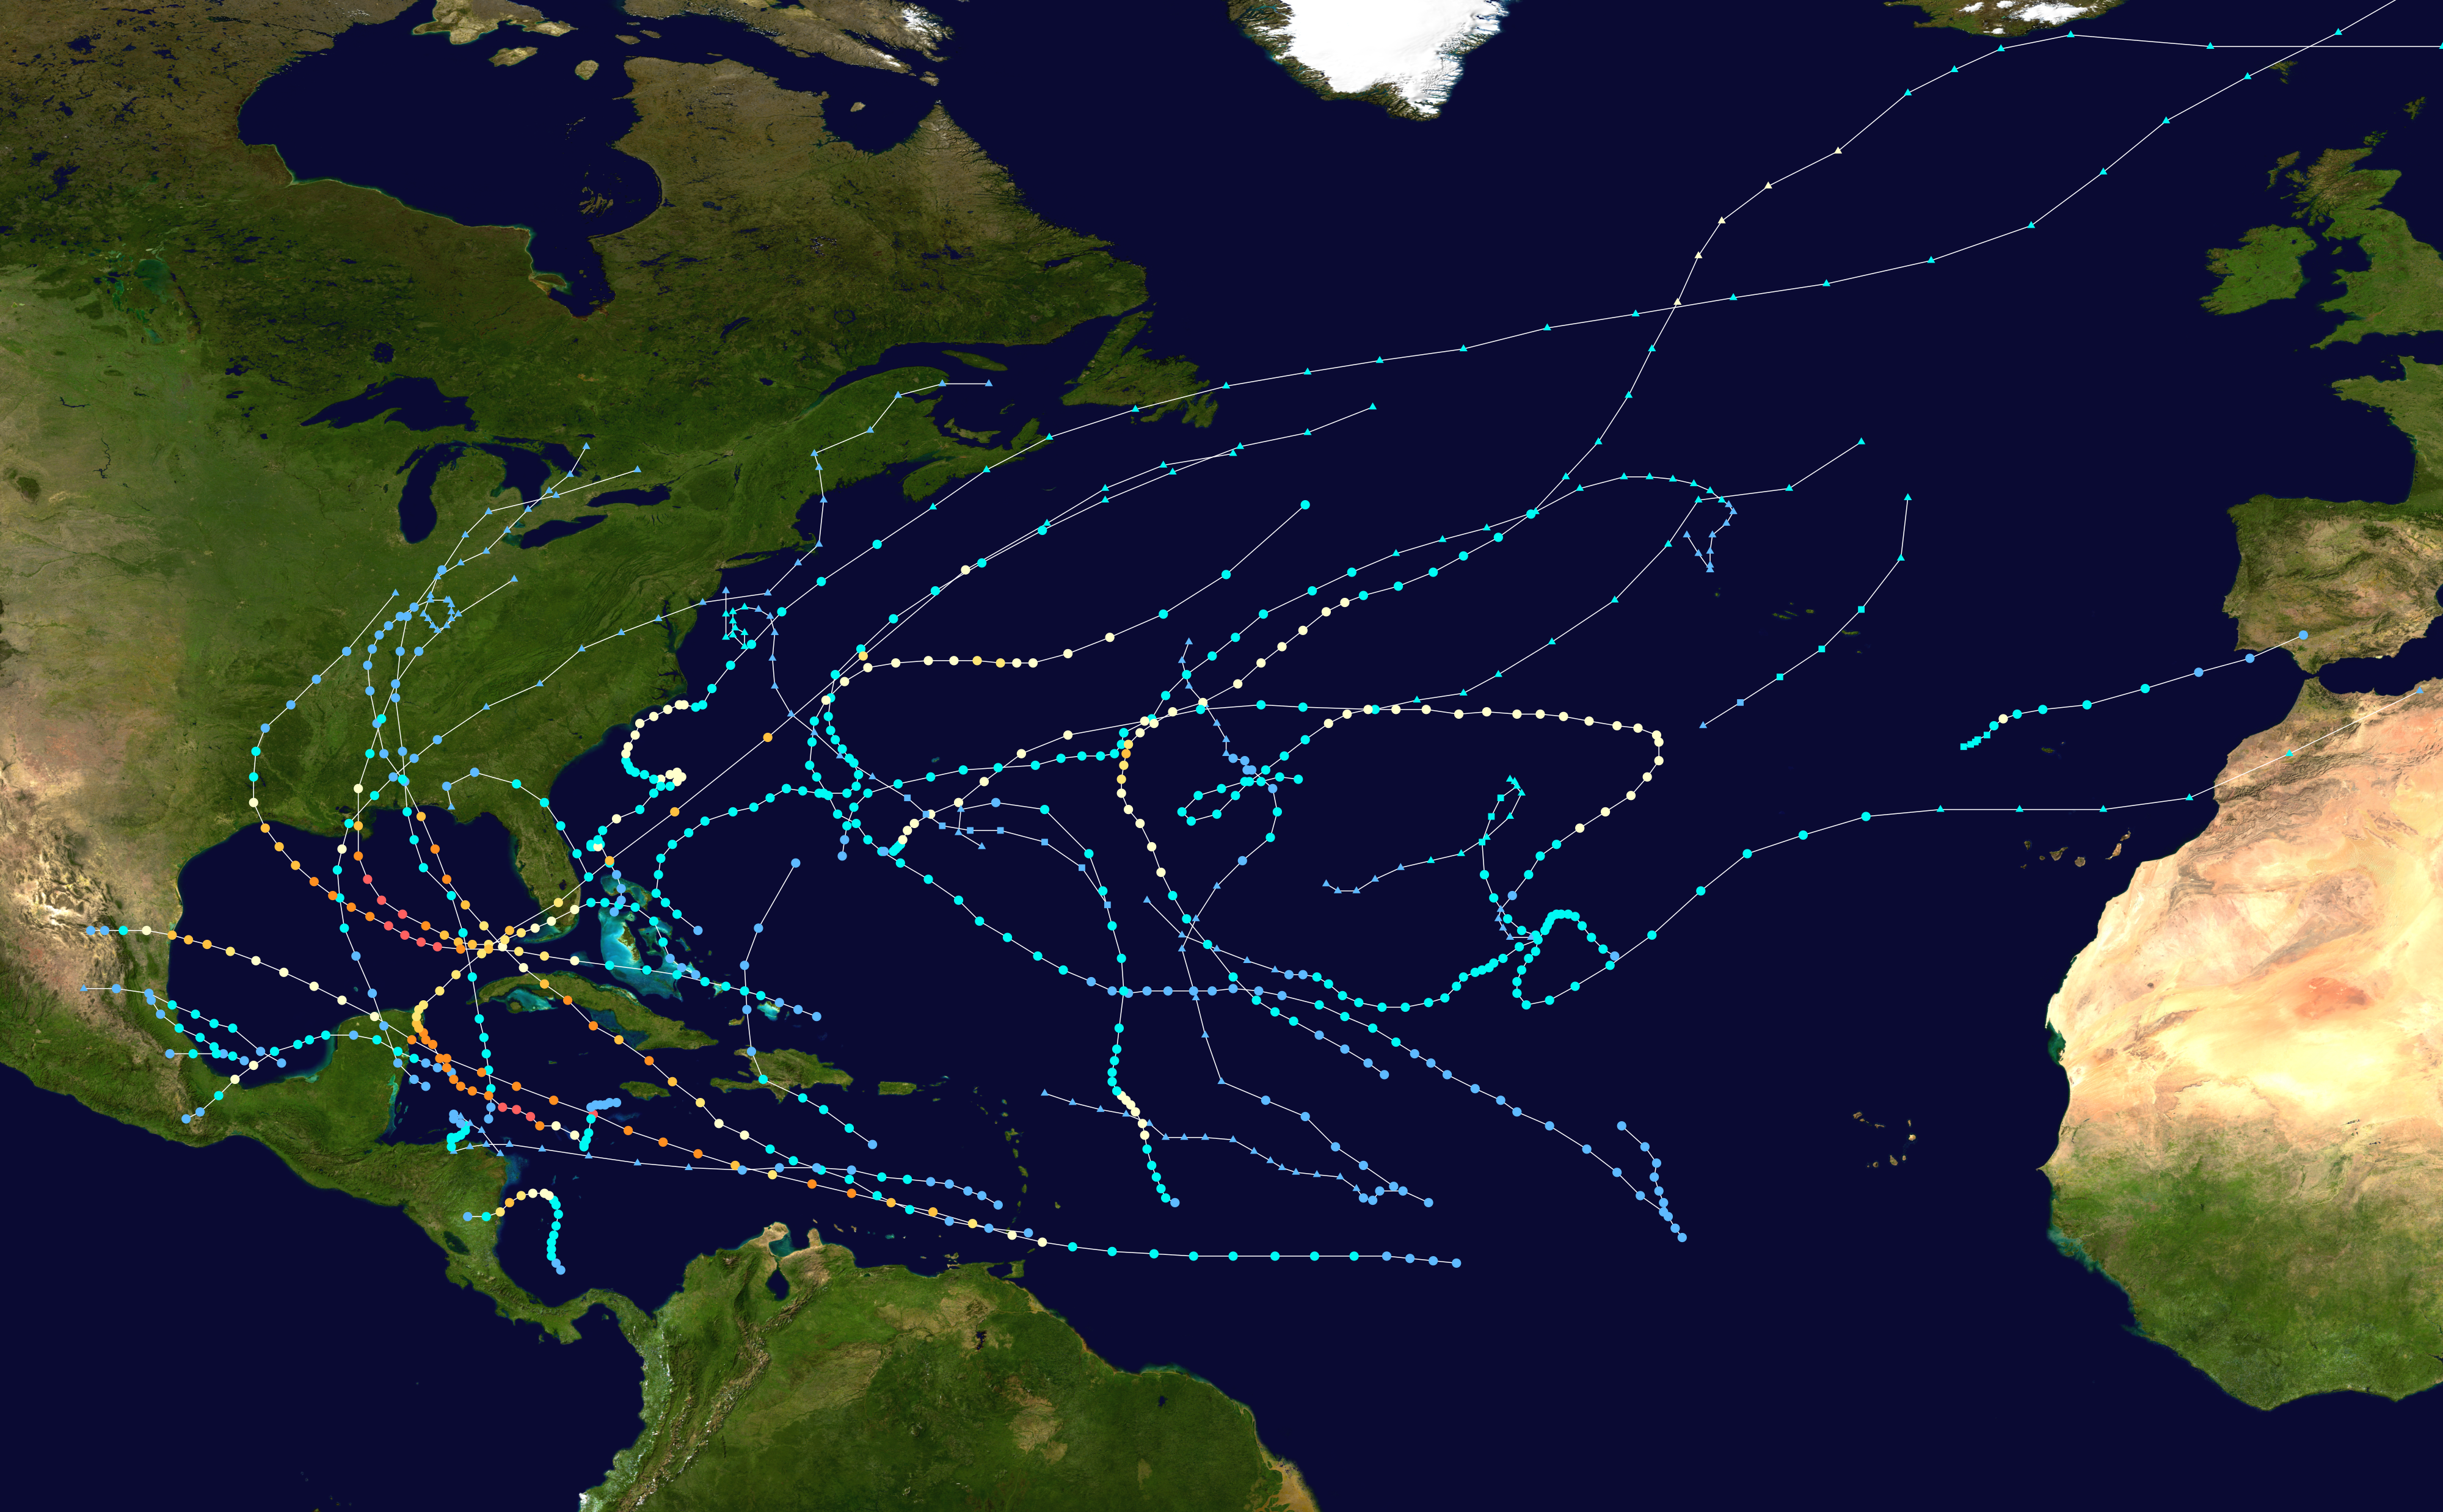
English: This map shows the tracks of all tropical cyclones in the 2005 Atlantic hurricane season. The points show the location of each storm at 6-hour intervals. The colour represents the storm's maximum sustained wind speeds as classified in the Saffir-Simpson Hurricane Scale (see below), and the shape of the data points represent the type of the storm.
Storm type |
| 来源 | Created using Wikipedia:WikiProject Tropical cyclones/Tracks. The background image is from NASA [1]. The tracking data is from the National Hurricane Center's Atlantic hurricane database |
| 作者 | Supportstorm |

|
This file may be updated to reflect new information. If you wish to use a specific version of the file without new updates being mirrored, please upload the required version as a separate file. |
| Public domainPublic domainfalsefalse |
| 本作品已被作者Supportstorm释出到公有领域。这适用于全世界。 在一些国家这可能不合法;如果是这样的话,那么: Supportstorm无条件地授予任何人以任何目的使用本作品的权利,除非这些条件是法律规定所必需的。 |
Any autoconfirmed user can overwrite this file from the same source. Read COM:OVERWRITE first.
说明
添加一行文字以描述该文件所表现的内容
此文件中描述的项目
描绘内容
image/png
6,709,291 字节
2,476 像素
4,000 像素
文件历史
点击某个日期/时间查看对应时刻的文件。
| 日期/时间 | 缩略图 | 大小 | 用户 | 备注 | |
|---|---|---|---|---|---|
| 当前 | 2019年11月29日 (五) 04:37 | | 4,000 × 2,476(6.4 MB) | Supportstorm | Corrected dimension/ higher res |
| 2019年10月5日 (六) 07:10 |  | 3,000 × 1,854(4.64 MB) | Es204L | Reverted to version as of 19:04, 9 June 2013 (UTC) | |
| 2019年4月10日 (三) 23:06 |  | 4,000 × 2,472(9.29 MB) | Es204L | 2005 b | |
| 2018年5月11日 (五) 04:51 |  | 3,000 × 1,854(4.64 MB) | Liam Betancourt | Back the summary map released on 2013 | |
| 2018年3月13日 (二) 21:10 |  | 4,000 × 2,472(9.29 MB) | HurricaneTyphoon2018 | Dimensions and size added both | |
| 2013年6月9日 (日) 19:04 |  | 3,000 × 1,854(4.64 MB) | Supportstorm | {{Hurricane season auto track map|start=|end=|source=ATL|type=hurricane|basin=Atlantic|year=2005|author=Supportstorm}} |
文件用途
以下22个页面使用本文件:
- 2005年大西洋颶風季
- 2005年大西洋飓风季时间轴
- Talk:2005年大西洋颶風季
- Talk:2005年大西洋飓风季时间轴
- User:Bluedecklibrary/2005年大西洋飓风季时间轴
- Wikipedia:优良条目/2005年大西洋飓风季
- Wikipedia:优良条目/2016年4月
- Wikipedia:优良条目/2016年4月4日
- Wikipedia:典范条目/2005年大西洋颶風季
- Wikipedia:典范条目/2015年12月
- Wikipedia:典范条目/2015年12月16日
- Wikipedia:典范条目/2016年3月
- Wikipedia:典范条目/2016年3月29日
- Wikipedia:典范条目/2018年3月
- Wikipedia:典范条目/2018年3月6日
- Wikipedia:典范条目/2018年6月
- Wikipedia:典范条目/2018年6月22日
- Wikipedia:典范条目/2021年7月
- Wikipedia:典范条目/2021年7月27日
- Wikipedia:典范条目/2022年1月
- Wikipedia:典范条目/2022年1月23日
- Wikipedia:特色列表/2005年大西洋飓风季时间轴
全域文件用途
以下其他wiki使用此文件:
- ar.wikipedia.org上的用途
- de.wikipedia.org上的用途
- en.wikipedia.org上的用途
- es.wikipedia.org上的用途
- fa.wikipedia.org上的用途
- fr.wikipedia.org上的用途
- hu.wikipedia.org上的用途
- it.wikipedia.org上的用途
- ja.wikipedia.org上的用途
- kn.wikipedia.org上的用途
- pt.wikipedia.org上的用途
- simple.wikipedia.org上的用途
- tr.wikipedia.org上的用途
- vi.wikipedia.org上的用途